TrueNAS Scale Performance Testing

I get a strange amount of enjoyment doing weird testing using hardware I find and get decent deals on. A while ago, I did some performance testing with 24 small SATA SSDs on a Sandy Bridge sever. TrueNAS Performance Questions - Hardware - Level1Techs Forums

Today I am starting a new adventure. Obviously this is not meant to be a direct apples-to-apples comparison, but I am moving onto bigger and better things :stuck_out_tongue:

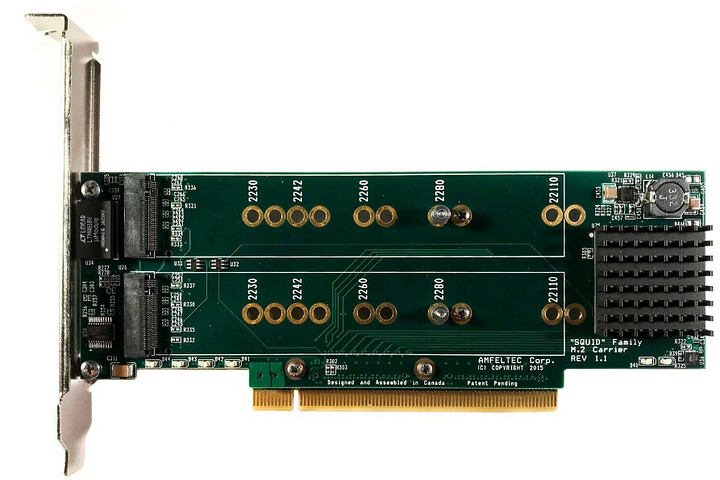
I managed to get a Amfeltec Squid card, this is a first generation product. It is a PCI-E 2.0 x16 card with a PLX chip and can hold 4 NVME SSDs. The card was designed for PRE-NVME AHCI based PCI-E SSDs like the Samsung PM951, so it’s fairly dated. I also picked up some 512GB 970 PROs for cheap, and I wanted to see what I can make work.

I’ve installed TrueNAS SCALE on a Cisco UCS C240 M3 with a pair of E5-2697 V2s, 256GB of 1600MHz RAM, the squid card, and an Intel 900p 280GB on a U.2 carrier card.

Using these settings:

fio --bs=128k --direct=1 --directory=/mnt/nvmepool/fio --gtod_r educe=1 --ioengine=posixaio --iodepth=32 --group_reporting --name=randrw --numjo bs=12 --ramp_time=10 --runtime=60 --rw=randrw --size=256M --time_based

I got the following results:

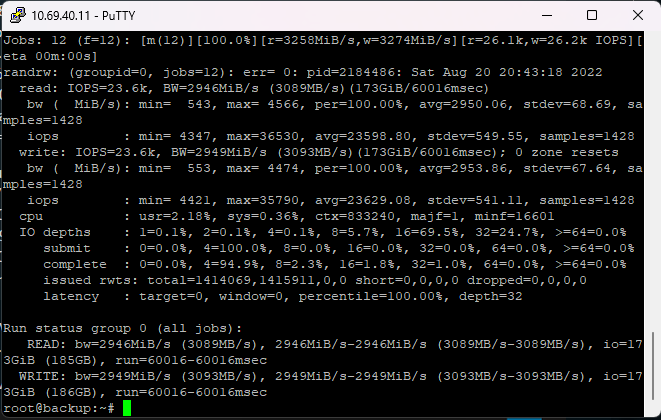
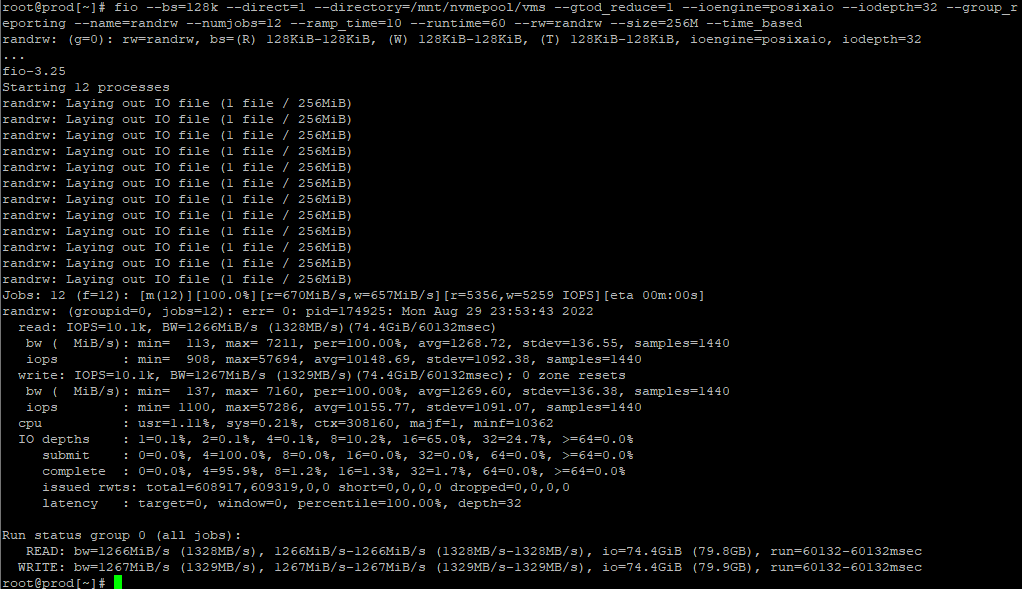
randrw: (groupid=0, jobs=12): err= 0: pid=34130: Wed Aug 10 20:53:24 2022
read: IOPS=38.3k, BW=4786MiB/s (5019MB/s)(281GiB/60015msec)
bw ( MiB/s): min= 3188, max= 6200, per=100.00%, avg=4787.27, stdev=55.38, sam ples=1432
iops : min=25507, max=49605, avg=38296.98, stdev=443.06, samples=1432
write: IOPS=38.3k, BW=4791MiB/s (5024MB/s)(281GiB/60015msec); 0 zone resets
bw ( MiB/s): min= 3193, max= 6123, per=100.00%, avg=4791.99, stdev=54.92, sam ples=1432
iops : min=25548, max=48990, avg=38334.69, stdev=439.36, samples=1432
cpu : usr=3.41%, sys=0.60%, ctx=1207515, majf=2, minf=12202
IO depths : 1=0.1%, 2=0.1%, 4=0.1%, 8=7.0%, 16=68.0%, 32=24.9%, >=64=0.0%
submit : 0=0.0%, 4=100.0%, 8=0.0%, 16=0.0%, 32=0.0%, 64=0.0%, >=64=0.0%
complete : 0=0.0%, 4=95.3%, 8=1.8%, 16=1.6%, 32=1.2%, 64=0.0%, >=64=0.0%
issued rwts: total=2297878,2300252,0,0 short=0,0,0,0 dropped=0,0,0,0
latency : target=0, window=0, percentile=100.00%, depth=32

Run status group 0 (all jobs):
READ: bw=4786MiB/s (5019MB/s), 4786MiB/s-4786MiB/s (5019MB/s-5019MB/s), io=281 GiB (301GB), run=60015-60015msec
WRITE: bw=4791MiB/s (5024MB/s), 4791MiB/s-4791MiB/s (5024MB/s-5024MB/s), io=281 GiB (302GB), run=60015-60015msec

As a price comparison with my previous adventure I can say the following:
24x180GB SSDs, at about $20 each, cost about $400.
TheArtOfServer is selling H220 HBA cards for about $90
I picked up the server in that previous post and remaining parts (NIC, RAM, CPU) for about $300
All in, that solution was just under $800

This adventure:
Amfeltec Squid card: $100
Samsung 970 Pro 512: 4x $70 = $280
Optane 900p: $180
Server & remaining parts (NIC, RAM, CPU) for about $300
Solution was about $860

So for about the same price all in, I went from 28k IOPS and 3500MB/s with the best performing SATA SSD based test (two 11-drive RAID Z1s)

to about 38K IOPS and 4800 MB/s with 4 NVME drives configured as 2 ZFS mirrors (at PCI-E 2!), and the Optane drive as a SLOG.

Just figured I’d post here for the next guy to see.

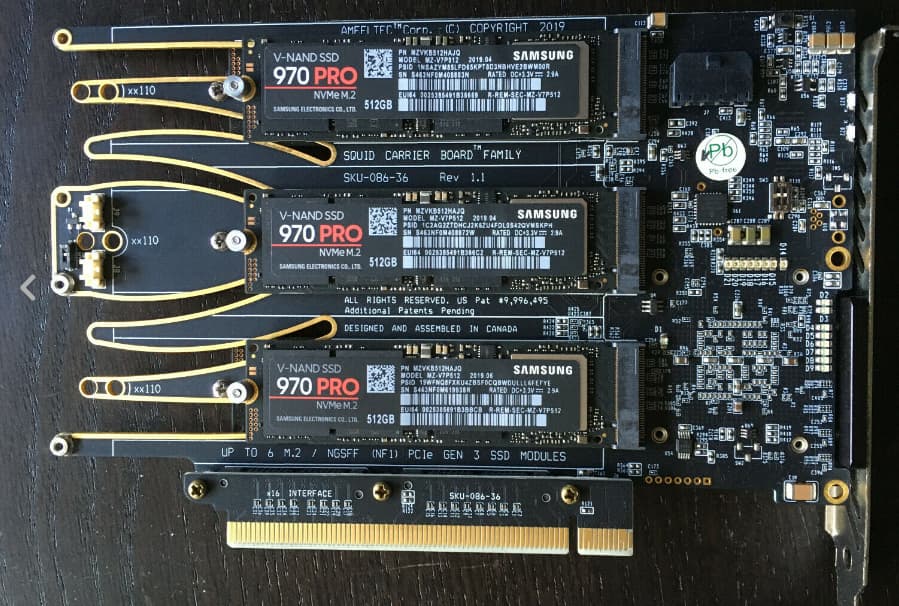
This seller on eBay is selling the newer version of the card I have with 6 NVME drives on a PCI-E x16 carrier card with a Gen3 PLX chip.
PCIe G3 Squid with 6x 512 GB NVMeM.2 sticks - Samsung 970 Pro - Amfeltec 2019 | eBay

Wish I had some more disposable income :stuck_out_tongue: Next go-around I’ll have to get a Haswell/Broadwell server and test one of those bad boys.

These cards are special in that they work in motherboards (such as older Ivybridge servers) that don’t support bifurcation. If anyone knows of similar cards at PCI-E 3.0 for <$200 let me know. I would be interested to see if I can double my throughput on this platform with these drives.

I think this pretty well illustrates just how much faster drives have gotten between like 2012 and 2016. With 5 drives out performing 24 drives, this is pretty impressive. Obviously there’s been another 6 years of advancements since then :man_shrugging:

I should do some 10K or 15K SAS testing for comparisons sake lol

4 Likes

Interesting setup and test.

I have a similar setup, but using a Highpoint 16 lane PCIe Gen3 PLX card to connect my 4x Samsung 970 Pro 1TB SSDs.
Other relevant specs:
i7-5930, 128GB DDR4 3200, Fedora 36.

Let me start by replicating your test to see if there is any benefit to the PCIe Gen3 controller:

[test]# zpool create new mirror nvme3n1p2 nvme1n1p2 mirror nvme2n1p2 nvme0n1p2
[test]# fio --bs=128k --direct=1 --directory=/new --gtod_reduce=1 --ioengine=posixaio --iodepth=32 --group_reporting --name=randrw --numjobs=12 --ramp_time=10 --runtime=60 --rw=randrw --size=256M --time_based
fio-3.26
Starting 12 processes
Jobs: 12 (f=12): [m(12)][100.0%][r=4403MiB/s,w=4381MiB/s][r=35.2k,w=35.0k IOPS][eta 00m:00s]     
randrw: (groupid=0, jobs=12): err= 0: pid=133178: Thu Aug 11 19:04:15 2022
  read: IOPS=33.3k, BW=4167MiB/s (4369MB/s)(244GiB/60019msec)
   bw (  MiB/s): min= 2316, max= 6600, per=100.00%, avg=4173.75, stdev=70.33, samples=1428
   iops        : min=18529, max=52799, avg=33387.28, stdev=562.66, samples=1428
  write: IOPS=33.4k, BW=4172MiB/s (4375MB/s)(245GiB/60019msec); 0 zone resets
   bw (  MiB/s): min= 2308, max= 6641, per=100.00%, avg=4179.18, stdev=70.40, samples=1428
   iops        : min=18465, max=53129, avg=33430.65, stdev=563.24, samples=1428
  cpu          : usr=4.14%, sys=0.83%, ctx=1834857, majf=0, minf=699
  IO depths    : 1=0.1%, 2=0.1%, 4=0.3%, 8=11.9%, 16=64.0%, 32=23.7%, >=64=0.0%
     submit    : 0=0.0%, 4=100.0%, 8=0.0%, 16=0.0%, 32=0.0%, 64=0.0%, >=64=0.0%
     complete  : 0=0.0%, 4=95.9%, 8=1.0%, 16=1.4%, 32=1.8%, 64=0.0%, >=64=0.0%
     issued rwts: total=2000369,2003027,0,0 short=0,0,0,0 dropped=0,0,0,0
     latency   : target=0, window=0, percentile=100.00%, depth=32

Run status group 0 (all jobs):
   READ: bw=4167MiB/s (4369MB/s), 4167MiB/s-4167MiB/s (4369MB/s-4369MB/s), io=244GiB (262GB), run=60019-60019msec
  WRITE: bw=4172MiB/s (4375MB/s), 4172MiB/s-4172MiB/s (4375MB/s-4375MB/s), io=245GiB (263GB), run=60019-60019msec

Not bad, but inferior to your test results.

Can we improve on that in a raid0 configuration?

[test]# zpool create new  nvme3n1p2 nvme1n1p2  nvme2n1p2 nvme0n1p2
[test]# fio --bs=128k --direct=1 --directory=/new --gtod_reduce=1 --ioengine=posixaio --iodepth=32 --group_reporting --name=randrw --numjobs=12 --ramp_time=10 --runtime=60 --rw=randrw --size=256M --time_based

fio-3.26
Starting 12 processes
Jobs: 12 (f=12): [m(12)][100.0%][r=4521MiB/s,w=4481MiB/s][r=36.2k,w=35.8k IOPS][eta 00m:00s]
randrw: (groupid=0, jobs=12): err= 0: pid=174490: Thu Aug 11 19:07:38 2022
  read: IOPS=36.2k, BW=4522MiB/s (4742MB/s)(265GiB/60017msec)
   bw (  MiB/s): min= 2979, max= 6646, per=100.00%, avg=4530.63, stdev=57.94, samples=1416
   iops        : min=23836, max=53171, avg=36242.53, stdev=463.97, samples=1416
  write: IOPS=36.2k, BW=4527MiB/s (4747MB/s)(265GiB/60017msec); 0 zone resets
   bw (  MiB/s): min= 2956, max= 6604, per=100.00%, avg=4536.05, stdev=57.94, samples=1416
   iops        : min=23650, max=52959, avg=36285.81, stdev=464.04, samples=1416
  cpu          : usr=4.39%, sys=0.85%, ctx=1872558, majf=0, minf=700
  IO depths    : 1=0.1%, 2=0.1%, 4=0.3%, 8=14.7%, 16=60.9%, 32=24.0%, >=64=0.0%
     submit    : 0=0.0%, 4=100.0%, 8=0.0%, 16=0.0%, 32=0.0%, 64=0.0%, >=64=0.0%
     complete  : 0=0.0%, 4=96.3%, 8=0.7%, 16=1.0%, 32=2.0%, 64=0.0%, >=64=0.0%
     issued rwts: total=2170977,2173512,0,0 short=0,0,0,0 dropped=0,0,0,0
     latency   : target=0, window=0, percentile=100.00%, depth=32

Run status group 0 (all jobs):
   READ: bw=4522MiB/s (4742MB/s), 4522MiB/s-4522MiB/s (4742MB/s-4742MB/s), io=265GiB (285GB), run=60017-60017msec
  WRITE: bw=4527MiB/s (4747MB/s), 4527MiB/s-4527MiB/s (4747MB/s-4747MB/s), io=265GiB (285GB), run=60017-60017msec

Yes, improvement, but not the 2x that we would hope for… in fact I am still not matching your test results…
What’s going on??? Where is that bottleneck???

Let me try something else…
Testing md raid0:

fio-3.26
Starting 12 processes
Jobs: 12 (f=12): [m(12)][100.0%][r=3339MiB/s,w=3401MiB/s][r=26.7k,w=27.2k IOPS][eta 00m:00s]
randrw: (groupid=0, jobs=12): err= 0: pid=118676: Thu Aug 11 18:54:18 2022
  read: IOPS=26.5k, BW=3317MiB/s (3478MB/s)(194GiB/60017msec)
   bw (  MiB/s): min= 3080, max= 3558, per=100.00%, avg=3319.45, stdev= 7.69, samples=1434
   iops        : min=24640, max=28464, avg=26554.66, stdev=61.49, samples=1434
  write: IOPS=26.6k, BW=3323MiB/s (3484MB/s)(195GiB/60017msec); 0 zone resets
   bw (  MiB/s): min= 2954, max= 3652, per=100.00%, avg=3325.13, stdev=11.53, samples=1434
   iops        : min=23637, max=29222, avg=26600.08, stdev=92.25, samples=1434
  cpu          : usr=1.40%, sys=0.31%, ctx=793308, majf=0, minf=699
  IO depths    : 1=0.1%, 2=0.1%, 4=0.1%, 8=23.3%, 16=51.7%, 32=25.0%, >=64=0.0%
     submit    : 0=0.0%, 4=100.0%, 8=0.0%, 16=0.0%, 32=0.0%, 64=0.0%, >=64=0.0%
     complete  : 0=0.0%, 4=97.4%, 8=0.1%, 16=0.3%, 32=2.4%, 64=0.0%, >=64=0.0%
     issued rwts: total=1592285,1595132,0,0 short=0,0,0,0 dropped=0,0,0,0
     latency   : target=0, window=0, percentile=100.00%, depth=32

Run status group 0 (all jobs):
   READ: bw=3317MiB/s (3478MB/s), 3317MiB/s-3317MiB/s (3478MB/s-3478MB/s), io=194GiB (209GB), run=60017-60017msec
  WRITE: bw=3323MiB/s (3484MB/s), 3323MiB/s-3323MiB/s (3484MB/s-3484MB/s), io=195GiB (209GB), run=60017-60017msec

Disk stats (read/write):
    md0: ios=1851197/1854438, merge=0/0, ticks=689782/106513, in_queue=796295, util=99.91%, aggrios=462863/463670, aggrmerge=0/15, aggrticks=171678/26402, aggrin_queue=198120, aggrutil=98.38%
  nvme1n1: ios=461904/464584, merge=0/28, ticks=201412/26398, in_queue=227850, util=98.37%
  nvme2n1: ios=463023/463498, merge=0/0, ticks=154779/26403, in_queue=181225, util=98.10%
  nvme3n1: ios=463348/463197, merge=0/0, ticks=168483/26383, in_queue=194907, util=98.38%
  nvme0n1: ios=463180/463403, merge=0/33, ticks=162038/26424, in_queue=188500, util=98.26%

Ouch!

1 Like

Hmmm.

What is your RAM configuration?

1 Like

My system has 8x 16GB DDR4 sticks running at 3200MT/s. The CPU/X99 chipset has quad channel support.

1 Like

Hmm.

So my system is
DDR3 1600
so 800x2x64=102.4 Gbps and 4 memory channels so 409.6 Gbps and two CPUs so 819.2 Gbps

Yours is
DDR4 3200
so 1600x2x64= 2044.4 Gbps, and 4 memory channels so the same 819.2 Gbps.

Not a memory bottleneck.

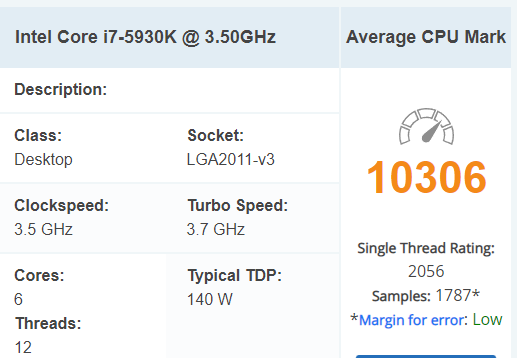
CPU you are at a passmark score of 10306 and single thread at 2056
image

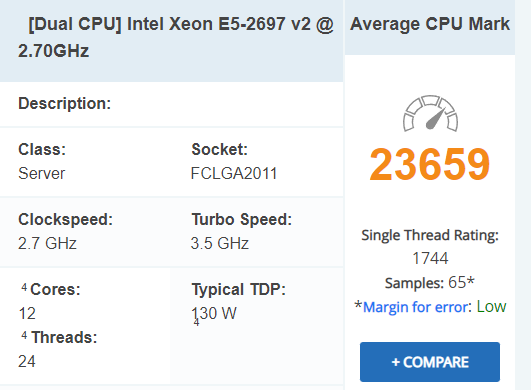
Mine is passmark score of 23659 and single thread rating of 1744
image

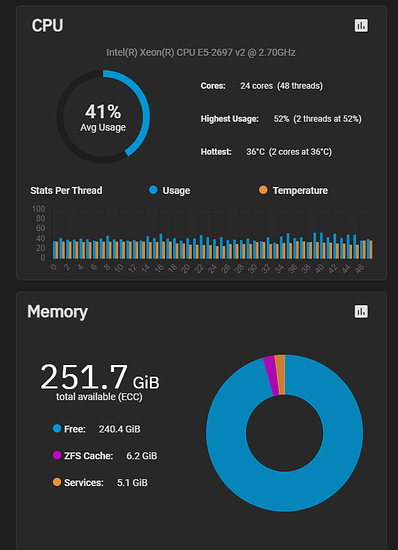
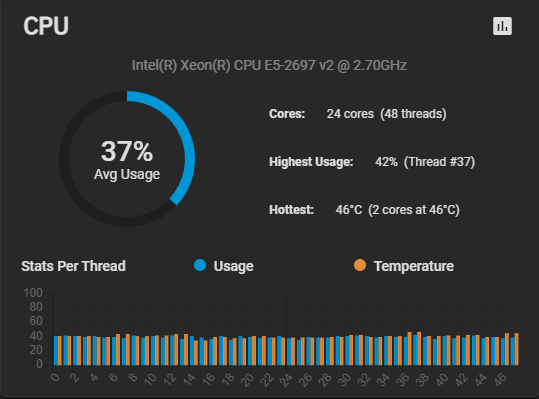
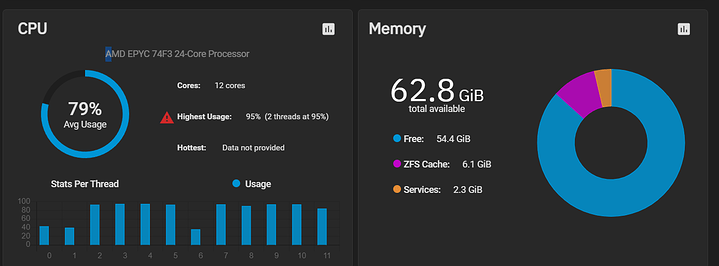
Since the FIO test is only running 12 jobs, I don’t think it’s a CPU bottleneck, running the test confirms I have less than 50% usage

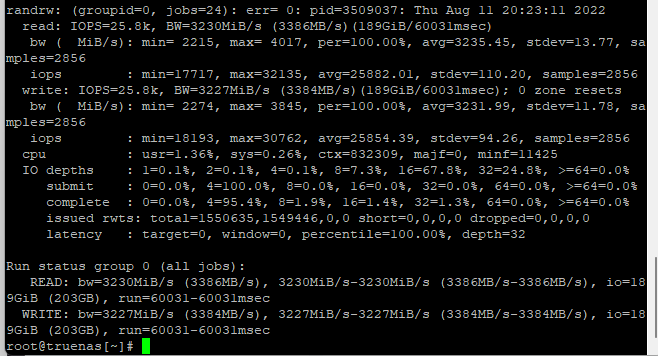
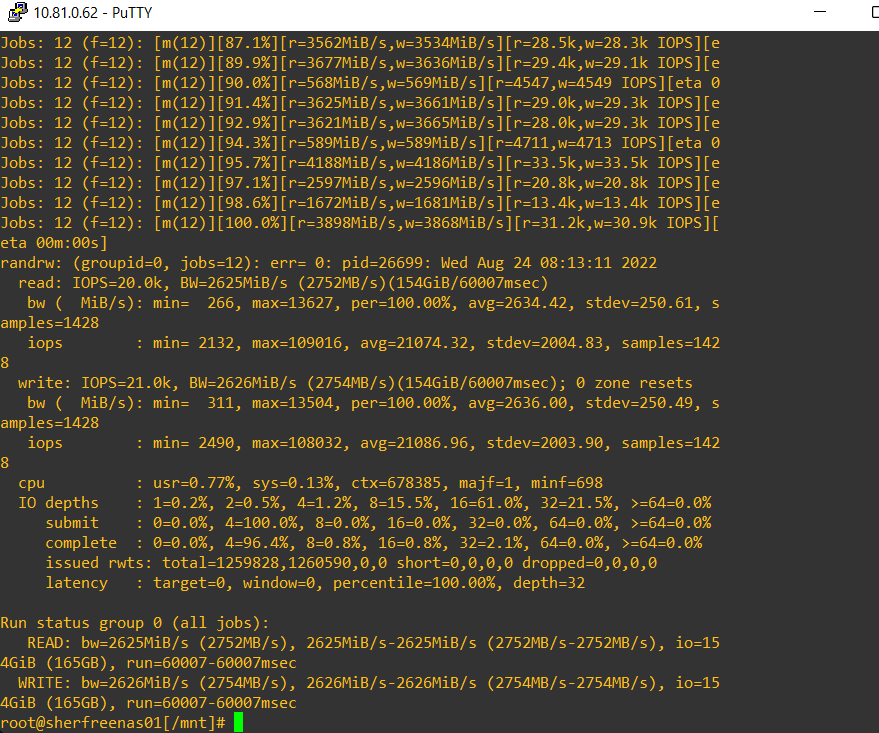
If I change my FIO parameters and do 24 jobs instead of 12, overall CPU utilization actually goes down, at least according to the UI in TrueNAS
image
and my score is actually lower:
image

If it’s not memory and it’s not CPU, perhaps somewhere in the PCI-E bus you are being bottlenecked with a contention issue.
Are you maybe in an X8 Slot?? That’s my only guess, but your MD results seem to indicate otherwise…

Or maybe IX did some tuning on the CPU scheduler or in ZFS to improve I/O??

Well, let’s get into it…

First, let’s set the performance governor. A long time ago I tried and couldn’t find significant performance differences from using the default governor. Also, regular tests on phoronix.com show only small benefits of using the performance governor.
But - it will hopefully lead to more consistency and better comparability…

[test]# echo "performance" | sudo tee /sys/devices/system/cpu/cpu*/cpufreq/scaling_governor

Next, let’s find out if the PLX is the bottleneck.
Let’s check on usage and speed of PCIe lanes:

[test]#lspci -vv 
[...]
               LnkCap: Port #0, Speed 8GT/s, Width x16, ASPM L1, Exit Latency L1 <4us
                       ClockPM- Surprise- LLActRep- BwNot- ASPMOptComp+
[...]

That’s all ok. Btw. all SSDs connect with 8GT/s, Width x4.

Next, I will run fio on a single SSD, then I’ll run it on all in parallel to see if there is a significant slowdown indicating a bottleneck.

Single nvme (in the interest of space just the summary):

Run status group 0 (all jobs):
   READ: bw=1345MiB/s (1410MB/s), 1345MiB/s-1345MiB/s (1410MB/s-1410MB/s), io=78.8GiB (84.7GB), run=60037-60037msec
  WRITE: bw=1345MiB/s (1410MB/s), 1345MiB/s-1345MiB/s (1410MB/s-1410MB/s), io=78.9GiB (84.7GB), run=60037-60037msec

Disk stats (read/write):
  nvme0n1: ios=752890/753400, merge=0/28, ticks=736131/82479, in_queue=818661, util=99.88%

Next mounting each SSD into separate folders and running fio on those in parallel.

nvme0:

Run status group 0 (all jobs):
   READ: bw=1329MiB/s (1393MB/s), 1329MiB/s-1329MiB/s (1393MB/s-1393MB/s), io=77.9GiB (83.7GB), run=60045-60045msec
  WRITE: bw=1329MiB/s (1394MB/s), 1329MiB/s-1329MiB/s (1394MB/s-1394MB/s), io=77.9GiB (83.7GB), run=60045-60045msec

Disk stats (read/write):
  nvme0n1: ios=744652/745186, merge=0/28, ticks=738464/80839, in_queue=819355, util=99.87%

nvme1:

Run status group 0 (all jobs):
   READ: bw=1303MiB/s (1367MB/s), 1303MiB/s-1303MiB/s (1367MB/s-1367MB/s), io=76.4GiB (82.1GB), run=60041-60041msec
  WRITE: bw=1304MiB/s (1367MB/s), 1304MiB/s-1304MiB/s (1367MB/s-1367MB/s), io=76.4GiB (82.1GB), run=60041-60041msec

Disk stats (read/write):
  nvme1n1: ios=730371/730887, merge=0/28, ticks=744813/75752, in_queue=820617, util=99.89%

nvme2:

Run status group 0 (all jobs):
   READ: bw=1318MiB/s (1382MB/s), 1318MiB/s-1318MiB/s (1382MB/s-1382MB/s), io=77.3GiB (82.9GB), run=60040-60040msec
  WRITE: bw=1318MiB/s (1382MB/s), 1318MiB/s-1318MiB/s (1382MB/s-1382MB/s), io=77.3GiB (83.0GB), run=60040-60040msec

Disk stats (read/write):
  nvme2n1: ios=738720/739259, merge=0/28, ticks=740512/80201, in_queue=820763, util=99.87%

nvme3:

Run status group 0 (all jobs):
   READ: bw=1308MiB/s (1372MB/s), 1308MiB/s-1308MiB/s (1372MB/s-1372MB/s), io=76.7GiB (82.4GB), run=60042-60042msec
  WRITE: bw=1309MiB/s (1372MB/s), 1309MiB/s-1309MiB/s (1372MB/s-1372MB/s), io=76.7GiB (82.4GB), run=60042-60042msec

Disk stats (read/write):
  nvme3n1: ios=732698/733257, merge=0/28, ticks=744700/76400, in_queue=821150, util=99.89%

CPU utilization observed:

avg-cpu:  %user   %nice %system %iowait  %steal   %idle
           4.13    0.00   10.02   85.22    0.00    0.63

Looks good to me. I think the test is valid.

In aggregate the total throughput of all 4 SSDs is ~ 5500MB/s. Performance for each SSD is comparable to that of a single SSD.

I conclude that the PLX card is not the bottleneck.

1 Like

Well, I have yet to find satisfying memory benchmarks in Linux.

Here are the passmark scores:

Memory Mark:                       2698
  Database Operations              4769 Thousand Operations/s
  Memory Read Cached               26588 MB/s
  Memory Read Uncached             12111 MB/s
  Memory Write                     10336 MB/s
  Available RAM                    103305 Megabytes
  Memory Latency                   49 Nanoseconds
  Memory Threaded                  44613 MB/s

My machine is somewhat overclocked the cpu scoring higher in passmark than what you looked up:

CPU Mark:                          11459
  Integer Math                     39425 Million Operations/s
  Floating Point Math              19881 Million Operations/s
  Prime Numbers                    50.9 Million Primes/s
  Sorting                          25463 Thousand Strings/s
  Encryption                       3754 MB/s
  Compression                      170204 KB/s
  CPU Single Threaded              2239 Million Operations/s
  Physics                          901 Frames/s
  Extended Instructions (SSE)      8869 Million Matrices/s

Sysbench results:

Random read:  1917.06 MiB/sec
Seq read:     8177.03 MiB/sec
Random write: 1914.93 MiB/sec
Seq write:    6541.37 MiB/sec

Man, those numbers look way worse than passmark. Please let me know if you have a tool more like fio which allows understanding memory performance rather than posting a single result score.

1 Like

I have quite an interesting update.

The passmark scores did not sit well with me once I compared them to tests with identical memory sticks.

Then I remembered fiddling in the bios when I couldn’t get it to post with the set of PCIe cards that I had in there at the time. Sure enough, the memory timing was off and running at the default 2166MT/s.

I updated the memory timings in the BIOS and here are the new numbers:

Drumroll…

from:

to

Memory Mark:                       3025
  Database Operations              5511 Thousand Operations/s
  Memory Read Cached               27849 MB/s
  Memory Read Uncached             13401 MB/s
  Memory Write                     11368 MB/s
  Available RAM                    100069 Megabytes
  Memory Latency                   41 Nanoseconds
  Memory Threaded                  50155 MB/s

This also had a significant impact on the CPU scores:

CPU Mark:                          13378
  Integer Math                     45994 Million Operations/s
  Floating Point Math              23222 Million Operations/s
  Prime Numbers                    58.2 Million Primes/s
  Sorting                          29604 Thousand Strings/s
  Encryption                       4377 MB/s
  Compression                      199381 KB/s
  CPU Single Threaded              2577 Million Operations/s
  Physics                          1040 Frames/s
  Extended Instructions (SSE)      10610 Million Matrices/s

Not leaving any stone unturned, I also changed some ZFS parameters to tune it more towards SSD use:

zpool
Property         Value
ashift           12

zfs
Property         Value
atime            off

Here are the updated fio test results:

fio-3.26
Starting 12 processes
Jobs: 12 (f=12): [m(12)][100.0%][r=4951MiB/s,w=4983MiB/s][r=39.6k,w=39.9k IOPS][eta 00m:00s]
randrw: (groupid=0, jobs=12): err= 0: pid=167065: Sat Aug 13 17:41:06 2022
  read: IOPS=38.4k, BW=4805MiB/s (5038MB/s)(282GiB/60009msec)
   bw (  MiB/s): min= 2850, max= 7262, per=100.00%, avg=4805.69, stdev=71.70, samples=1416
   iops        : min=22804, max=58098, avg=38443.06, stdev=573.64, samples=1416
  write: IOPS=38.5k, BW=4810MiB/s (5044MB/s)(282GiB/60009msec); 0 zone resets
   bw (  MiB/s): min= 2860, max= 7378, per=100.00%, avg=4810.96, stdev=71.84, samples=1416
   iops        : min=22878, max=59026, avg=38484.51, stdev=574.82, samples=1416
  cpu          : usr=4.23%, sys=0.87%, ctx=2134685, majf=0, minf=700
  IO depths    : 1=0.1%, 2=0.1%, 4=0.2%, 8=11.9%, 16=63.7%, 32=24.0%, >=64=0.0%
     submit    : 0=0.0%, 4=100.0%, 8=0.0%, 16=0.0%, 32=0.0%, 64=0.0%, >=64=0.0%
     complete  : 0=0.0%, 4=95.9%, 8=1.0%, 16=1.3%, 32=1.8%, 64=0.0%, >=64=0.0%
     issued rwts: total=2306471,2309171,0,0 short=0,0,0,0 dropped=0,0,0,0
     latency   : target=0, window=0, percentile=100.00%, depth=32

Run status group 0 (all jobs):
   READ: bw=4805MiB/s (5038MB/s), 4805MiB/s-4805MiB/s (5038MB/s-5038MB/s), io=282GiB (302GB), run=60009-60009msec
  WRITE: bw=4810MiB/s (5044MB/s), 4810MiB/s-4810MiB/s (5044MB/s-5044MB/s), io=282GiB (303GB), run=60009-60009msec

So, @NicKF you initial hunch to look into memory performance was spot on! :clap:

Second observation: the numbers mostly match yours. Same zfs 2 mirror config, no Optane, but PCIe Gen3.

I kinda expected to see higher performance assuming your rig was bottlenecked by PCIe Gen2.

Here is some data collected by iostat observed during the run:

avg-cpu:  %user   %nice %system %iowait  %steal   %idle
           5.06    0.00   94.44    0.03    0.00    0.47

Device            r/s     rMB/s   rrqm/s  %rrqm r_await rareq-sz     w/s     wMB/s   wrqm/s  %wrqm w_await wareq-sz     d/s     dMB/s   drqm/s  %drqm d_await dareq-sz     f/s f_await  aqu-sz  %util
nvme0n1          4.00      0.00     0.00   0.00    1.85     0.00 16115.40   1995.53     0.00   0.00    0.11   126.80    0.00      0.00     0.00   0.00    0.00     0.00    4.00    1.85    1.86  89.56
nvme1n1          4.00      0.00     0.00   0.00    1.80     0.00 15392.20   1904.96     0.00   0.00    0.11   126.73    0.00      0.00     0.00   0.00    0.00     0.00    4.00    1.85    1.77  87.76
nvme2n1          4.00      0.00     0.00   0.00    1.80     0.00 16107.40   1995.30     0.00   0.00    0.12   126.85    0.00      0.00     0.00   0.00    0.00     0.00    4.00    1.75    1.92  89.58
nvme3n1          4.00      0.00     0.00   0.00    1.80     0.00 15324.60   1898.08     0.00   0.00    0.15   126.83    0.00      0.00     0.00   0.00    0.00     0.00    4.00    1.80    2.30  91.96

Here I see that my rig is clearly bottlenecked by CPU, specifically system processes trying to process all these 128k blocks.
Second observation is that I can only see write operations, although the test clearly is a “randrw” test and the results clearly show read and write results.
All data seems to be read from ZFS ARC, therefore there are no read operations on the disk. In addition there seem to be some write caching because the write bandwidth of two of the four SSDs total around 4GB/s, not the 5GB/s that fio reports as a result.
Last indicator that we’re mostly looking at memory performance is that read and write performance is almost identical, which is not to be expected with these NAND SSDs (write should be somewhat slower).

The only conclusion I have is that we’ve only barely tested the SSDs, but rather the memory performance of our rigs.

1 Like

Hmmm.

I think this may be inline with some of the information @wendell has shared in some of his testing over the years.
(151) Record Breaker: Toward 20 million i/ops on the desktop with Threadripper Pro - YouTube

Toward 20 Million I/Ops - Part 1: Threadripper Pro - Work in Progress DRAFT - Wikis & How-to Guides - Level1Techs Forums

When he is pushing PCIe Gen4 on ThreadRipper, I think it’s pretty obvious that both in terms of memory and CPU, that is really what’s holding us back.

I’m going to order this:
Linkreal PCIe 3.0 X16 to Quad M.2 NVMe SSD Swtich Adapter Card for Servers LRNV9547L 4I|Add On Cards| - AliExpress

To see if I can squeeze some more performance out.

And this!
M.2 Key Ssd Exp Card Anm24pe16 Quad Port Pcie3.0 X16 With Plx8724 Controller - Add On Cards & Controller Panels - AliExpress

These are the two differant PLX chips

PEX 8747 (broadcom.com)

PEX 8748 (broadcom.com)

I don’t know if an improvement in PCI-E alone will assist, but it’s not going to hurt (beyond my wallet) to try… I will update this once I receive them in a few weeks, obviosly have to wait for shipping from China

Reviewed content and with the knowledge gained from our testing could understand it better than the first time.

I could not find the actual fio command Wendell ran during these tests. But later in the thread Chuntzu documented his test cases well.

They were going for max io (instead of max bandwidth in our test). So, the main difference I saw was that they used the smallest block size (4k) and more importantly Chuntzu used a different ioengine.

Let’s try the ioengine. I start by formatting a partition on each 970 pro into ext4 and mounting them.

First, test with our current command and setup:

[test]# fio --bs=128k --direct=1 --gtod_reduce=1 --ioengine=posixaio --iodepth=32 --group_reporting --name=randrw --numjobs=12 --ramp_time=10 --runtime=60 --rw=randrw --size=256M --time_based --directory=/mnt/nvme0:/mnt/nvme1:/mnt/nvme2:/mnt/nvme3
randrw: (g=0): rw=randrw, bs=(R) 128KiB-128KiB, (W) 128KiB-128KiB, (T) 128KiB-128KiB, ioengine=posixaio, iodepth=32
...
fio-3.26
Starting 12 processes
Jobs: 12 (f=12): [m(12)][100.0%][r=3329MiB/s,w=3342MiB/s][r=26.6k,w=26.7k IOPS][eta 00m:00s]
randrw: (groupid=0, jobs=12): err= 0: pid=19615: Sat Aug 13 22:37:10 2022
  read: IOPS=26.9k, BW=3364MiB/s (3527MB/s)(197GiB/60022msec)
   bw (  MiB/s): min= 3077, max= 3762, per=100.00%, avg=3366.47, stdev=12.98, samples=1430
   iops        : min=24617, max=30102, avg=26931.42, stdev=103.81, samples=1430
  write: IOPS=27.0k, BW=3370MiB/s (3533MB/s)(198GiB/60022msec); 0 zone resets
   bw (  MiB/s): min= 2987, max= 3863, per=100.00%, avg=3372.22, stdev=15.08, samples=1430
   iops        : min=23902, max=30911, avg=26977.45, stdev=120.64, samples=1430
  cpu          : usr=1.42%, sys=0.36%, ctx=804426, majf=0, minf=701
  IO depths    : 1=0.0%, 2=0.0%, 4=0.1%, 8=25.0%, 16=50.0%, 32=25.0%, >=64=0.0%
     submit    : 0=0.0%, 4=100.0%, 8=0.0%, 16=0.0%, 32=0.0%, 64=0.0%, >=64=0.0%
     complete  : 0=0.0%, 4=97.5%, 8=0.0%, 16=0.0%, 32=2.5%, 64=0.0%, >=64=0.0%
     issued rwts: total=1615001,1617829,0,0 short=0,0,0,0 dropped=0,0,0,0
     latency   : target=0, window=0, percentile=100.00%, depth=32

Run status group 0 (all jobs):
   READ: bw=3364MiB/s (3527MB/s), 3364MiB/s-3364MiB/s (3527MB/s-3527MB/s), io=197GiB (212GB), run=60022-60022msec
  WRITE: bw=3370MiB/s (3533MB/s), 3370MiB/s-3370MiB/s (3533MB/s-3533MB/s), io=198GiB (212GB), run=60022-60022msec

Using Wendell’s command to monitor performance:

---procs--- ----total-usage---- ------memory-usage----- --io/total- ----system----
run blk new|usr sys idl wai stl| used  free  buf   cach| read  writ|     time     
  0  11 3.0|  3   4  20  71   0|  22G  101G  187M 1726M|26.9k 27.0k|13-08 22:36:54
2.0  10   0|  3   4  21  71   0|  22G  101G  187M 1726M|26.4k 26.4k|13-08 22:36:55
1.0  10   0|  3   4  19  72   0|  22G  101G  187M 1726M|25.9k 25.8k|13-08 22:36:56
3.0  10   0|  4   4  20  72   0|  22G  101G  187M 1726M|26.1k 26.4k|13-08 22:36:57
1.0  11   0|  3   4  19  72   0|  22G  101G  187M 1726M|26.2k 26.4k|13-08 22:36:58
1.0  11   0|  3   4  20  71   0|  22G  101G  187M 1726M|26.4k 26.5k|13-08 22:36:59
  0  12   0|  3   4  18  73   0|  22G  101G  188M 1726M|26.0k 26.4k|13-08 22:37:00
  0  12   0|  3   4  20  72   0|  22G  101G  188M 1726M|26.2k 26.1k|13-08 22:37:01
3.0  10   0|  3   4  19  73   0|  22G  101G  188M 1726M|26.7k 26.5k|13-08 22:37:02
1.0  11   0|  3   4  17  74   0|  22G  101G  188M 1726M|26.7k 26.6k|13-08 22:37:03
  0  13   0|  3   4  20  72   0|  22G  101G  188M 1726M|26.8k 26.8k|13-08 22:37:04
  0  12   0|  3   4  19  72   0|  22G  101G  188M 1726M|26.4k 26.9k|13-08 22:37:05
  0  12   0|  3   4  19  72   0|  22G  101G  188M 1726M|26.5k 26.4k|13-08 22:37:06
  0  12   0|  3   4  20  71   0|  22G  101G  188M 1726M|26.4k 26.5k|13-08 22:37:07
2.0  11   0|  3   4  20  72   0|  22G  101G  188M 1726M|26.4k 26.6k|13-08 22:37:08
1.0  12   0|  3   4  20  71   0|  22G  101G  188M 1726M|26.8k 26.8k|13-08 22:37:09

Observation: pretty consistent 26k io, 71% wait time, 20% idle.

Let’s switch ioengine from “posixaio” to “aio”

[test]# fio --bs=128k --direct=1 --gtod_reduce=1 --ioengine=aio --iodepth=32 --group_reporting --name=randrw --numjobs=12 --ramp_time=10 --runtime=60 --rw=randrw --size=256M --time_based --directory=/mnt/nvme0:/mnt/nvme1:/mnt/nvme2:/mnt/nvme3
randrw: (g=0): rw=randrw, bs=(R) 128KiB-128KiB, (W) 128KiB-128KiB, (T) 128KiB-128KiB, ioengine=libaio, iodepth=32
...
fio-3.26
Starting 12 processes
Jobs: 12 (f=12): [m(12)][100.0%][r=5244MiB/s,w=5320MiB/s][r=41.9k,w=42.6k IOPS][eta 00m:00s]
randrw: (groupid=0, jobs=12): err= 0: pid=19694: Sat Aug 13 22:42:23 2022
  read: IOPS=42.6k, BW=5331MiB/s (5590MB/s)(312GiB/60015msec)
   bw (  MiB/s): min= 4932, max= 5745, per=100.00%, avg=5339.46, stdev=15.05, samples=1428
   iops        : min=39457, max=45960, avg=42714.58, stdev=120.43, samples=1428
  write: IOPS=42.7k, BW=5338MiB/s (5598MB/s)(313GiB/60015msec); 0 zone resets
   bw (  MiB/s): min= 4895, max= 5739, per=100.00%, avg=5346.25, stdev=15.19, samples=1428
   iops        : min=39159, max=45915, avg=42768.93, stdev=121.54, samples=1428
  cpu          : usr=5.30%, sys=16.02%, ctx=4366045, majf=0, minf=700
  IO depths    : 1=0.0%, 2=0.0%, 4=0.0%, 8=0.0%, 16=0.0%, 32=100.0%, >=64=0.0%
     submit    : 0=0.0%, 4=100.0%, 8=0.0%, 16=0.0%, 32=0.0%, 64=0.0%, >=64=0.0%
     complete  : 0=0.0%, 4=100.0%, 8=0.0%, 16=0.0%, 32=0.1%, 64=0.0%, >=64=0.0%
     issued rwts: total=2559394,2562837,0,0 short=0,0,0,0 dropped=0,0,0,0
     latency   : target=0, window=0, percentile=100.00%, depth=32

Run status group 0 (all jobs):
   READ: bw=5331MiB/s (5590MB/s), 5331MiB/s-5331MiB/s (5590MB/s-5590MB/s), io=312GiB (335GB), run=60015-60015msec
  WRITE: bw=5338MiB/s (5598MB/s), 5338MiB/s-5338MiB/s (5598MB/s-5598MB/s), io=313GiB (336GB), run=60015-60015msec

Wow! That’s much more performance! And the utilization?

---procs--- ----total-usage---- ------memory-usage----- --io/total- ----system----
run blk new|usr sys idl wai stl| used  free  buf   cach| read  writ|     time     
7.0   0   0| 11  17  66   0   0|  22G  101G  193M 1726M|42.6k 42.5k|13-08 22:42:14
4.0   0   0| 12  17  66   0   0|  22G  101G  193M 1726M|42.9k 43.1k|13-08 22:42:15
1.0   0   0| 11  17  66   0   0|  22G  101G  193M 1726M|43.5k 43.3k|13-08 22:42:16
3.0   0   0| 12  17  66   0   0|  22G  101G  193M 1726M|42.9k 43.3k|13-08 22:42:17
3.0   0 5.0| 12  17  66   0   0|  22G  101G  193M 1726M|43.6k 43.2k|13-08 22:42:18
2.0   0   0| 11  16  66   0   0|  22G  101G  193M 1726M|42.7k 42.9k|13-08 22:42:19
4.0   0   0| 11  16  67   0   0|  22G  101G  193M 1726M|42.4k 42.4k|13-08 22:42:20
3.0   0   0| 11  16  67   0   0|  22G  101G  193M 1726M|41.8k 42.0k|13-08 22:42:21
5.0   0   0| 11  17  67   0   0|  22G  101G  193M 1726M|42.3k 42.3k|13-08 22:42:22
4.0   0   0| 11  16  67   0   0|  22G  101G  193M 1726M|41.9k 41.9k|13-08 22:42:23
  0   0   0|  5   9  83   0   0|  22G  101G  193M 1721M|21.4k 21.7k|13-08 22:42:24

No wait time, about 30% CPU utilization (hmm - a few percent are missing…). IOs are up to ~42k reads and writes.
Nice! :muscle:

Man! The ioengine used in our tests was a serious bottleneck.

Just for giggles: what’s the max io we can get from this setup?
Changing to block size 4k

]# fio --bs=4k --direct=1 --gtod_reduce=1 --ioengine=aio --iodepth=32 --group_reporting --name=randrw --numjobs=12 --ramp_time=10 --runtime=60 --rw=randrw --size=256M --time_based --directory=/mnt/nvme0:/mnt/nvme1:/mnt/nvme2:/mnt/nvme3
randrw: (g=0): rw=randrw, bs=(R) 4096B-4096B, (W) 4096B-4096B, (T) 4096B-4096B, ioengine=libaio, iodepth=32
...
fio-3.26
Starting 12 processes
Jobs: 12 (f=6): [m(2),f(1),m(1),f(2),m(1),f(2),m(1),f(2)][100.0%][r=2915MiB/s,w=2920MiB/s][r=746k,w=748k IOPS][eta 00m:00s]
randrw: (groupid=0, jobs=12): err= 0: pid=20126: Sat Aug 13 23:07:54 2022
  read: IOPS=748k, BW=2920MiB/s (3062MB/s)(171GiB/60001msec)
   bw (  MiB/s): min= 2728, max= 3031, per=100.00%, avg=2922.61, stdev= 3.89, samples=1434
   iops        : min=698602, max=775935, avg=748185.33, stdev=996.78, samples=1434
  write: IOPS=748k, BW=2921MiB/s (3063MB/s)(171GiB/60001msec); 0 zone resets
   bw (  MiB/s): min= 2732, max= 3039, per=100.00%, avg=2923.01, stdev= 3.86, samples=1434
   iops        : min=699577, max=778066, avg=748289.12, stdev=987.63, samples=1434
  cpu          : usr=19.39%, sys=51.05%, ctx=38317315, majf=0, minf=700
  IO depths    : 1=0.0%, 2=0.0%, 4=0.0%, 8=0.0%, 16=0.0%, 32=100.0%, >=64=0.0%
     submit    : 0=0.0%, 4=100.0%, 8=0.0%, 16=0.0%, 32=0.0%, 64=0.0%, >=64=0.0%
     complete  : 0=0.0%, 4=100.0%, 8=0.0%, 16=0.0%, 32=0.1%, 64=0.0%, >=64=0.0%
     issued rwts: total=44857655,44863973,0,0 short=0,0,0,0 dropped=0,0,0,0
     latency   : target=0, window=0, percentile=100.00%, depth=32

Run status group 0 (all jobs):
   READ: bw=2920MiB/s (3062MB/s), 2920MiB/s-2920MiB/s (3062MB/s-3062MB/s), io=171GiB (184GB), run=60001-60001msec
  WRITE: bw=2921MiB/s (3063MB/s), 2921MiB/s-2921MiB/s (3063MB/s-3063MB/s), io=171GiB (184GB), run=60001-60001msec

That’s 1.5M iops: 750k read and 750k write. Total bandwidth: about 3GB/s read and write.

A quick look at the resources:

---procs--- ----total-usage---- ------memory-usage----- --io/total- ----system----
run blk new|usr sys idl wai stl| used  free  buf   cach| read  writ|     time     
 14   0   0| 39  60   1   0   0|  22G  101G  216M 1726M| 750k  750k|13-08 23:06:58
 14   0   0| 38  61   1   0   0|  22G  101G  216M 1726M| 749k  750k|13-08 23:06:59
 15   0 3.0| 38  60   2   0   0|  22G  101G  216M 1726M| 747k  746k|13-08 23:07:00
 16   0   0| 38  61   1   0   0|  22G  101G  216M 1726M| 752k  752k|13-08 23:07:01
 13   0   0| 38  60   2   0   0|  22G  101G  216M 1726M| 747k  748k|13-08 23:07:02
 16   0   0| 38  60   1   0   0|  22G  101G  216M 1726M| 749k  751k|13-08 23:07:03
 14 1.0   0| 38  60   2   0   0|  22G  101G  217M 1726M| 747k  747k|13-08 23:07:04
 15   0   0| 38  60   2   0   0|  22G  101G  217M 1726M| 750k  748k|13-08 23:07:05
 13   0   0| 38  61   1   0   0|  22G  101G  217M 1726M| 751k  752k|13-08 23:07:06

Now all the CPU resources are used, only -2% idle, no wait time.

Can we wring even more performance out of the SSDs? Can we use that brand new efficient io_uring kernel structure? Sure!

[test]# fio --bs=4k --direct=1 --gtod_reduce=1 --ioengine=io_uring --iodepth=32 --group_reporting --name=randrw --numjobs=12 --ramp_time=10 --runtime=60 --rw=randrw --size=256M --time_based --directory=/mnt/nvme0:/mnt/nvme1:/mnt/nvme2:/mnt/nvme3
randrw: (g=0): rw=randrw, bs=(R) 4096B-4096B, (W) 4096B-4096B, (T) 4096B-4096B, ioengine=io_uring, iodepth=32
...
fio-3.26
Starting 12 processes
Jobs: 12 (f=12): [m(12)][100.0%][r=3180MiB/s,w=3177MiB/s][r=814k,w=813k IOPS][eta 00m:00s]
randrw: (groupid=0, jobs=12): err= 0: pid=20034: Sat Aug 13 23:03:01 2022
  read: IOPS=820k, BW=3202MiB/s (3358MB/s)(188GiB/60001msec)
   bw (  MiB/s): min= 2988, max= 3328, per=100.00%, avg=3204.54, stdev= 5.03, samples=1440
   iops        : min=764945, max=852100, avg=820359.95, stdev=1288.78, samples=1440
  write: IOPS=820k, BW=3203MiB/s (3358MB/s)(188GiB/60001msec); 0 zone resets
   bw (  MiB/s): min= 2985, max= 3323, per=100.00%, avg=3205.01, stdev= 5.01, samples=1440
   iops        : min=764213, max=850812, avg=820481.23, stdev=1283.09, samples=1440
  cpu          : usr=14.24%, sys=53.69%, ctx=40252736, majf=0, minf=699
  IO depths    : 1=0.0%, 2=0.0%, 4=0.0%, 8=0.0%, 16=0.0%, 32=100.0%, >=64=0.0%
     submit    : 0=0.0%, 4=100.0%, 8=0.0%, 16=0.0%, 32=0.0%, 64=0.0%, >=64=0.0%
     complete  : 0=0.0%, 4=100.0%, 8=0.0%, 16=0.0%, 32=0.1%, 64=0.0%, >=64=0.0%
     issued rwts: total=49185925,49193186,0,0 short=0,0,0,0 dropped=0,0,0,0
     latency   : target=0, window=0, percentile=100.00%, depth=32

Run status group 0 (all jobs):
   READ: bw=3202MiB/s (3358MB/s), 3202MiB/s-3202MiB/s (3358MB/s-3358MB/s), io=188GiB (201GB), run=60001-60001msec
  WRITE: bw=3203MiB/s (3358MB/s), 3203MiB/s-3203MiB/s (3358MB/s-3358MB/s), io=188GiB (201GB), run=60001-60001msec

That’s >1.6M iops: 820k read and 820k write. Over 3.3GB/s read and write.

---procs--- ----total-usage---- ------memory-usage----- --io/total- ----system----
run blk new|usr sys idl wai stl| used  free  buf   cach| read  writ|     time     
 14   0   0| 33  64   3   0   0|  22G  101G  210M 1726M| 824k  824k|13-08 23:01:58
 18   0 3.0| 34  63   3   0   0|  22G  101G  210M 1726M| 823k  824k|13-08 23:01:59
 15   0   0| 32  63   4   0   0|  22G  101G  210M 1726M| 817k  818k|13-08 23:02:00
 15   0   0| 33  64   3   0   0|  22G  101G  210M 1726M| 821k  821k|13-08 23:02:01
 14   0   0| 34  63   3   0   0|  22G  101G  210M 1726M| 817k  813k|13-08 23:02:02
 14   0   0| 33  63   3   0   0|  22G  101G  210M 1726M| 824k  823k|13-08 23:02:03
 14   0   0| 34  62   3   0   0|  22G  101G  210M 1726M| 816k  817k|13-08 23:02:04
 14   0   0| 34  63   3   0   0|  22G  101G  210M 1726M| 826k  824k|13-08 23:02:05
 12   0   0| 33  63   3   0   0|  22G  101G  211M 1726M| 819k  818k|13-08 23:02:06
 15   0   0| 34  63   2   0   0|  22G  101G  211M 1726M| 823k  823k|13-08 23:02:07
 15   0   0| 33  63   3   0   0|  22G  101G  211M 1726M| 822k  825k|13-08 23:02:08
 15   0   0| 33  63   3   0   0|  22G  101G  211M 1726M| 818k  818k|13-08 23:02:09

Still all CPU resources consumed.

What happens when we change our test to read-only - same as Wendell did?

]# fio --bs=4k --direct=1 --gtod_reduce=1 --ioengine=io_uring --iodepth=32 --group_reporting --name=randrw --numjobs=12 --ramp_time=10 --runtime=60 --rw=randread --size=256M --time_based --directory=/mnt/nvme0:/mnt/nvme1:/mnt/nvme2:/mnt/nvme3
randrw: (g=0): rw=randread, bs=(R) 4096B-4096B, (W) 4096B-4096B, (T) 4096B-4096B, ioengine=io_uring, iodepth=32
...
fio-3.26
Starting 12 processes
Jobs: 12 (f=11): [r(11),f(1)][100.0%][r=8118MiB/s][r=2078k IOPS][eta 00m:00s]
randrw: (groupid=0, jobs=12): err= 0: pid=20215: Sat Aug 13 23:15:04 2022
  read: IOPS=2076k, BW=8108MiB/s (8502MB/s)(475GiB/60001msec)
   bw (  MiB/s): min= 8031, max= 8164, per=100.00%, avg=8115.97, stdev= 1.79, samples=1439
   iops        : min=2056007, max=2090046, avg=2077685.78, stdev=459.40, samples=1439
  cpu          : usr=16.58%, sys=53.25%, ctx=11217210, majf=0, minf=701
  IO depths    : 1=0.0%, 2=0.0%, 4=0.0%, 8=0.0%, 16=0.0%, 32=100.0%, >=64=0.0%
     submit    : 0=0.0%, 4=100.0%, 8=0.0%, 16=0.0%, 32=0.0%, 64=0.0%, >=64=0.0%
     complete  : 0=0.0%, 4=100.0%, 8=0.0%, 16=0.0%, 32=0.1%, 64=0.0%, >=64=0.0%
     issued rwts: total=124546903,0,0,0 short=0,0,0,0 dropped=0,0,0,0
     latency   : target=0, window=0, percentile=100.00%, depth=32

Run status group 0 (all jobs):
   READ: bw=8108MiB/s (8502MB/s), 8108MiB/s-8108MiB/s (8502MB/s-8502MB/s), io=475GiB (510GB), run=60001-60001msec

Wow! over 2M read iops, over 8GB/s bandwidth. Now, your PCIe Gen2 slot would be bottlenecked.

---procs--- ----total-usage---- ------memory-usage----- --io/total- ----system----
run blk new|usr sys idl wai stl| used  free  buf   cach| read  writ|     time     
 10   0   0| 37  51   5   0   0|  22G  101G  224M 1726M|2076k    0 |13-08 23:14:28
 12   0   0| 36  52   5   0   0|  22G  101G  224M 1726M|2076k    0 |13-08 23:14:29
 12   0   0| 36  52   5   0   0|  22G  101G  224M 1726M|2077k    0 |13-08 23:14:30
 10   0   0| 36  52   5   0   0|  22G  101G  224M 1726M|2078k    0 |13-08 23:14:31
 11   0   0| 36  52   5   0   0|  22G  101G  224M 1726M|2076k    0 |13-08 23:14:32
9.0   0   0| 36  52   5   0   0|  22G  101G  224M 1726M|2078k    0 |13-08 23:14:33
 12   0   0| 36  52   5   0   0|  22G  101G  224M 1726M|2079k    0 |13-08 23:14:34
 11   0   0| 36  52   5   0   0|  22G  101G  224M 1726M|2076k 1.00 |13-08 23:14:35

Interesting: still almost full CPU utilization, but with a higher ratio in user space.

There you have it: inefficiencies in ioengine (posixaio) and file system (zfs) limit performance.

1 Like

There is a known bottleneck within the ARC that prevents NVMe drives to utilize all their bandwidth. There is a feature update planned to bypass the ARC on NVMe pools. But don’t expect that feature anytime soon…seems like the team ran into some troubles.

1 Like

Hi All,

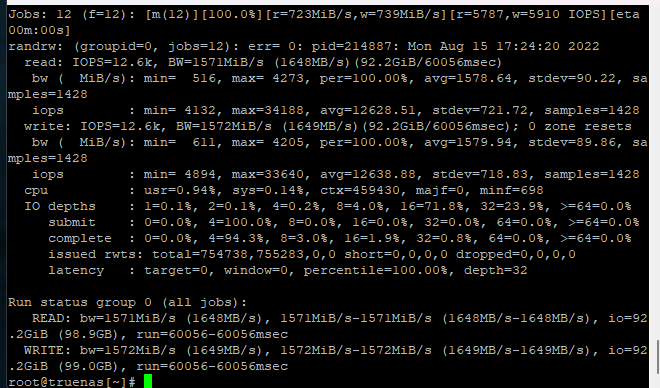
For shits and giggles, I tested 2 512GB Samsung 9A1 (980 Pro OEM) in an Alderlake box with an i5-12600T and 2x8GB of DDR5 4800 in a ZFS Mirror.
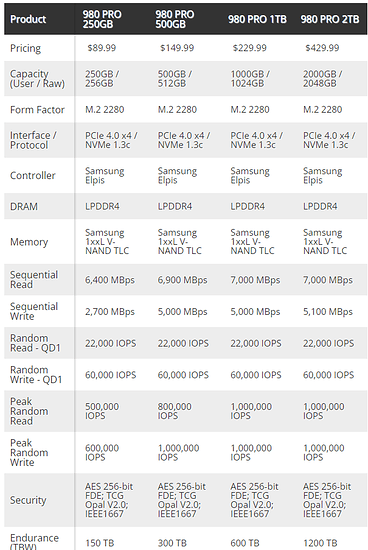
These are Gen4 SSDs and are generally very fast. It’s probable that the 9A1 isn’t quite as fast as the 980 pro, but here’s a snippet from TomsHardware

This is on TrueNAS Scale Bluefin nightly (because Kernel 5.15 vs 5.10 on current)

randrw: (groupid=0, jobs=12): err= 0: pid=18063: Mon Aug 15 17:19:06 2022
read: IOPS=16.4k, BW=2047MiB/s (2147MB/s)(120GiB/60043msec)
bw ( MiB/s): min= 509, max= 5340, per=100.00%, avg=2056.25, stdev=120.31, samples=1428
iops : min= 4078, max=42723, avg=16449.22, stdev=962.42, samples=1428
write: IOPS=16.4k, BW=2049MiB/s (2149MB/s)(120GiB/60043msec); 0 zone resets
bw ( MiB/s): min= 603, max= 5435, per=100.00%, avg=2058.03, stdev=120.31, samples=1428
iops : min= 4828, max=43487, avg=16463.45, stdev=962.40, samples=1428
cpu : usr=1.13%, sys=0.16%, ctx=608171, majf=1, minf=706
IO depths : 1=0.1%, 2=0.1%, 4=0.2%, 8=17.5%, 16=57.8%, 32=24.3%, >=64=0.0%
submit : 0=0.0%, 4=100.0%, 8=0.0%, 16=0.0%, 32=0.0%, 64=0.0%, >=64=0.0%
complete : 0=0.0%, 4=96.9%, 8=0.4%, 16=0.5%, 32=2.2%, 64=0.0%, >=64=0.0%
issued rwts: total=983260,984131,0,0 short=0,0,0,0 dropped=0,0,0,0
latency : target=0, window=0, percentile=100.00%, depth=32

Run status group 0 (all jobs):
READ: bw=2047MiB/s (2147MB/s), 2047MiB/s-2047MiB/s (2147MB/s-2147MB/s), io=120GiB (129GB), run=60043-60043msec
WRITE: bw=2049MiB/s (2149MB/s), 2049MiB/s-2049MiB/s (2149MB/s-2149MB/s), io=120GiB (129GB), run=60043-60043msec
root@truenas[~]#

Actually quite slow, surprisingly. I had expected to at least match, if not exceed my previous testing. Hmmmm. ZFS is fun :stuck_out_tongue:

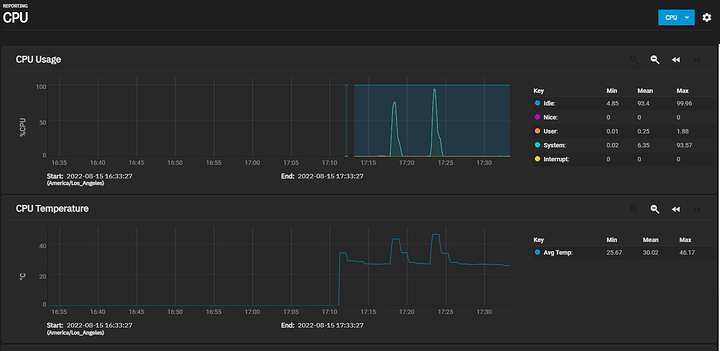
CPU utilization is very high:

Additional testing yields worse results:
image

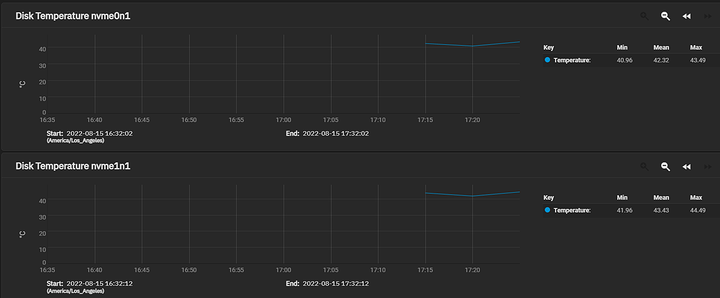
Disk temps are fine:

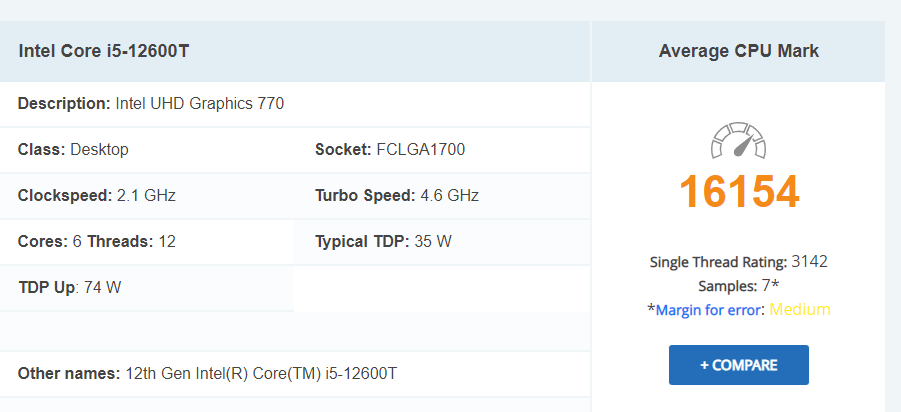
Performance of processor is relatively high, higher than yours in both single and multithreaded performance.

RAM is 2400x2x64, and two memory channels is 614.4 Gbps, less than our servers but nothing to sneeze at. Maybe that DDR5 latency is biting me in the butt at those speeds.

1 Like

Did another test today. The Alderlake performance had me questioning my sanity.
I put 2x Intel DC P4610s in U.2 carriers (mirrored) and installed them in a Dell R720XD with 2x E5-2667 V2s and 192GB of DDR3 1333.

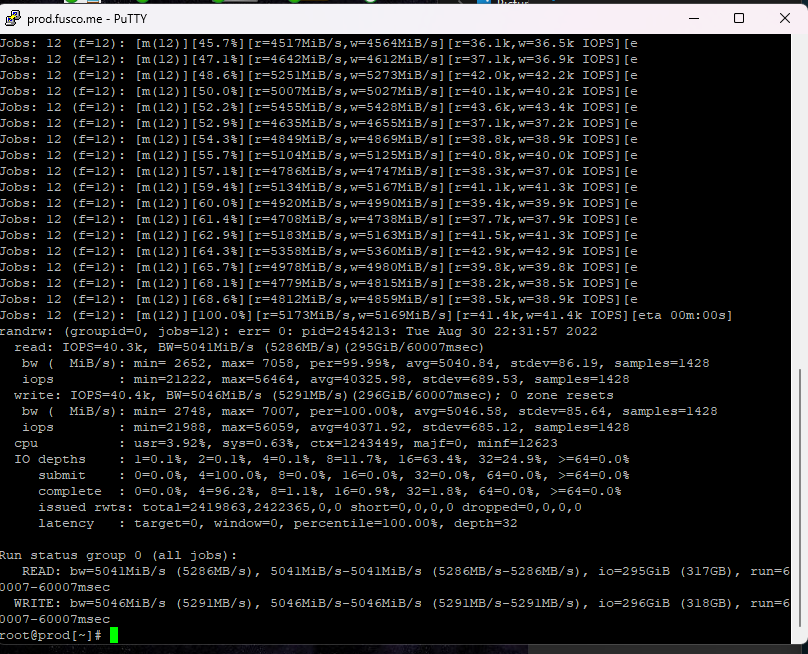
image

And I have more IOPS in this particular test and more R/W bandwidth. I’m not sure why…lol

At Work today I had a little bit of time to do some testing on some higher end hardware. We just got a Dell R7525 with two Epyc 74F3s and 512GB of ram, and two Kioxia CM6 MU Gen4 U.2 NVME drives.

I installed SCALE under ESXI, gave it 64GB of RAM, 12 cores, and passed through the NVME drives to TrueNAS.

This benchmark is really tough on CPUs:

2 Likes

I received the first of my Chinese PCIE switch chip cards, the 4-port PEX 8747-based HHHL card.
For laughs, I added it to the same pool I have been testing that has the other card in it already, and I added 4 additional 970 pros.

Enter the new problem, I’ve come across a strange occurrence, where the system is freaking out saying that the PCI-E port that is the switch chip is throwing errors.

spewing errors in the console:

Output from lspci:

Some indications may indicate that the problem is not as it seems, and may just a power saving feature?

https://askubuntu.com/questions/863150/pcie-bus-error-severity-corrected-type-physical-layer-id-00e5receiver-id

I know SCALE is using a custom bootloader built in-house for ZFS. Any idea if it’s possible to test this out?

1661831471595.png

Needless to say, performance is not so nice:

Yep - that’s likely it. I have the same with my Highpoint PEX card. Also, the additional power draw is miniscule.

Sorry about the multitude of posts.

I would recommend first doing a series of tests to validate the general throughput without using ZFS. ZFS does all kinds of things that may mask the true hardware performance capacity. E.g. you may find that your Optane log device is holding the array of nvme devices back.

Following my last post I had another series of tests that I didn’t post here in detail because I felt it would move the discussion too far away from the initial topic.

I tested max IOPs for the most nvme drives I could connect to my x570 based system. Connecting 2x Samsung 980 Pro, 2x WD 850, 2x Optane 905 , mounting each individually, I was able to achieve >5M 4k IOPS (same fio test setup as in the last posted test above). I noticed bottlenecks in a few configurations.

My recommendation: try the same with all your nvme drives so you know what your hw is capable of. Then try different zfs setups and configurations that will give you the benefits of zfs with the least performance impacts.

Disabling via middleware on TN SCALE works.

I guess our missions are different here. There are plenty of benchmarks of folks driving SSDs really fast in a straight line in Windows or on Linux with MD. I’m more interested in seeing how far I can push performance in ZFS on used enterprise ‘garbage tier’ hardware.

The fact I can crank out more IOPs in this test than on a brand new production ready server (albeit with more drives, and I’m cheating with PEX chips) is pretty neat.

After applying the fix for the power management thing, I am now getting over 40k IOPs, still with one card being based on the PEX 8632 PCI-E gen 2.0 switch chip. I’m interested to see if it’ll scale a little higher if I replaced that card.

This is still way faster than I could push with SATA drives in the same test.

Hmmm

Still doing some testing. Got my Caecent adapter, which is the PLX8724-based card. I guess the over-driving of Lanes on the card performs worse on average than an older PCIE generation 8632 switch chip.

Performance is actually less than the PCIE GEN 2.0-based card.

I don’t recommend this product for that reason:

Over the past year or so I have been obsessively exploring various aspects of ZFS performance, from large SATA arrays with multiple HBA cards, to testing NVME performance. In my previous testing I was leveraging castoff enterprise servers that were Westmere, Sandy Bridge and Ivy Bridge based platforms. There was some interesting performance variations between those platforms and I was determined to see what a more modern platform would do. It seemed that most of my testing indicated that ZFS was being bottlenecked by the platform it was running on, with high CPU usage being present during testing.

I recently picked up an AMD EPYC 7282, Supermicro H12SSL-I, and 256GB of DDR4-2133 RAM. While the RAM is certainly not the fastest, I now have a lot of PCIE lanes to play with and I don’t have to worry as much about which slot goes to which CPUs.

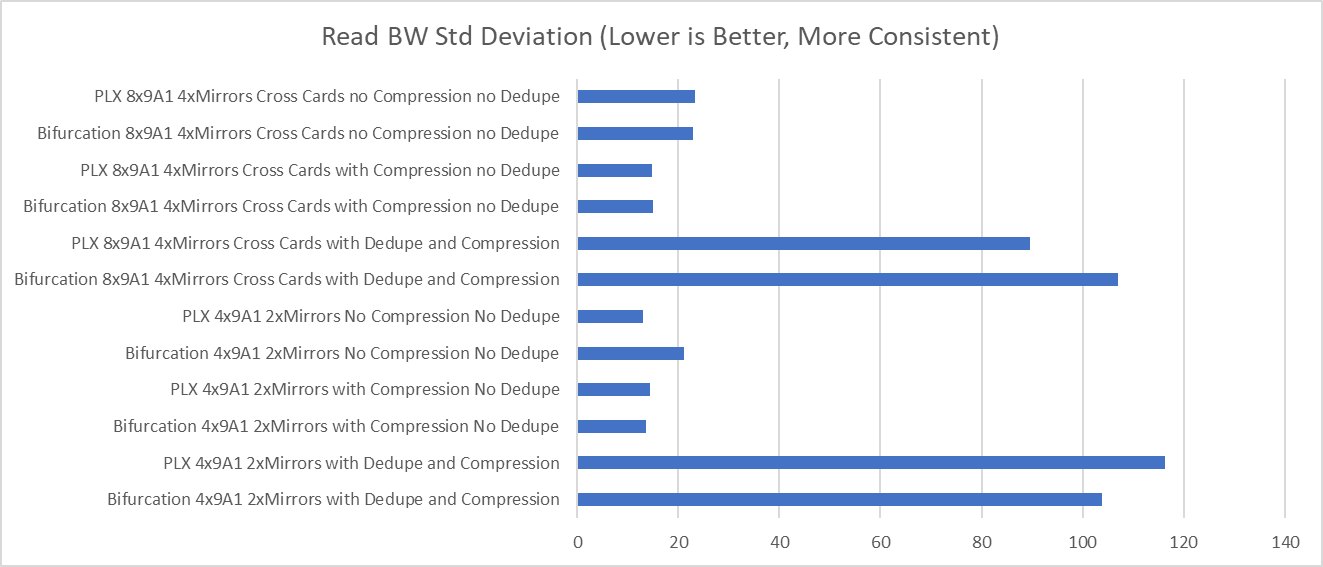
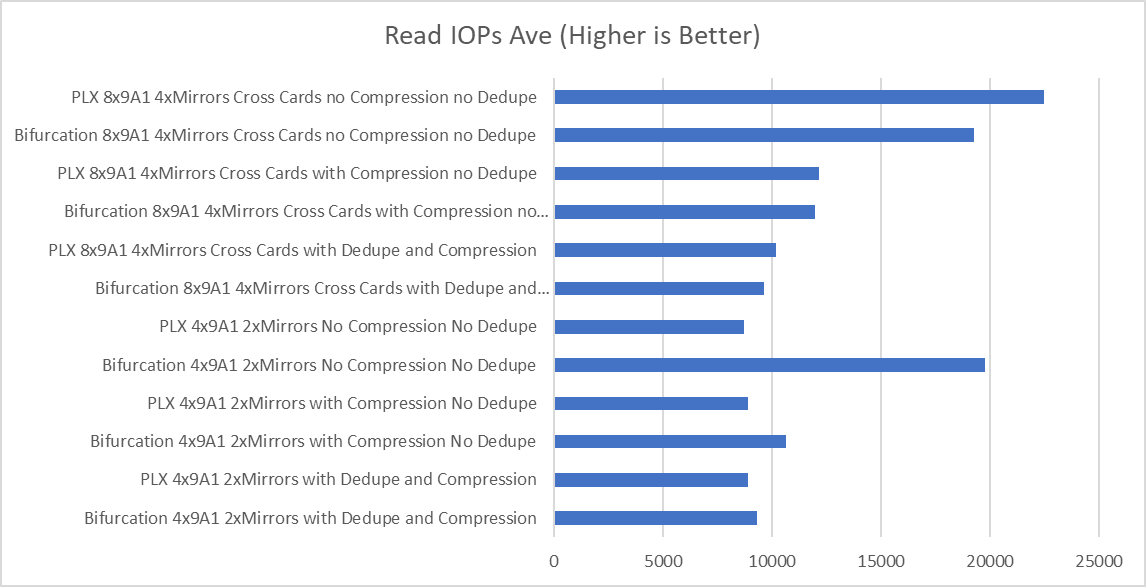
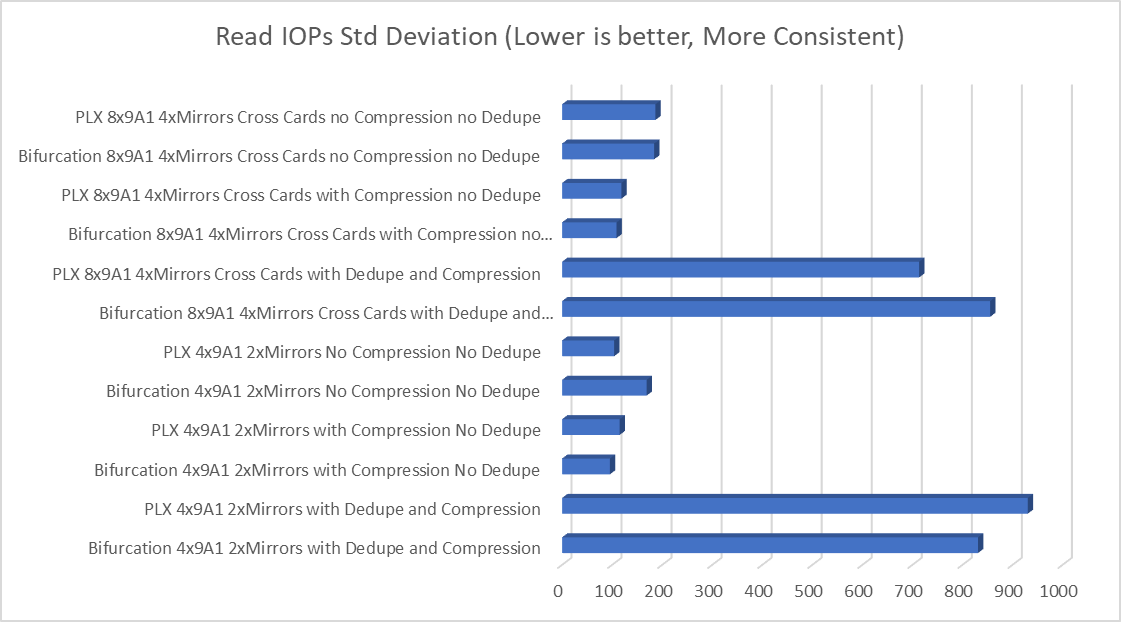
For today’s adventure, I tested 4 and 8 Samsung 9A1 512GB SSDs (PCIE Gen4), in 2 PLX PEX8747 (PCIE Gen3) Linkreal Quad M.2 adapter as well as 2 Bifurcation-based Linkreal Quad M.2 adapters in that new platform. My goal was to determine the performance differances between relying on motherboard bifurcation vs a PLX chip. I also wanted to test the performance impacts of compression and deduplication on NVME drives in both configurations. Testing was done using FIO, in a mixed read-and-write workload

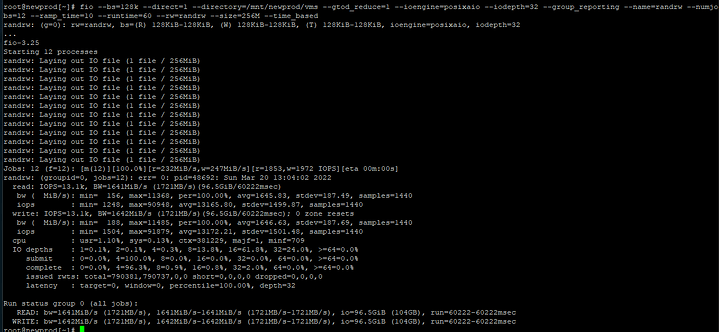
fio --bs=128k --direct=1 --directory=/mnt/newprod/ --gtod_reduce=1 --ioengine=posixaio --iodepth=32 --group_reporting --name=randrw --numjobs=16 --ramp_time=10 --runtime=60 --rw=randrw --size=256M --time_based

I hope this helps some folks. :slight_smile:

The first set of tests was done on single card with (4) 9A1s in a 2 VDEV mirrored configuration on each of the different cards.

Test Setup Read BW Min Read BW max Read BW Ave Read BW Std Deviation Read IOPs Min Read IOPs max Read IOPs Ave Read IOPs Std Deviation Write BW Min Write BW max Write BW Ave Write BW Std Deviation Write IOPs Min Write IOPs max Write IOPs Ave Write IOPs Std Deviation
Bifurcation 4x9A1 2xMirrors with Dedupe and Compression 142​ 7679​ 1163​ 103.88​ 1140​ 61437​ 9305​ 830.99​ 176​ 7642​ 1160​ 103.45​ 1414​ 61139​ 9282​ 827.56​
PLX 4x9A1 2xMirrors with Dedupe and Compression 87​ 10065​ 1110​ 116.32​ 698​ 80264​ 8885​ 930.54​ 116​ 10064​ 1109​ 116.32​ 928​ 80264​ 8874​ 930.65​
Bifurcation 4x9A1 2xMirrors with Compression No Dedupe 952​ 1967​ 1334​ 13.6​ 7621​ 15739​ 10655​ 95.55​ 1043​ 1931​ 1332​ 11.95​ 8346​ 15452​ 10655​ 95.55​
PLX 4x9A1 2xMirrors with Compression No Dedupe 693​ 2031​ 1114​ 14.38​ 5548​ 16252​ 8918​ 115.05​ 777​ 2033​ 1112​ 13.29​ 6216​ 16264​ 8898​ 106.33​
Bifurcation 4x9A1 2xMirrors No Compression No Dedupe 835​ 2471​ 1578​ 21.13​ 6686​ 6686​ 19770​ 168.97​ 857​ 2387​ 1579​ 20.02​ 6856​ 19098​ 12632​ 160.15​
PLX 4x9A1 2xMirrors No Compression No Dedupe 692​ 1654​ 1091​ 13.01​ 5542​ 13232​ 8734​ 104.04​ 764​ 1574​ 1089​ 11.58​ 6114​ 12598​ 8716​ 92.66​

The second set of tests was done with two matching cards with (8) 9A1s in a 4 VDEV mirrored configuration. The mirrors span between the cards, so if one entire card were to fail, the pool would remain in tact.

Test Setup Read BW Min Read BW max Read BW Ave Read BW Std Deviation Read IOPs Min Read IOPs max Read IOPs Ave Read IOPs Std Deviation Write BW Min Write BW max Write BW Ave Write BW Std Deviation Write IOPs Min Write IOPs max Write IOPs Ave Write IOPs Std Deviation
Bifurcation 8x9A1 4xMirrors Cross Cards with Dedupe and Compression 131​ 7641​ 1207​ 106.91​ 1055​ 61131​ 9658​ 855.27​ 171​ 7661​ 1204​ 106.68​ 1372​ 61294​ 9636​ 853.4​
PLX 8x9A1 4xMirrors Cross Cards with Dedupe and Compression 285​ 6266​ 1273​ 89.59​ 2910​ 50290​ 10169​ 713.47​ 363​ 6286​ 1271​ 89.19​ 2910​ 50290​ 10169​ 89.19​
Bifurcation 8x9A1 4xMirrors Cross Cards with Compression no Dedupe 1063​ 2092​ 1496​ 14.9​ 8506​ 16743​ 11968​ 108.81​ 1187​ 1979​ 1494​ 13.6​ 9500​ 15834​ 11959​ 108.81​
PLX 8x9A1 4xMirrors Cross Cards with Compression no Dedupe 1074​ 2152​ 1519​ 14.8​ 8594​ 17217​ 12155​ 118.4​ 1241​ 2009​ 1518​ 13.29​ 9930​ 16075​ 12147​ 106.31​
Bifurcation 8x9A1 4xMirrors Cross Cards no Compression no Dedupe 1664​ 3476​ 2412​ 22.98​ 13316​ 27809​ 19298​ 183.85​ 1741​ 3384​ 2415​ 172.6​ 13926​ 27077​ 19323​ 172.6​
PLX 8x9A1 4xMirrors Cross Cards no Compression no Dedupe 2010​ 3718​ 2811​ 23.32​ 16082​ 29747​ 22490​ 186.51​ 2073​ 3594​ 2815​ 21.73​ 16588​ 28758​ 22524​ 173.81​

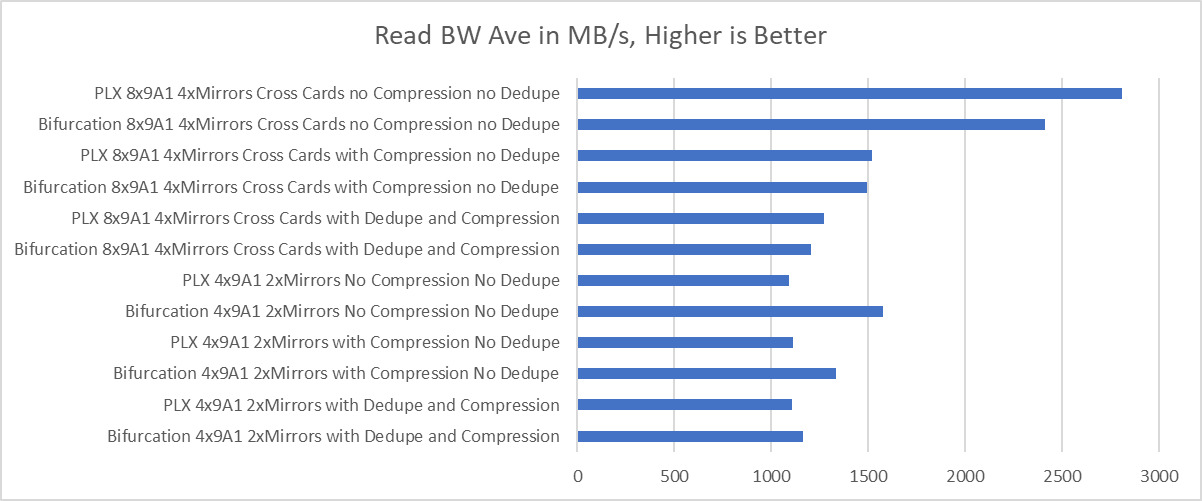
Some Bar Graphs:

Some interesting conclusions to be drawn :slight_smile: The narrower 4 disk pools seem to perform better with the bifurcation based solution, which is likely due to the fact these are PCIE Gen 4 drives. However, as we get wider, the overhead of relying on the mainboard to do the switching seems to grow and the PLX chip solution seems to deliver better performance.