TrueNAS Scale Performance Testing

In general, this is a very interesting test series. Thanks for making all the effort and sharing the results.

Unfortunately, the only conclusion that I see is that zfs is severely bottlenecking NVMe drives. Almost all test results of 4x and 8x show lower performance than what a single drive is capable of (it would be interesting to see the results for a single drive with zfs and ext4 or xfs for context).

Yes, zfs offers many benefits, but the main conclusion for me is to avoid zfs with nvme storage devices until the bottlenecks are fixed. At that point I would be more interested in these tests.

For you, my friend.
Using my workstation (Epyc 7302, 128GB DDR4 3200) on Windows 11, setup with storage spaces (default settings) in a Three way mirror configuration (not exactly apples-to-apples) this is what I get:

So yes, ZFS does present some overhead here in this test, but it’s not that large. This is an extremely stressful test designed to tease out the worst possible case scenario.

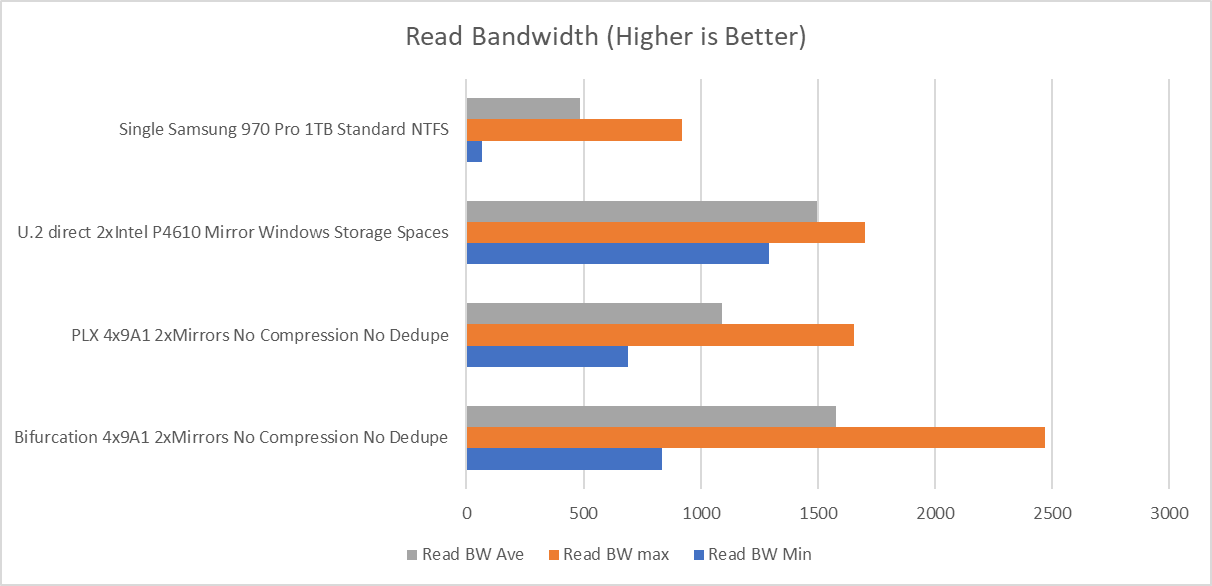
Further comparisons yield other additional information. Two Intel P4610 1.6TB drives in a mirrored configuration in Storage Spaces performs equally as poorly. I also threw in my boot drive for the lulz.

Here is the updated full chart

Test Setup Read BW Min Read BW max Read BW Ave Read BW Std Deviation Read IOPs Min Read IOPs max Read IOPs Ave Read IOPs Std Deviation Write BW Min Write BW max Write BW Ave Write BW Std Deviation Write IOPs Min Write IOPs max Write IOPs Ave Write IOPs Std Deviation
Bifurcation 4x9A1 2xMirrors with Dedupe and Compression 142 7679 1163 103.88 1140 61437 9305 830.99 176 7642 1160 103.45 1414 61139 9282 827.56
PLX 4x9A1 2xMirrors with Dedupe and Compression 87 10065 1110 116.32 698 80264 8885 930.54 116 10064 1109 116.32 928 80264 8874 930.65
Bifurcation 4x9A1 2xMirrors with Compression No Dedupe 952 1967 1334 13.6 7621 15739 10655 95.55 1043 1931 1332 11.95 8346 15452 10655 95.55
PLX 4x9A1 2xMirrors with Compression No Dedupe 693 2031 1114 14.38 5548 16252 8918 115.05 777 2033 1112 13.29 6216 16264 8898 106.33
Bifurcation 4x9A1 2xMirrors No Compression No Dedupe 835 2471 1578 21.13 6686 6686 19770 168.97 857 2387 1579 20.02 6856 19098 12632 160.15
PLX 4x9A1 2xMirrors No Compression No Dedupe 692 1654 1091 13.01 5542 13232 8734 104.04 764 1574 1089 11.58 6114 12598 8716 92.66
Bifurcation 8x9A1 4xMirrors Cross Cards with Dedupe and Compression 131 7641 1207 106.91 1055 61131 9658 855.27 171 7661 1204 106.68 1372 61294 9636 853.4
PLX 8x9A1 4xMirrors Cross Cards with Dedupe and Compression 285 6266 1273 89.59 2910 50290 10169 713.47 363 6286 1271 89.19 2910 50290 10169 89.19
Bifurcation 8x9A1 4xMirrors Cross Cards with Compression no Dedupe 1063 2092 1496 14.9 8506 16743 11968 108.81 1187 1979 1494 13.6 9500 15834 11959 108.81
PLX 8x9A1 4xMirrors Cross Cards with Compression no Dedupe 1074 2152 1519 14.8 8594 17217 12155 118.4 1241 2009 1518 13.29 9930 16075 12147 106.31
Bifurcation 8x9A1 4xMirrors Cross Cards no Compression no Dedupe 1664 3476 2412 22.98 13316 27809 19298 183.85 1741 3384 2415 172.6 13926 27077 19323 172.6
PLX 8x9A1 4xMirrors Cross Cards no Compression no Dedupe 2010 3718 2811 23.32 16082 29747 22490 186.51 2073 3594 2815 21.73 16588 28758 22524 173.81
Bifurcation 8x9A1 Windows Three-way Mirror Storage Spaces 3103 3558 3336.07 5.53 24533 28501 26713 46.87 3067 3564 3339 5.86 24533 28501 26713 46.87
U.2 direct 2xIntel P4610 Mirror Windows Storage Spaces 1292 1700 1498 5.06 10333 13592 11982 40.43 1296 1686 1497 4.79 10369 13488 11976 38.33
Single Samsung 970 Pro 1TB Standard NTFS 66 920 486 103.6 508 7186 3969 80.94 57 908 509 102.91 438 7091 3969 80.94
1 Like

This topic was automatically closed 273 days after the last reply. New replies are no longer allowed.