Note skip to the end for current recommendation. When this was written, Hybrid Polling was “brand new bleeding edge” kernel feature. Now it’s on by default.  The rest of this is mostly out of date and for posterity only.
Linus had this weird problem where, when we built his array, the NVMe performance wasn’t that great. It was very slow – trash, basically.
This was a 24-drive NVMe array.
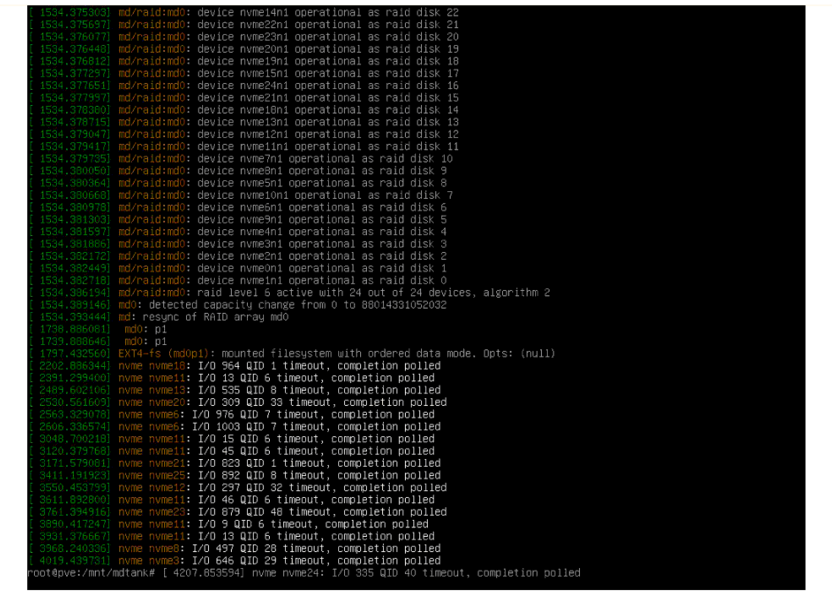
These error messages arent too serious, normally, but are a sign of a missed interrupt. There is some traffic I’m aware of on the LKML that there are (maybe) some latent bugs around the NVMe driver, so as a fallback it’ll poll the device if something takes unusually long. This many polling events, though, means the perf is terrible, because the system is waiting on the drive for a long, long time.
I ran iotop, examined systat, used fio, bonnie, dd. I checked the elevator queue, the nvme queue, the # threads MD was allowed to use, and nothing seemed to work.
The system messages / kernel messages were filled with errors like
[80113.916089] "echo 0 > /proc/sys/kernel/hung_task_timeout_secs" disables this message.
[80113.916572] vgs             D    0 70528   2199 0x00000000
[80113.917051] Call Trace:
[80113.917531]  __schedule+0x2bb/0x660
[80113.918000]  ? __blk_mq_delay_run_hw_queue+0x14a/0x160
[80113.918466]  schedule+0x33/0xa0
[80113.919078]  io_schedule+0x16/0x40
[80113.919576]  wait_on_page_bit+0x141/0x210
[80113.920054]  ? file_fdatawait_range+0x30/0x30
[80113.920527]  wait_on_page_writeback+0x43/0x90
[80113.920975]  __filemap_fdatawait_range+0xaa/0x110
[80113.921416]  ? __filemap_fdatawrite_range+0xd1/0x100
[80113.921851]  filemap_write_and_wait_range+0x4b/0x90
[80113.922284]  generic_file_read_iter+0x990/0xd60
[80113.922755]  ? security_file_permission+0xb4/0x110
[80113.923225]  blkdev_read_iter+0x35/0x40
[80113.923662]  aio_read+0xd0/0x150
[80113.924090]  ? __do_page_fault+0x250/0x4c0
[80113.924509]  ? mem_cgroup_try_charge+0x71/0x190
[80113.924900]  ? _cond_resched+0x19/0x30
[80113.925284]  ? io_submit_one+0x88/0xb20
[80113.925665]  io_submit_one+0x171/0xb20
[80113.926050]  ? strncpy_from_user+0x57/0x1b0
[80113.926430]  __x64_sys_io_submit+0xa9/0x190
[80113.926884]  ? __x64_sys_io_submit+0xa9/0x190
[80113.927288]  do_syscall_64+0x5a/0x130
[80113.927689]  entry_SYSCALL_64_after_hwframe+0x44/0xa9
[80113.928096] RIP: 0033:0x7f832176bf59
[80113.928503] Code: Bad RIP value.
[80113.928882] RSP: 002b:00007ffd205e2e48 EFLAGS: 00000246 ORIG_RAX: 00000000000000d1
[80113.929274] RAX: ffffffffffffffda RBX: 00007f832140c700 RCX: 00007f832176bf59
[80113.929670] RDX: 00007ffd205e2ef0 RSI: 0000000000000001 RDI: 00007f8321dc2000
[80113.930068] RBP: 00007f8321dc2000 R08: 0000561f12dee000 R09: 0000000000000000
[80113.930465] R10: 0000000000000100 R11: 0000000000000246 R12: 0000000000000001
[80113.930935] R13: 0000000000000000 R14: 00007ffd205e2ef0 R15: 0000000000000000
I was eventually able to reproduce this error on both 1P and 2P Rome systems, as well as even Naples systems. We were using Proxmox 6.1 which was kernel version 5.1+
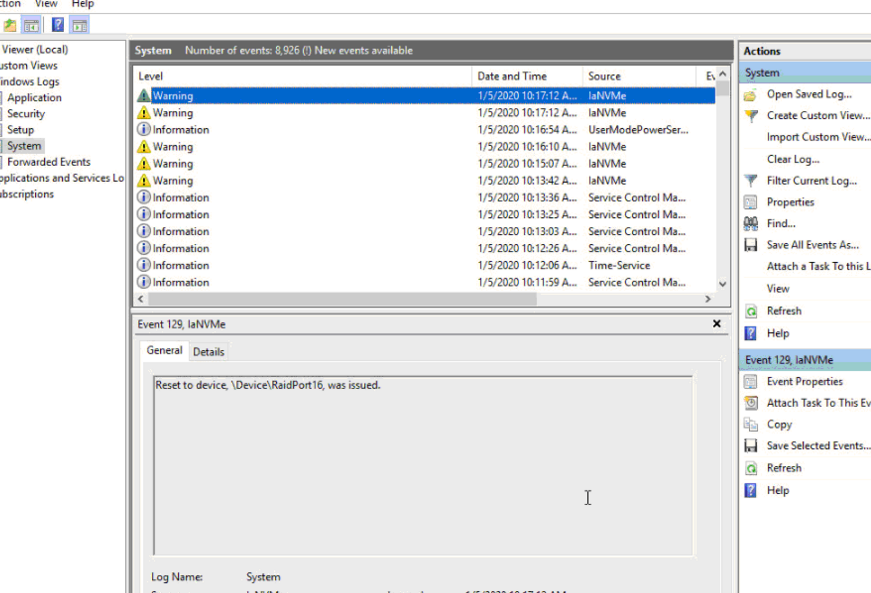
The baffling thing was these errors also seemed to be occuring in Windows Server 2019 – stornvme (as well as intel’s own native iAnvme driver) would complain about having to reset devices. And, when a device was reset, there were several seconds of just abysmal performance as one might expect.
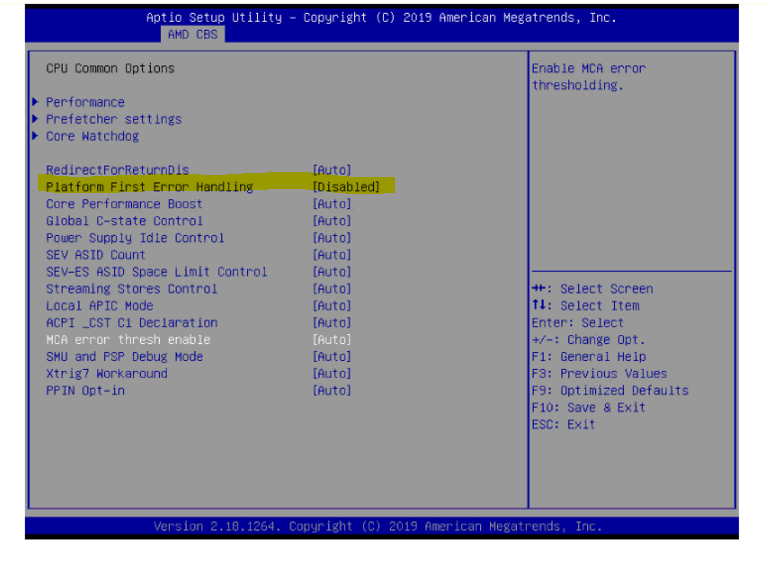
It was also necessary to change the PCIe Link training type from 1 step to 2 step. I also disabled platform first error handling, which may not have had any effect on the Rome system.
In windows, the error would still occur with the bios changes.
The fix on Linux was to also disable pcie_aspm and rcu_cbs as in the grub boot line here:
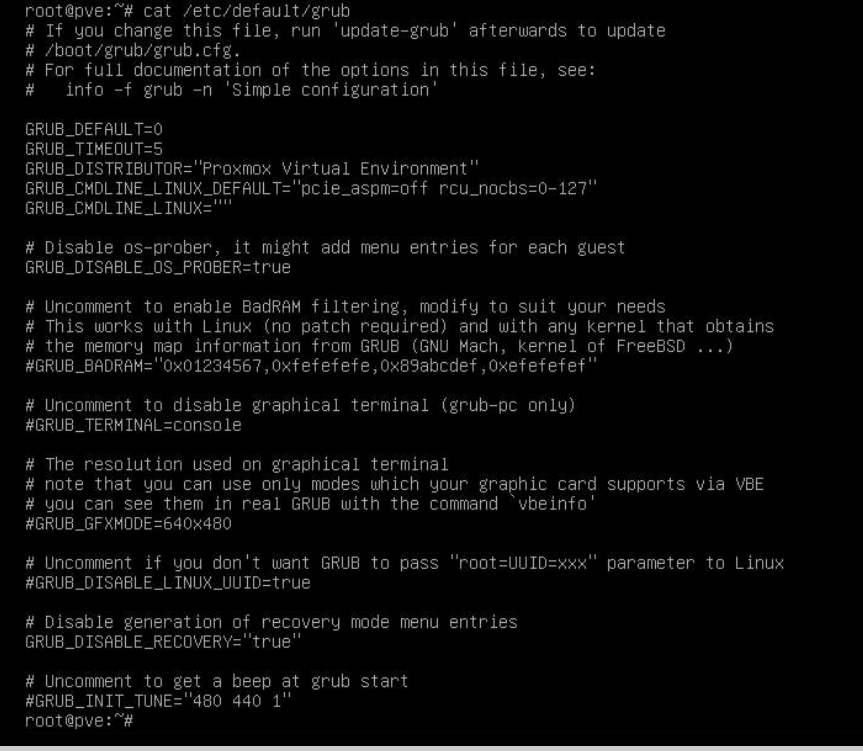
pcie_aspm=off rcu_nocbs=0-N #where n is the # cpus you have minus 1)
Part of the fix, at least with using Linux’s MD for basic throughput and latency testing, was to ensure the right settings were enabled:
echo mq-deadline > /sys/block/nvm*/queue/scheduler
# Note this was the default on Proxmox 6.1 so this change wasn't needed on PM6.1
echo noop > /sys/block/md127/queue/scheduler
echo 16 > /sys/block/md*/md/group_thread_cnt
# also note the * here you may need to substitute yourself for your actual md device e.g. md0, md127, etc.
After this, no more NVMe timeout/polled I/O (and performance was generally better) in Linux. (At least until ZFS enters the picture – more in a sec)
If you still see I/O failures, you can mitigate some of these failures (not completely), to an extent, by increasing the polling:
echo 16 > /sys/module/nvme/parameters/poll_queues
In FiO testing of the raw drives, the performance was limited to 3.9 million i/ops, even with all 24 drives. Just 8 drives was enough to cap 3.9 million i/ops in a 75/25 % read/write test.
So there is still some bottleneck somewhere. Possibly infinity fabric – possibly CPU/algorithm for Linux’s Multidisk.
Without the fixes, the performance on Linux was very inconsistent – ranging from a few hundred megabytes per second to a few gigabytes per second. With these fixes, we do not see any I/O timeouts (polling) in the errors and can manage around 2 gigabytes/sec write on any array size from 8 to 24 drives.
I noticed the CPU load was very high during this testing, so more investigation is needed to work out the bottleneck.
What’s the difference between 2666 and 2933 memory?
Kind of a lot – I was surprised. From the 2p Naples system @ 2666:
CPU model            : AMD EPYC 7371 16-Core Processor
Number of cores      : 64
CPU frequency        : 3051.794 MHz
Total size of Disk   : 11292.5 GB (18.0 GB Used)
Total amount of Mem  : 128783 MB (2987 MB Used)
Total amount of Swap : 8191 MB (1 MB Used)
System uptime        : 0 days, 0 hour 34 min
Load average         : 1.44, 2.43, 1.93
OS                   : Debian GNU/Linux 10
Arch                 : x86_64 (64 Bit)
Kernel               : 5.3.10-1-pve
----------------------------------------------------------------------
I/O speed(1st run)   : 1.1 GB/s
I/O speed(2nd run)   : 705 MB/s
I/O speed(3rd run)   : 854 MB/s
Average I/O speed    : 895.1 MB/s
----------------------------------------------------------------------
and 2933:
Futher Reading
AMD publishes the following resources. Though several of these still have not been updated for Epyc Rome, they are actually quite good guides:
There is a lot of useful information there and, if you are serious about getting the most out of your system(s), everything there is worth reading.
For the NVMe aspect, this doc is relevant:
…but it stops short of talking about arrays. Still, there are a lot if important best-practices and tips/tricks about tools to use, hardware topology and other somewhat advanced topics that may not be obvious to even seasoned administrators.
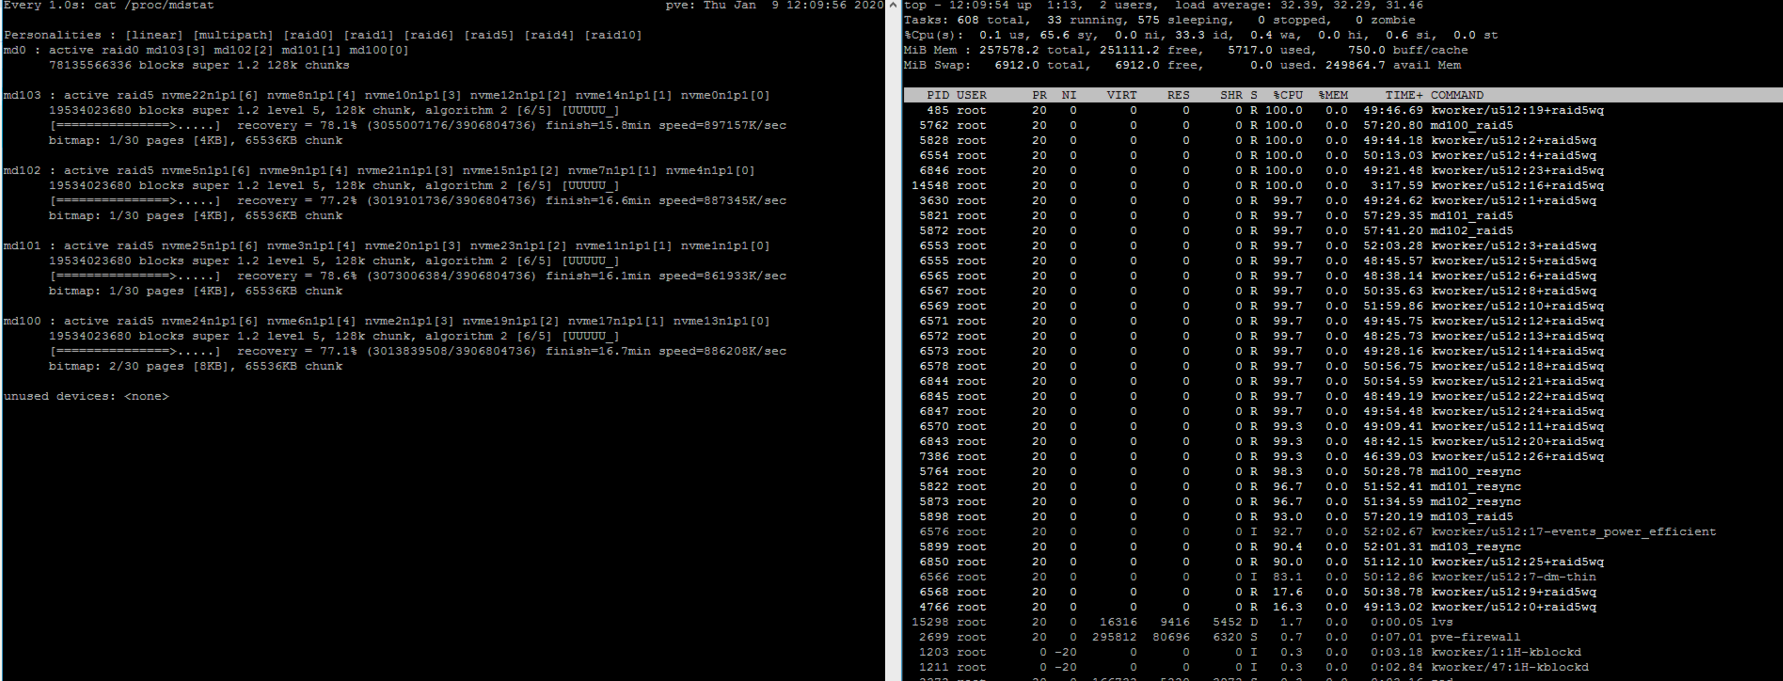
Linux MD? Just how much CPU Overhead we talking here?
When you have devices that can manage multiple gigabytes per second, the CPU overhead can be startling. Remember, you are moving billions of bytes per second PER DEVICE. That’s a lot of bits! Remember, our array bandwidth with 24 nvme drives is potentially 100 gigabytes/sec, but main memory bandwidth is only 150 gigabytes/sec.

It’s better to tune the storage for low latency rather than throughput.
fio is by far the best tool for testing this.
As we worked through the problem, we could verify the raw interface speed was as it should be, once we got the kernel issues worked out:
 fio disks3.txt
random-read: (g=0): rw=randread, bs=(R) 128KiB-128KiB, (W) 128KiB-128KiB, (T) 128KiB-128KiB, ioengine=libaio, iodepth=128
fio-3.12
Starting 1 process
Jobs: 1 (f=8): [r(1)][100.0%][r=12.6GiB/s][r=103k IOPS][eta 00m:00s]
random-read: (groupid=0, jobs=1): err= 0: pid=75526: Mon Jan  6 16:59:59 2020
  read: IOPS=103k, BW=12.5GiB/s (13.5GB/s)(752GiB/60003msec)
    slat (usec): min=2, max=583, avg= 4.76, stdev= 2.33
    clat (usec): min=4, max=9254, avg=1241.01, stdev=1277.83
     lat (usec): min=48, max=9257, avg=1245.85, stdev=1277.82
    clat percentiles (usec):
     |  1.00th=[   52],  5.00th=[   61], 10.00th=[   72], 20.00th=[  117],
     | 30.00th=[  306], 40.00th=[  371], 50.00th=[  515], 60.00th=[ 1106],
     | 70.00th=[ 1876], 80.00th=[ 2638], 90.00th=[ 3294], 95.00th=[ 3687],
     | 99.00th=[ 4424], 99.50th=[ 4686], 99.90th=[ 5080], 99.95th=[ 5211],
     | 99.99th=[ 5669]
   bw (  MiB/s): min=12743, max=12870, per=99.98%, avg=12834.40, stdev=18.21, samples=120
   iops        : min=101946, max=102966, avg=102675.13, stdev=145.71, samples=120
  lat (usec)   : 10=0.01%, 50=0.60%, 100=17.52%, 250=6.63%, 500=24.61%
  lat (usec)   : 750=5.97%, 1000=3.29%
  lat (msec)   : 2=13.04%, 4=25.79%, 10=2.54%
  cpu          : usr=14.52%, sys=54.35%, ctx=1681409, majf=0, minf=8289
  IO depths    : 1=0.1%, 2=0.1%, 4=0.1%, 8=0.1%, 16=0.1%, 32=0.1%, >=64=100.0%
     submit    : 0=0.0%, 4=100.0%, 8=0.0%, 16=0.0%, 32=0.0%, 64=0.0%, >=64=0.0%
     complete  : 0=0.0%, 4=100.0%, 8=0.0%, 16=0.0%, 32=0.0%, 64=0.0%, >=64=0.1%
     issued rwts: total=6161974,0,0,0 short=0,0,0,0 dropped=0,0,0,0
     latency   : target=0, window=0, percentile=100.00%, depth=128

Run status group 0 (all jobs):
   READ: bw=12.5GiB/s (13.5GB/s), 12.5GiB/s-12.5GiB/s (13.5GB/s-13.5GB/s), io=752GiB (808GB), run=60003-60003msec

Disk stats (read/write):
  nvme7n1: ios=767475/0, merge=0/0, ticks=183591/0, in_queue=344, util=99.76%
  nvme6n1: ios=767368/0, merge=0/0, ticks=183049/0, in_queue=492, util=99.77%
  nvme3n1: ios=767369/0, merge=0/0, ticks=174974/0, in_queue=108, util=99.78%
  nvme1n1: ios=767346/0, merge=0/0, ticks=1689904/0, in_queue=157120, util=99.82%
  nvme2n1: ios=767350/0, merge=0/0, ticks=1939968/0, in_queue=428928, util=99.84%
  nvme0n1: ios=767346/0, merge=0/0, ticks=1632328/0, in_queue=14852, util=99.84%
  nvme5n1: ios=767370/0, merge=0/0, ticks=185027/0, in_queue=360, util=99.87%
  nvme4n1: ios=767349/0, merge=0/0, ticks=1567675/0, in_queue=6736, util=99.92%
Here is our disks3.txt fio job file:
[global]
bs=128k
iodepth=128
direct=1
ioengine=libaio
randrepeat=0
group_reporting
time_based
runtime=60
filesize=6G

[job1]
rw=randread
name=random-read
filename=/dev/nvme7n1:/dev/nvme6n1:/dev/nvme3n1:/dev/nvme1n1:/dev/nvme2n1:/dev/nvme0n1:/dev/nvme5n1:/dev/nvme4n1
PCIe Errors? What about PCIe 2.0
Well, enter this handy script:
#!/bin/bash

dev=$1

if [ -z "$dev" ]; then
    echo "Error: no device specified"
    exit 1
fi

if [ ! -e "/sys/bus/pci/devices/$dev" ]; then
    dev="0000:$dev"
fi

if [ ! -e "/sys/bus/pci/devices/$dev" ]; then
    echo "Error: device $dev not found"
    exit 1
fi

port=$(basename $(dirname $(readlink "/sys/bus/pci/devices/$dev")))

if [[ $port != pci* ]]; then
    echo "Note: it may be necessary to run this on the corresponding upstream port"
    echo "Device $dev is connected to upstream port $port"
fi

echo "Configuring $dev..."

lc2=$(setpci -s $dev CAP_EXP+30.L)

echo "Original link control 2:" $lc2
echo "Original link target speed:" $(("0x$lc2" & 0xF))

lc2n=$(printf "%08x" $((("0x$lc2" & 0xFFFFFFF0) | 0x2)))

echo "New link control 2:" $lc2n

setpci -s $dev CAP_EXP+30.L=$lc2n

echo "Triggering link retraining..."

lc=$(setpci -s $dev CAP_EXP+10.L)

echo "Original link control:" $lc

lcn=$(printf "%08x" $(("0x$lc" | 0x20)))

echo "New link control:" $lcn

setpci -s $dev CAP_EXP+10.L=$lcn
Usage:
lspci |grep NVMe

change-speed.sh 0:00:01 # device ID
This will change the devices to PCIe 2.0 mode, which is perhaps useful for troubleshooting.
ZFS, best fs, performance is also shockingly slow.
ZFS is slow with a big NVMe array? WTF?
Its the memory copies – my old nemesis again!
To understand what’s happening here, you have to understand that there don’t seem to be a lot of optimizations at both a software and a device level for dealing with devices as fast as NVMe.
The I/O failures and Kernel Oopses with ZFS compound other problems also present; discovering and tackling each of these one at a time was tricky.
There are TWO kinds of I/O failures – one involving Epyc Rome and one involving ZFS’s vdev scheduler. It is critically important to set:
echo none > /sys/module/zfs/parameters/zfs_vdev_scheduler
to none.
When there is an I/O failure (pic at the top of this thread) or a kernel oops, the ZFS pool performance tanks for anywhere from 250msec to 1000msec – a full second!
Likewise, there is this thread on the Proxmox forums that says these kinds of kernel oopses are benign:
[    6.949900] General protection fault in user access. Non-canonical address?
[    6.949906] WARNING: CPU: 2 PID: 747 at arch/x86/mm/extable.c:126 ex_handler_uaccess+0x52/0x60
I disagree that these are benign. When these faults occur, performance tanks.
And even if everything is working right, ZFS is “slow” compared to NVMe.
Just things like “Should we ARC or not?” are hotly debated on GigHub. It’s easy to achieve 28 gigabytes/sec on a modern NVMe array – modern memory bandwidth is 100-150 gigabytes/sec with a properly-populated AMD EPYC Rome, for example – but you can quickly eat that up with “extra” copies around memory, and to cache.
In general, I recommend
There are two threads in particular on GitHub to keep in mind with ZFS (at least in January 2020).
One is about the loss of SIMD because of GPL/NoGPL problems with SIMD that ZFS had previously used to speed up BOTH encryption AND checksumming.
A lot of discussion elsewhere minimizes the loss of SIMD functions at the kernel level due to GPL issues because it “only affects encryption” but that simply isn’t the case:
(which is 0 by default). Especially if you are getting missed interrupts, which is another issue entirely.
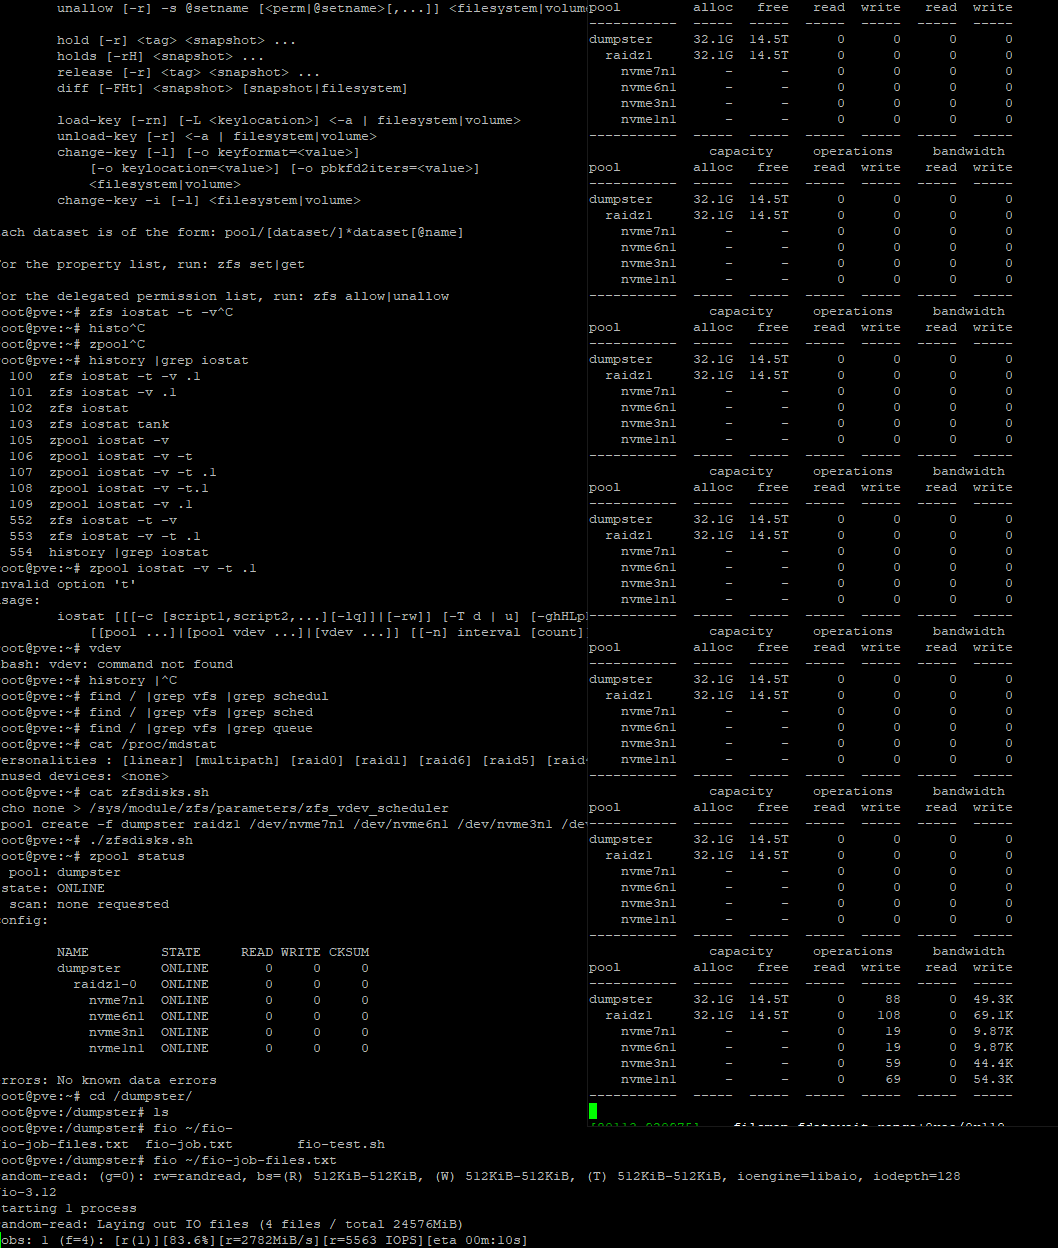
You can monitor ZFS pools for ‘sputtering’ with
zpool iostat -v -t .1
In the following screenshot, you can see that in collection of 1/10th of a second iostat snapshots, the array isn’t doing much. What I found was that ZFS was queueing requests on the NVMe but then never picking up the data from the NVMe in a timely fashion. The reason? It seemed to be busy copying things around memory – memory was very busy during this time. ARC maybe? I searched for others having similar issues.
That’s when I discovered this thread:
bwatkinson, you are my hero. This is the real MVP – they’ve done all the leg work to figure it out and it’s being patched.
DIRECT_IO probably is the fix here. Disabling compressed ARC certainly helps, and probably also dataset compression.
A ZFS Story in a side-by-side comparison.
Here is a 4 drive raid-z1 with the attached FIO test, and you can see the ‘sputtering’
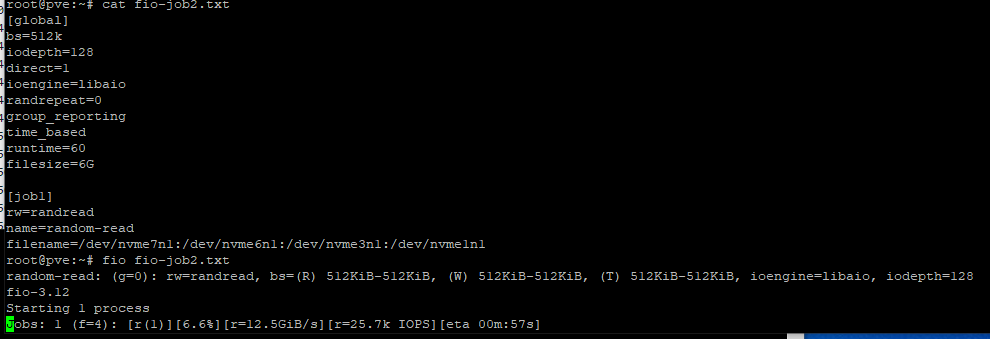
… that’s some pretty trash ZFS performance for an NVMe Array,
This is basically testing the very same devices with fio With and Without filesystem.
but with some
[ 2051.046910] nvme nvme2: I/O 135 QID 63 timeout, completion polled
that error returns ONLY when ZFS is in use. Linux’s MD doesn’t generate these timeouts, assuming you’ve made the other changes in this thread.
TL;DR Just Tell Me What You Did
ZFS isn’t ready for fast NVMe arrays, yet, unless you’re adventurous or you’re bwatkinson or you’re me, possibly, from the github thread above.
It can still be used on Epyc Rome, and is in fact face-melting, but ZFS is not the file system that makes sense (for now) if you want greater than 10 gigabytes/sec read/write.
These are the things that worked for me at some stage or another. This is not the final config, but some useful info here:
nvme_fast.sh

echo 16 > /sys/module/nvme/parameters/poll_queues
echo mq-deadline > /sys/block/nvme0n1/queue/scheduler
echo mq-deadline > /sys/block/nvme1n1/queue/scheduler
echo mq-deadline > /sys/block/nvme2n1/queue/scheduler
echo mq-deadline > /sys/block/nvme3n1/queue/scheduler
echo mq-deadline > /sys/block/nvme4n1/queue/scheduler
echo mq-deadline > /sys/block/nvme5n1/queue/scheduler
echo mq-deadline > /sys/block/nvme6n1/queue/scheduler
echo mq-deadline > /sys/block/nvme7n1/queue/scheduler
# for MD Arrays (no zfs)
echo noop > /sys/block/md0/queue/scheduler
echo 8 > /sys/block/md0/md/group_thread_cnt
echo 8192 > /sys/devices/virtual/block/md0/md/stripe_cache_size
# increase resync speed
sysctl -w  dev.raid.speed_limit_max=10000000
# /etc/default/grub
GRUB_CMDLINE_LINUX_DEFAULT="pcie_aspm=off rcu_nocbs=0-64"

# is your motherboard's Message Signaled Interrupt (MSI) bugged? Looking at you, Gigabyte!
# add pci=nomsi
GRUB_CMDLINE_LINUX_DEFAULT="pcie_aspm=off rcu_nocbs=0-64 pci=nomsi"
Don’t forget the PCIe 2.0 script above.
In the end, a stripe of four raid-5 devices was where we ended up:
We created a service to set tunable params on boot that didn’t seem to be sticky:
[Unit]
Description=Linus Speedy Tunables
#ConditionPathExists=/mnt/bigdata/Users
#After=systemd-user-sessions.service plymouth-quit-wait.service
After=rc-local.service
#Before=getty.target
IgnoreOnIsolate=yes

[Service]
User=root
ExecStart=/root/mdadm_speedup.sh
ExecStop=/root/mdadm_speedup.sh
Type=oneshot
RemainAfterExit=true

[Install]
WantedBy=basic.target
I put those kinds of files in /root/ as a gentle reminder to NEVER FORGET THEM when setting up a new machine.
#!/bin/bash
# long day ...


echo 6 > /sys/devices/virtual/block/md124/md/group_thread_cnt
echo 6 > /sys/devices/virtual/block/md125/md/group_thread_cnt
echo 6 > /sys/devices/virtual/block/md126/md/group_thread_cnt
echo 6 > /sys/devices/virtual/block/md127/md/group_thread_cnt


#echo 12 > /sys/devices/virtual/block/md123/md/group_thread_cnt
#echo 8192 > /sys/devices/virtual/block/md0/md/stripe_cache_size
echo 8192 > /sys/devices/virtual/block/md124/md/stripe_cache_size
echo 8192 > /sys/devices/virtual/block/md125/md/stripe_cache_size
echo 8192 > /sys/devices/virtual/block/md126/md/stripe_cache_size
echo 8192 > /sys/devices/virtual/block/md127/md/stripe_cache_size
sysctl -w  dev.raid.speed_limit_min=10000000
sysctl -w  dev.raid.speed_limit_max=10000000

echo 24 > /sys/module/nvme/parameters/poll_queues

# 2021 update -- This isn't needed anymore, modern kernels disable the scheduler on nvme! So happy

for i in {0..25}
do
   echo none > /sys/block/nvme${i}n1/queue/scheduler
done

exit 0
What about Windows?
I was never able to resolve the I/O Reset issue on Windows for storage spaces. [2021 update] I am thinking it has to do with MSI. Disable MSI and see if that clears things up for you.
I can tell you the error occurs whether you use Intel’s NVMe driver for the P4500 or whether you use the one that comes bundled with Windows Server 2019.
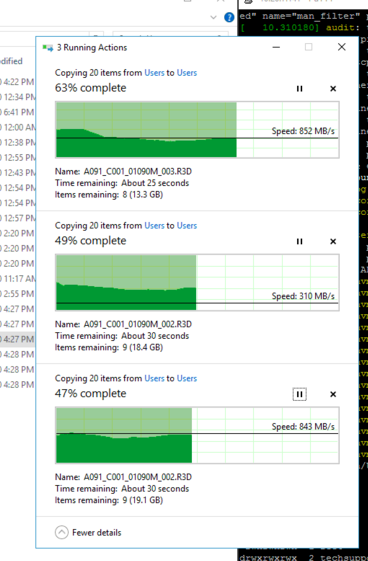
While windows as a host OS was out, it was possible to get decent transfers in and out of the system via the Mellanox 40gig ethernet adapter:
Yet More Insanity
# hybrid polling AND interrupts
GRUB_CMDLINE_LINUX_DEFAULT="pcie_aspm=off rcu_nocbs=0-127 pci=noaer nvme_core.io_timeout=2 nvme.poll_queues=64 max_host_mem_size_mb=512 nvme.io_poll=0 nvme.io_poll_delay=0"

# totally 100% polling no interrupts
GRUB_CMDLINE_LINUX_DEFAULT="pcie_aspm=off rcu_nocbs=0-127 pci=noaer nvme_core.io_timeout=2 nvme.poll_queues=64 max_host_mem_size_mb=512 nvme.io_poll=1 nvme.io_poll_delay=0"

# is your motherboard's interrupt controller just broken? Disabled MSI!
GRUB_CMDLINE_LINUX_DEFAULT="pcie_aspm=off rcu_nocbs=0-127 pci=noaer nvme_core.io_timeout=2 nvme.poll_queues=64 max_host_mem_size_mb=512 nvme.io_poll=1 nvme.io_poll_delay=0 pci=nomsi "
For whatever reason, the first version was much better than 100% polling all the time FOR WRITES
By default this nvme timeout is 30 seconds, which is GLACIAL in this setup. This also sets the timeout to be 2. Seconds. Which is much more tolerable. In 2 seconds “in flight” data can still move from buffers to memory, so it is less noticed BUT ideally we should NOT have these i/o timeouts, at all.
2021 Update
I got another batch of these drives in, and for whatever reason, they weren’t working as well. I discovered two other possible fixes.
The first?
intelmas start -intelssd [YOUR SSD ID HERE] -NVMeFormat LBAformat=1 SecureEraseSEtting=0 ProtectionInformation=0 MetadataSettings=0
This will reformat the drive using 4k sectors. They show up as 512k but it doesn’t work great anyway – you want 4k. My first set of drives was always 4k.
LBAFormat=1 means 4k. How’d I know that?
smartctal -a /dev/nvme2

[snip]

Supported LBA Sizes (NSID 0x1)
Id Fmt  Data  Metadt  Rel_Perf
 0 +     512       0         2
 1 -    4096       0         0

[snip]

 intelmas show -a -intelssd
this will also show important info about your ssd.
Changing LBA formats erases everything! Be warned!
On Proxmox, adding nvme_core.default_ps_max_latency_us=0 to the kernel parameters in /etc/default/grub (then issuing the update initramfs command) might also be necessary.
I Also recommend disabling MSI on Gigabyte Platforms. There is some platform-specific tinkering that has happened in late 20202/2021 and GB is the only platform left that still has problems with the Intel P4500 and Message Signaled Interrupts. Additionally, changes to the Linux Kernel means that you really do not want a scheduler for your nvme anymore. It works fine with prettymuch out-of-the-box settings.
So first, disable AER. Then disable MSI if you still have problems with P4500s. That has resolved the issue for me in every case, so far.
Updates to the Naples platform from 2020 seem have also resolved the interrupt timing issues.