Undervolting my 5900X

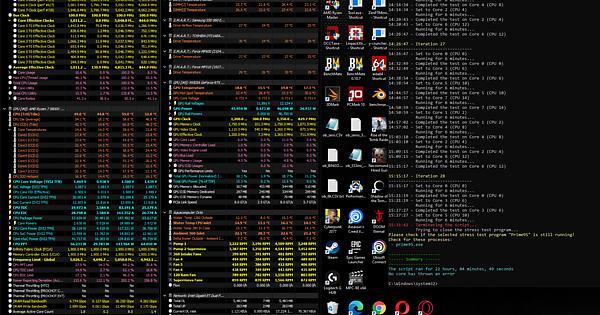
Like I did with my 2700X and my GPU and as I hinted in another thread I have decided to give undervolting my 5900X a try. My initial plan was to use two games (Shadow of the Tomb Raider, Guardians of the Galaxy) as well as Cinebench to benchmark the undervolted CPU as well as CoreCycler to verify the stability to a certain degree. It should be noted that I do not test for 24/7 stability, but rather test until a stability I deem sufficient has been reached.

At the start, I set each core to a negative offset of -10 and ran my benchmarks. One thing that was seemingly shown by Guardians of the Galaxy was that there was a problem with a -10 offset which can be seen here:

Stock:

Undervolt:

It seems like GotG is very good at picking up an unstable undervolt and that there a frametime spikes if the core isn’t stable. CoreCyler agreed with GotG’s assumption and I turned out that my best core (core 2) is unable to run stable at any kind of negative offset (I didn’t test -1, but it was still unstable at -2). With the core 2 issue being resolved I ran GotG’s benchmark again and the frametime spikes still seem to occur, even though less pronounced than in the image above.

Thus, it seems as if another core is still unstable, but I’m currently down to 50% of my cores and all seem stable (== 1h of CoreCyler with default setting) enough. I’m wondering if I should ditch CoreCyler for the time being and just use GotG to verify stability while I do adjust the core affinity by means of the command line.

That being said, I’m wondering if I should something different than FFTSize = Huge, e.g. Moderate, Heavy or HeavyShort since the seem to be recommended by a certain Curve Optimizer Guide Ryzen 5000 ([1]). I’m also wondering if I’m wasting my time with a 1h run given that the Core 2 instabilities were picked up before the 10min mark had been reached.

Also, I’m wondering if I’m wasting my time in general given that I would like to have an increase in performance, or decrease in voltage and temperatures, but without suffering any frametime spikes like the ones shown above.

Are there other people with Ryzen 5000 Curve Optimiser experiences? How were you testing for stability and performance degradation?

Edit 10.12.2021: After I had a look at ProcessLasso, as suggested by @infinitevalence I noticed that there wasn’t a portable version available and I didn’t want to install anything for the sole purpose of testing. As I result, I used Windows’ PowerShell to adjust the affinity accordingly which does work. However, it is utterly boring and I wasn’t really motivated to do any kind of testing.

Thus, I decided to write a PowerShell script that starts Cinebench r23 and both iterates through all of my cores, sets the affinity accordingly and writes the output into log files. Now, my presence is only required to parse the output and verify that everything went according to plan.

I am still torn if I should share this script and put it on GitHub. On one hand, I do like to share things like that, on the other it is hacked together and its usability is also not the greatest.

Anyway, if you want to have a look at the script or use it for your purposes there you go:

$cinebench = "<Path to cinebench>"
$logFolder = "<Path to log folder>"

For ($core=0; $core -le 11; $core++) {
	$formattedCoreNumber = '{0:d2}' -f $core
	Write-Output "Saving to $logFolder\uv$formattedCoreNumber.dat"
	$cinebench = Start-Process -FilePath $appName -ArgumentList "g_CinebenchCpu1Test=true" -RedirectStandardOutput "$logFolder\uv$formattedCoreNumber.dat"  -PassThru

    # The polling is necessary because the render process is started separately
	For ($i=0; $i -le 150; $i++) {
		$cinebench.ProcessorAffinity = 3 -shl ($core * 2)
		Write-Output "Setting Affinity $i"
		Start-Sleep -Milliseconds 200
	}

	Write-Output "Waiting for CinebenchR23...."
	Start-Sleep -s 120
	Get-Process Cinebench | Select-Object ProcessorAffinity |  Out-File -FilePath "$logFolder\uv_af$formattedCoreNumber.dat" -Append

	$nid = (Get-Process cinebench).id
	Wait-Process -Id $nid

	Write-Output "Me so tired...."
	Start-Sleep -s 120
	Write-Output "Me awake :-\)"
}

Read-Host -Prompt "Press Enter to exit"

Edit 25.01.2022
I know it has been a while, but I have concluded the -10 and -15 curve I wanted to test and wanted to share my results.

All -10 - Core 2 0:
Multi:			21195, 18172, 21305, 21503, 21532, 21544
                Avg: 20,875
Single C00:		1577.00, 1584.00, 1582.00, 1595.68, 1604.87, 1587.02
                Avg: 1588.43
Single C01:		1590.00, 1598.00, 1603.35, 1596.21, 1588.22
                Avg: 1595.16
Single C02:		1604.76, 1600.12, 1584.88
                Avg: 1595.59
Single C03:		1594.00, 1591.00, 1590.57, 1585.11, 1584.18
                Avg: 1588.97
Single C04:		1577.00, 1586.00, 1597.36, 1593.72, 1577.43
                Avg: 1586.3
Single C05:		1573.00, 1567.00, 1583.44, 1577.32, 1561.02
                Avg. 1573.36
Single C06:		1538.00, 1540.00, 1556.50, 1554.37, 1538.75
                Avg: 1545.52
Single C07:		1568.00, 1568.00, 1579.93, 1572.69, 1566.77
                Avg: 1571.08
Single C08:		1543.61, 1534.29, 1528.38
                Avg: 1535.43
Single C09:		1550.90, 1541.06, 1530.53
                Avg: 1540,83
Single C10:		1535.94, 1530.26, 1520.06
                Avg: 1528.75
Single C11:		1534.60, 1549.99, 1539.09
                Avg: 1541.23
All -15 - Core 2 0:
Multi:			21607, 21680, 21548
                Avg: 21,611 (+3.53%)
Single C00:     1580.82, 1593.18, 1550.20, 1591.50, 1550.58
                Avg: 1573.46 (-1%)
Single C01:     1600.78, 1595.61, 1557.85, 1601.94, 1592.72
                Avg: 1589.78 (-0.4%)
Single C03:     1597.18, 1600.43. 1597.53, 1597.76, 1599.32
                Avg: 1598.44 (+0.6)
Single C04:     1599.96, 1592.00, 1599.89, 1598.48, 1600.49
                Avg: 1598.16 (+0.7%)
Single C05:     1580.90, 1583.45, 1588.90, 1586.25, 1574.30
                Avg: 1582.76 (+0.6%)
Single C06:     1556.03, 1559.99, 1560.15, 1555.01, 1559.59
                Avg: 1558.15 (+0.8%)
Single C07:     1575.84, 1578.83, 1578.93, 1585.78, 1589.31
                Avg: 1581.74 (+0.7%)
Single C08:     1539.22, 1544.48, 1540.65, 1549.81, 1546.47
                Avg: 1544.13 (+0.6%)
Single C09:     1548.41, 1558.70, 1552.50, 1558.21, 1553.57
                Avg: 1554.28 (+0.9%)
Single C10:     1532.43, 1534.71, 1533.44, 1532.78, 1536.99
                Avg: 1534.07 (+0.3%%)
Single C11:     1550.39, 1553.90, 1559.99, 1560.37, 1563.50
                Avg: 1557.63 (+1%)

There has been a small performance increase for all cores except Core 0 and Core 1. However, I’m currently not entirely sure if 1% difference is in the margin of error and I would take another couple of samples to meaningfully calculate this margin.

As a result, I will treat it as margin of error and set my curve to -20. If there is yet another drop of on the already weaker cores I will have to bump this number up again. Also, I might have to redo my -10 testing on these cores because my testing procedure changed a tiny bit and this might also affect the results. Thus, I will continue my testing and update this thread once I’m done with -20.

2 Likes

Does someone know if it is possible to benchmark different cores? I’m looking for something like running CB23 on Core 0, the. Core 1 and so on. Currently, it just uses the best core but I would like to use each one individually.

I know I can set the core affinity, but I can only do this after the benchmark has started which introduces a too high variance. I also know I can run prime95 or y-cruncher to see how high the individual cores clock, but as to my knowledge this isn’t the best way to pick up any performance irregularities that might have been introduced with undervolting.

you can link cores and tasks using process lasso

So take a single core benchmark like cinebench and use Process Lasso to pin it to a single core, test/replete, + 1 core, test/repeat…

1 Like

Ah, so process lasso will remeber it and apply at at the very start of the test? That’s good to know, thanks! :+1: :blush:

(updated main post)

but did you get any results?

As someone with a 5900x i am very interested in this testing :stuck_out_tongue:

It running currently and I would like to have three runs with each core to build a baseline. Afterwards, I will continue decreasing the voltage. The only result I currently have is that core 2 (my best core) is not able to handle any negative offset, all other cores seem to be fine at -10 for the time being.

Regarding the Cinebench run I have no default data set to compare against, but this shouldn’t be an issue. I will update this thread once I have more information to share.

Have you tried ClockTuner for Ryzen by 1USMUS? He’s got insde knowledge direct from AMD(by this I mean AMD engineer’s help him) on tuning Ryzen CPU’s and his program is pretty good at it.

1 Like

I know the tool but I haven’t tried it myself yet. There are two reasons for this:

  1. Allegedly, there were cases where this ClockTuner degraded the CPU due to it raising the VCORE too high. Personally, I think that this could only be the case if this tool is used for overclocking and not just undervolting.

  2. I don’t like the idea of having another tool running in the background, that adjusts values in the OS, I prefer to have these values set in the BIOS

That being said, I believe that said ClockTuner (and the successor Hydra) are quite good in achieving their goal.

On point 1, I think they fixed that in later revisions. I haven’t used it since I reinstalled, since it pretty much didn’t do much for my sub-par under the bottom of the barrell 3600 I got.

1 Like

Yeah, I think ClockTuner or Hydra are perfectly viable and might result in better results faster than I will get with my CurveOptimiser tuning. My second point still remains and so I will still go with the BIOS/Curve Optimiser approach.

On that note: I’m almost done with my all cures -10 (except core2 at 0) and will post the preliminary results here. Afterwards, I will set the curve to -15 (or -20 if I’m brave enough) and continue my testing.

As I’ve mentioned previously, my testing does take time because I’m not motivated sufficiently to spend a large amount of time testing. Thus, I have a quick after I have used the PC and I don’t specifically turn it on for this very purpose.

You have more patience for OC’ing than I do. When I started with PC’s, OC wasn’t a thing, when I dropped PC’s for awhile then OC started picking up, now that I’m back into it, OC is still a thing but more complicated than ever and just doesn’t make sense for any of my use cases. So 1USMUS’s programs are a viable thing for me if I ever find a CPU that is above the level of “scraped off the dirt side of the bottom of the barrel”.

@Azulath did you ever finish your testing?

1 Like

No, I’m still in the process of testing, but during the Christmas holidays I’m a not where my PC lives :laughing:

Anyway, if you are interested in a preliminary dump there you go:

[azulath@mbp ~/Documents/PC/undervolt] cat undervolt.txt

Stock:
Multi:		20911
Multi:		20832
Multi:		20719
Single:		1570
Single:		1609
Single:		1617

All -10 - Core 2 0:
Multi:			21195, 18172, 21305, 21503, 21532, 21544
Single C00:		1577.00, 1584.00, 1582.00, 1595.68.00, 1604.87, 1587.02
Single C01:		1590.00, 1598.00, 1603.35, 1596.21, 1588.22
Single C02:		1604.76, 1600.12, 1584.88
Single C03:		1594.00, 1591.00, 1590.57, 1585.11, 1584.18
Single C04:		1577.00, 1586.00, 1597.36, 1593.72, 1577.43
Single C05:		1573.00, 1567.00, 1583.44, 1577.32, 1561.02
Single C06:		1538.00, 1540.00, 1556.50, 1554.37, 1538.75
Single C07:		1568.00, 1568.00, 1579.93, 1572.68, 1566.77
Single C08:		1543.61, 1534.29, 1528.38
Single C09:		1550.90, 1541.06, 1530.53
Single C10:		1535.94, 1530.26, 1520.06
Single C11:		1534.60, 1549.99, 1539.09

All -15 - Core 2 0:
Multi:			21607, 21680, 21548
Single C00:     1580.82, 1593.18
Single C01:     1600.78, 1595.61
Single C03:     1597.18, 1600.43
Single C04:     1599.96, 1592.00
Single C05:     1580.90, 1583.45
Single C06:     1556.03, 1559.99
Single C07:     1575.84, 1578.83
Single C08:     1539.22, 1544.48
Single C09:     1548.41, 1558.70
Single C10:     1532.43, 1534.71
Single C11:     1550.39, 1553.90

All -10:
Multi:		20999
Single:		1617
[azulath@mbp ~/Documents/PC/undervolt] cat stats/uv* | grep -a "CB"
CB 1550.20 (0.00)
CB 1557.85 (0.00)
CB 1597.53 (0.00)
CB 1599.89 (0.00)
CB 1588.90 (0.00)
CB 1560.15 (0.00)
CB 1578.93 (0.00)
CB 1540.65 (0.00)
CB 1552.50 (0.00)
CB 1533.44 (0.00)
CB 1559.99 (0.00)

I still would like to do one test at -15mV before proceding with -20mV in my testing. Thus far it seems like there is no measurable (*) degradation in single threaded performance, while all core performance is still being improved.

*) Actually, I don’t know given that I would need to calculate the mean value. I’m also thinking about calculating a standard deviation but given I only take three measurements per core I doubt I have a high enough data-set to make any so educated estimation.

Anyway, I will continue my testing and I will come back to this thread once I have any conclusive data. Thanks for your interest :slight_smile:

Edit: The cat is performed on Cinebench R23 results with Core2 missing from it.

Hydra is now freeware on igorslab.de and you get a pretty decent curve values if you run the diagnostics. Look in the log for the section with “bios values”

For stability testing I suggest corecycler (search overclock.net, if you have time read the whole thread)
I also test with y-cruncher, occt and blender benchmark.

Cinebench is… decent to compare performance and thermals if you mainly plan on gaming. It’s too heavy to find out really high boost instability on single cores. And far to light for heavy avx stability.

1 Like

Thanks, I might have a look at this tool. I didn’t know that it was able to provide you with a curve alone as well.

(updated main post)

1 Like

My 5900x seemed okay on a -30 PBO offset. Seemed okay but I had too many iffy bits and bobs to blame. Motherboard seems shit, PSU needed replacing, as did the case. Now that I’ve replaced the PSU and case it seems okay with as good a clock and temp results and 100% stable on a 0 offset.
I don’t give too much credance to “stable if” I personally want “stable and” so idk, maybe I’d advise a push pull config and OTT all in one water cooler. PBO on Ryzen seems to be this quadratic of temperatures, voltage, current, power targets. When you cool it better the other factors seem to be given room to do whatever. When you do a PBO offset it seems to just push the voltage down.

1 Like

I probably won’t go lower as -20 but we shall see. Currently, my PC is working fine without any issues so I doubt there is anything I would need to replace.

Also, given that I’m already using a CLC I think the only upside in terms of cooling would be a full custom loop, but I won’t be using one for this PC. However, I do really like pushing voltages down since this either improves performance, or reduces the heat generated and both things are beneficial.

I would also like to add I had some difficulties understanding the points you tried to make, so let me rephrase your statements:

  • you’ve had a faulty PC and used to run stable at all cores -30
  • you are not doing that on your new setup, which uses the same CPU and has the same performance at 0 as the old one at -30
  • you don’t see that much of a point in PBO and you would just invest in better cooling

Did I get this right?

I suspected the PSU wasn’t up for the job and just don’t like the motherboard, the main M.2 is in an awkward position and its technically not compatible with my AIO because of it but everything technically fits properly, I still just don’t like it. The PSU was a 650watt from about 2012 so it needed replacement anyway. I haven’t gone back to test since I got a new PSU at -30. I had a hard power cycle three times with PBO -30, it only happened while the CPU went from idle / low usage to very high usage which pointed towards the PSU being incapable of giving the 5900x everything it needed quickly enough.
The case I had it in was even older than the PSU. CM690 II and I had enough drives installed that I couldn’t remove the HDD cage.


Typical highs of around 80c with throttling of the turbo down to under 4ghz with no PBO offset, at -30 it would hover around 70c ish but peak clocks were a consistant 5.050ghz on every core.
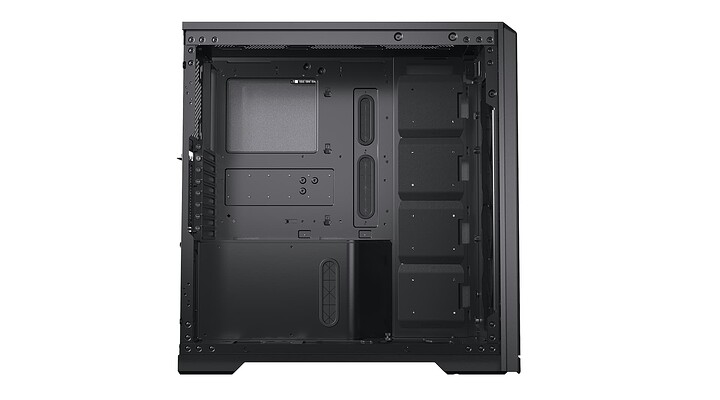
Since installing it in my new case, Phanteks Enthoo 2,
, my highs are closer to 60 or 65 when I’m doing oodles of crap with no PBO offset and the peak boost typically stays around the advertised 4.8ghz on most cores. The only way to push the temps higher is to run the AIO pump and fans at a stupidly low speed. Part of the reasons I don’t like the board is that I can’t cap the fan speeds and doesn’t have a real fan curve that I feel I’m in control. I can end up hearing the fans and water cooler ramping up to deal with me opening a tab on YouTube to deal with a split second temperature spike, plus the whole Aurous software suite is trash, slow, and ugly. I’ve seen it shit its brains out when I tried to change fan speeds and not just crash but somehow shut off every fan connected to the board and even the AIO.

1 Like