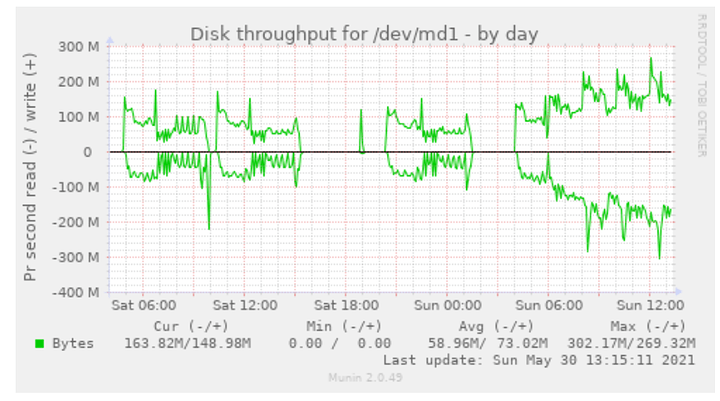
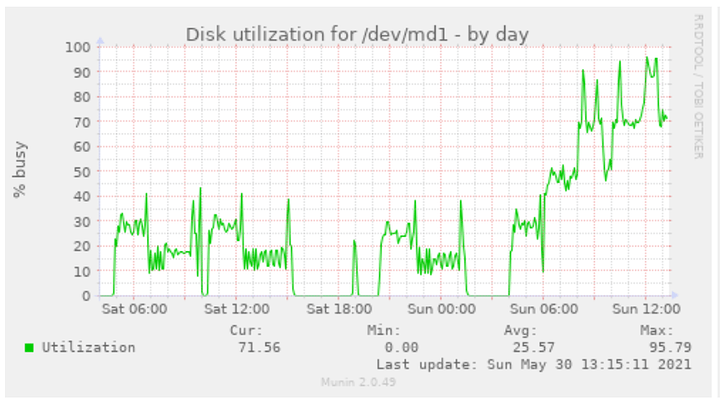
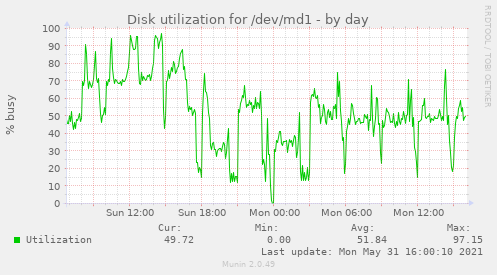
Well I am experimenting with it as I should get at least 42 plots a day with this so this is my latest try to see if it makes it better or worse. I have all nvme formatted as XFS with CRC disabled and mounted with xfs noatime,nodiratime,discard,defaults 0 0
chia_location: /home/chia/chia-blockchain/venv/bin/chia
manager:
  check_interval: 60
  log_level: ERROR
log:
  folder_path: /var/log/chia
view:
  check_interval: 60
  datetime_format: "%Y-%m-%d %H:%M:%S"
  include_seconds_for_phase: false
  include_drive_info: false
  include_cpu: true
  include_ram: true
  include_plot_stats: true
notifications:
  notify_discord: false
  discord_webhook_url: https://discord.com/api/webhooks/0000000000000000/XXXXXXXXXXXXXXXXXXXXXXXXXXXXXXX
  notify_sound: false
  song: audio.mp3
  notify_pushover: false
  pushover_user_key: xx
  pushover_api_key: xx
  notify_twilio: false
  twilio_account_sid: xxxxx
  twilio_auth_token: xxxxx
  twilio_from_phone: +1234657890
  twilio_to_phone: +1234657890
instrumentation:
  prometheus_enabled: false
  prometheus_port: 9090
progress:
  phase1_line_end: 802
  phase2_line_end: 835
  phase3_line_end: 2475
  phase4_line_end: 2621
  phase1_weight: 27.64
  phase2_weight: 26.15
  phase3_weight: 43.21
  phase4_weight: 3.0
global:
  max_concurrent: 48
  max_for_phase_1 : 16
  minimum_minutes_between_jobs: 0

jobs:
  - name: nvme001
    max_plots: 999
    farmer_public_key: <>
    pool_public_key: <>
    temporary_directory: /mnt/datanvme/001
    temporary2_directory:
    destination_directory: /mnt/chia_tmp_dest
    size: 32
    bitfield: true
    threads: 16
    buckets: 128
    memory_buffer: 3390
    max_concurrent: 2
    max_concurrent_with_start_early: 6
    initial_delay_minutes: 0
    stagger_minutes: 65
    max_for_phase_1: 2
    concurrency_start_early_phase: 4
    concurrency_start_early_phase_delay: 0
    temporary2_destination_sync: false
    exclude_final_directory: false
    skip_full_destinations: true
    unix_process_priority: 10
    windows_process_priority: 32
    enable_cpu_affinity: true
    cpu_affinity: [ 0, 1, 2, 3, 4, 5, 6, 7, 8, 9, 10, 11, 12, 13, 14, 15 ]

  - name: nvme002
    max_plots: 999
    farmer_public_key: <>
    pool_public_key: <>
    temporary_directory: /mnt/datanvme/002
    temporary2_directory:
    destination_directory: /mnt/chia_tmp_dest
    size: 32
    bitfield: true
    threads: 16
    buckets: 128
    memory_buffer: 3390
    max_concurrent: 2
    max_concurrent_with_start_early: 6
    initial_delay_minutes: 0
    stagger_minutes: 65
    max_for_phase_1: 2
    concurrency_start_early_phase: 4
    concurrency_start_early_phase_delay: 0
    temporary2_destination_sync: false
    exclude_final_directory: false
    skip_full_destinations: true
    unix_process_priority: 10
    windows_process_priority: 32
    enable_cpu_affinity: true
    cpu_affinity: [ 16, 17, 18, 19, 20, 21, 22, 23, 24, 25, 26, 27, 28, 29, 30, 31 ]

  - name: nvme003
    max_plots: 999
    farmer_public_key: <>
    pool_public_key: <>
    temporary_directory: /mnt/datanvme/003
    temporary2_directory:
    destination_directory: /mnt/chia_tmp_dest
    size: 32
    bitfield: true
    threads: 16
    buckets: 128
    memory_buffer: 3390
    max_concurrent: 2
    max_concurrent_with_start_early: 6
    initial_delay_minutes: 0
    stagger_minutes: 65
    max_for_phase_1: 2
    concurrency_start_early_phase: 4
    concurrency_start_early_phase_delay: 0
    temporary2_destination_sync: false
    exclude_final_directory: false
    skip_full_destinations: true
    unix_process_priority: 10
    windows_process_priority: 32
    enable_cpu_affinity: true
    cpu_affinity: [ 32, 33, 34, 35, 36, 37, 38, 39, 40, 41, 42, 43, 44, 45, 46, 47 ]

  - name: nvme004
    max_plots: 999
    farmer_public_key: <>
    pool_public_key: <>
    temporary_directory: /mnt/datanvme/004
    temporary2_directory:
    destination_directory: /mnt/chia_tmp_dest
    size: 32
    bitfield: true
    threads: 16
    buckets: 128
    memory_buffer: 3390
    max_concurrent: 2
    max_concurrent_with_start_early: 6
    initial_delay_minutes: 0
    stagger_minutes: 65
    max_for_phase_1: 2
    concurrency_start_early_phase: 4
    concurrency_start_early_phase_delay: 0
    temporary2_destination_sync: false
    exclude_final_directory: false
    skip_full_destinations: true
    unix_process_priority: 10
    windows_process_priority: 32
    enable_cpu_affinity: true
    cpu_affinity: [ 48, 49, 50, 51, 52, 53, 54, 55, 56, 57, 58, 59, 60, 61, 62, 63 ]

  - name: nvme005
    max_plots: 999
    farmer_public_key: <>
    pool_public_key: <>
    temporary_directory: /mnt/datanvme/005
    temporary2_directory:
    destination_directory: /mnt/chia_tmp_dest
    size: 32
    bitfield: true
    threads: 16
    buckets: 128
    memory_buffer: 3390
    max_concurrent: 2
    max_concurrent_with_start_early: 6
    initial_delay_minutes: 0
    stagger_minutes: 65
    max_for_phase_1: 2
    concurrency_start_early_phase: 4
    concurrency_start_early_phase_delay: 0
    temporary2_destination_sync: false
    exclude_final_directory: false
    skip_full_destinations: true
    unix_process_priority: 10
    windows_process_priority: 32
    enable_cpu_affinity: true
    cpu_affinity: [ 64, 65, 66, 67, 68, 69, 70, 71, 72, 73, 74, 75, 76, 77, 78, 79 ]

  - name: nvme006
    max_plots: 999
    farmer_public_key: <>
    pool_public_key: <>
    temporary_directory: /mnt/datanvme/006
    temporary2_directory:
    destination_directory: /mnt/chia_tmp_dest
    size: 32
    bitfield: true
    threads: 16
    buckets: 128
    memory_buffer: 3390
    max_concurrent: 2
    max_concurrent_with_start_early: 6
    initial_delay_minutes: 0
    stagger_minutes: 65
    max_for_phase_1: 2
    concurrency_start_early_phase: 4
    concurrency_start_early_phase_delay: 0
    temporary2_destination_sync: false
    exclude_final_directory: false
    skip_full_destinations: true
    unix_process_priority: 10
    windows_process_priority: 32
    enable_cpu_affinity: true
    cpu_affinity: [ 80, 81, 82, 83, 84, 85, 86, 87, 88, 89, 90, 91, 92, 93, 94, 95 ]

  - name: nvme007
    max_plots: 999
    farmer_public_key: <>
    pool_public_key: <>
    temporary_directory: /mnt/datanvme/007
    temporary2_directory:
    destination_directory: /mnt/chia_tmp_dest
    size: 32
    bitfield: true
    threads: 16
    buckets: 128
    memory_buffer: 3390
    max_concurrent: 2
    max_concurrent_with_start_early: 6
    initial_delay_minutes: 0
    stagger_minutes: 65
    max_for_phase_1: 2
    concurrency_start_early_phase: 4
    concurrency_start_early_phase_delay: 0
    temporary2_destination_sync: false
    exclude_final_directory: false
    skip_full_destinations: true
    unix_process_priority: 10
    windows_process_priority: 32
    enable_cpu_affinity: true
    cpu_affinity: [ 96, 97, 98, 99, 100, 101, 102, 103, 104, 105, 106, 107, 108, 109, 110, 111 ]

  - name: nvme008
    max_plots: 999
    farmer_public_key: <>
    pool_public_key: <>
    temporary_directory: /mnt/datanvme/008
    temporary2_directory:
    destination_directory: /mnt/chia_tmp_dest
    size: 32
    bitfield: true
    threads: 16
    buckets: 128
    memory_buffer: 3390
    max_concurrent: 2
    max_concurrent_with_start_early: 6
    initial_delay_minutes: 0
    stagger_minutes: 65
    max_for_phase_1: 2
    concurrency_start_early_phase: 4
    concurrency_start_early_phase_delay: 0
    temporary2_destination_sync: false
    exclude_final_directory: false
    skip_full_destinations: true
    unix_process_priority: 10
    windows_process_priority: 32
    enable_cpu_affinity: true
    cpu_affinity: [ 112, 113, 114, 115, 116, 117, 118, 119, 120, 121, 122, 123, 124, 125, 126, 127 ]
In previous run I got only 28 so I am testing it with less parallel processes as it was taking 24h to complete the plot with all phases while running a lot of them in parallel. This is what I have so far for setup above:
=========================================================================================================================
num     job     k    plot_id    pid           start          elapsed_time   phase   phase_times   progress   temp_size
=========================================================================================================================
1     nvme002   32   c71d717   66236   2021-05-23 18:08:39   03:39:11       2       02:04         47.45%     195 GiB
2     nvme003   32   1893a06   66915   2021-05-23 18:11:46   03:36:04       2       02:09         43.49%     212 GiB
3     nvme004   32   96bc708   66916   2021-05-23 18:11:46   03:36:04       2       02:10         43.49%     212 GiB
4     nvme005   32   aae1409   66917   2021-05-23 18:11:46   03:36:04       2       02:02         45.07%     195 GiB
5     nvme006   32   7f4544d   66918   2021-05-23 18:11:46   03:36:04       2       02:07         45.07%     195 GiB
6     nvme007   32   c7f5e91   66919   2021-05-23 18:11:46   03:36:04       2       02:04         45.07%     195 GiB
7     nvme008   32   fddc525   66920   2021-05-23 18:11:46   03:36:04       2       02:07         45.07%     195 GiB
8     nvme001   32   33915f5   78328   2021-05-23 19:07:50   02:40:00       2       02:33         33.19%     158 GiB
9     nvme002   32   1e80e68   79413   2021-05-23 19:13:50   02:34:00       1                     26.74%     160 GiB
10    nvme003   32   66a7b1b   79987   2021-05-23 19:16:50   02:30:59       1                     25.54%     163 GiB
11    nvme004   32   c21b1c2   79988   2021-05-23 19:16:50   02:30:59       1                     25.50%     163 GiB
12    nvme005   32   3a9e2af   79989   2021-05-23 19:16:50   02:30:59       1                     25.78%     162 GiB
13    nvme006   32   21463ff   79990   2021-05-23 19:16:50   02:30:59       1                     25.88%     162 GiB
14    nvme007   32   0e75ba5   79991   2021-05-23 19:16:50   02:30:59       1                     25.54%     162 GiB
15    nvme008   32   79e2e13   79992   2021-05-23 19:16:50   02:30:59       1                     25.40%     163 GiB
16    nvme001   32   189ef25   91004   2021-05-23 20:12:55   01:34:55       1                     16.89%     162 GiB
=========================================================================================================================
Manager Status: Running

CPU Usage: 19.1%
RAM Usage: 32.29/125.69GiB(26.7%)

Plots Completed Yesterday: 18
Plots Completed Today: 28


