Link speed slower over fiber SFP28 vs cooper SFP+?

Just a few ideas for troubleshooting:

  • Check for Packet Loss on the Interface when sending / receiving Files both on the NAS and Windows side, even though iperf said it was fine

  • Have a look at Reporting → ZFS → Arc Hit Ratio on your NAS when testing File Transfers

  • Check that the MTU on all involved Devices is actually the same. On Windows, the setting in the GUI might not correctly set the value, use “netsh interface ipv4 show subinterfaces” to check

  • Ideally, use much larger files to test transfer speeds since the already misleading results of tests like that with a ZFS File Systems are worse when you’re using smallish files (only a few GB)

I was working on a very similar situation a while ago (TrueNAS Scale Host SMB Shares to Windows SMB Client) and the speeds you’re seeing really are too low.

1 Like

I really wanted to test the NAS itself, so I’m glad to have a way to do it.

I tried using fio, but I got this error:

fio --filename=/mnt/Wolves/Test/fio.tmp --direct=1 --rw=randrw --bs=8k --ioengine=libaio --iodepth=256 --runtime=120 --numjobs=4 --time_based --group_reporting --name=iops-test-job --eta-newline=1
iops-test-job: (g=0): rw=randrw, bs=(R) 8192B-8192B, (W) 8192B-8192B, (T) 8192B-8192B, ioengine=libaio, iodepth=256
...
fio-3.25
Starting 4 processes
iops-test-job: you need to specify size=
fio: pid=0, err=22/file:filesetup.c:1055, func=total_file_size, error=Invalid argument

Am I missing a size= argument? What should it be set to?

You are correct. I saw multichannel enabled once when using Get-SmbMultichannelConnection but after.

TrueNAS doesn’t have a multichannel option, but I’ve read you can enable it via Auxiliary Commands:

But last time I did this, I saw it for a sec, but it wasn’t there again after swapping between Copper, Fiber, and back to Copper.

These are great debugging tips! Glad to hear this isn’t normal. I’ve always experienced slow speeds like this.

To reduce other potential issues, the Windows PC has two PCIe 4.0 4TB Corsair MP600 Pro XT drives. They’ve only been filled up ~15-20% (since I moved all my files to the NAS), and I’ve made sure to TRIM them before testing using Windows Debugger.

ARC hit ratio over the last week:


The MTU is set to 9000 in TrueNAS:

My motherboard has 2 integrated NICs. One has a selection with 4088 and 9014, another had a dropdown going up to 16128. The packet size was, by default, set to 1514 bytes for these two NICs and the Mellanox NICs in Windows.

The Mellanox NICs have a number input that maxes at 9600, and I set them both to 9014 bytes like the other NICs.


In terms of filesize, I’ve been copying the same 10GB file back and forth with 2 different names.


I’ll check for packet loss after work:

netsh interface ipv4 show subinterfaces

I was thinking of checking on the client depending on which connection you are using make sure it is connecting in the same way. if RDMA is available for one interface and not the other it will auto-connect over RDMA as well.

It might just need a setting to enable RDMA or multi channel when you are using one or the other NIC. The windows settings are NIC dependent.

> Get-SmbMultichannelConnection

Server Name    Selected Client IP  Server IP  Client Interface Index Server Interface Index Client RSS Capable Client
                                                                                                               RDMA
                                                                                                               Capable
-----------    -------- ---------  ---------  ---------------------- ---------------------- ------------------ --------
storeman       True     10.1.0.228 10.1.0.6   18                     5                      False              False

Looks like Multi-Channel is enabled on 10Gb Copper, but RDMA is disabled. How do I enable it? Is that supposed to be the default behavior? Does it require a Windows server?

What benefits will I see?

Thanks for this command! Looks like the MTUs are set correctly!

> netsh interface ipv4 show subinterfaces
       MTU  MediaSenseState      Bytes In     Bytes Out  Interface
----------  ---------------  ------------  ------------  -------------
4294967295                1             0        223204  Loopback Pseudo-Interface 1
      1280                1        835266        898342  Tailscale
      1500                5             0             0  Wi-Fi
      9000                5             0             0  Ethernet 1Gb
      1500                5             0             0  Local Area Connection* 1
      9000                5             0             0  Ethernet 2.5Gb
      1500                5             0             0  Local Area Connection* 2
      1500                5             0             0  Bluetooth Network Connection
      9000                1     522260569    2070970145  Mellanox ConnectX-6 1
      9000                1         74465         22065  Mellanox ConnectX-6 2

Just to be clear, I normally don’t have both ConnectX-6 adapters enabled at the same time.

1 Like

I added --size=5GiB, and fio ran. This was done on the 10x4TB drive mirrors zpool rather than the other one because this way, there are less variables:

As another sanity check, Auto TRIM is enabled:
image

# fio --filename=/mnt/Wolves/Test/fio.tmp --direct=1 --rw=randrw --bs=8k --ioengine=libaio --iodepth=256 --runtime=120 --numjobs=4 --time_based --group_reporting --name=iops-test-job --eta-newline=1 --size=5GiB
iops-test-job: (g=0): rw=randrw, bs=(R) 8192B-8192B, (W) 8192B-8192B, (T) 8192B-8192B, ioengine=libaio, iodepth=256
...
fio-3.25
Starting 4 processes
Jobs: 4 (f=4): [m(4)][2.5%][r=315MiB/s,w=315MiB/s][r=40.3k,w=40.4k IOPS][eta 01m:58s]
Jobs: 4 (f=4): [m(4)][4.1%][r=347MiB/s,w=347MiB/s][r=44.4k,w=44.4k IOPS][eta 01m:56s] 
Jobs: 4 (f=4): [m(4)][5.0%][r=277MiB/s,w=273MiB/s][r=35.5k,w=34.0k IOPS][eta 01m:55s]
Jobs: 4 (f=4): [m(4)][5.8%][r=339MiB/s,w=342MiB/s][r=43.5k,w=43.8k IOPS][eta 01m:54s]
Jobs: 4 (f=4): [m(4)][6.6%][r=267MiB/s,w=265MiB/s][r=34.1k,w=33.9k IOPS][eta 01m:53s]
Jobs: 4 (f=4): [m(4)][7.4%][r=317MiB/s,w=318MiB/s][r=40.5k,w=40.7k IOPS][eta 01m:52s]
Jobs: 4 (f=4): [m(4)][8.3%][r=278MiB/s,w=278MiB/s][r=35.6k,w=35.6k IOPS][eta 01m:50s]
Jobs: 4 (f=4): [m(4)][9.2%][r=333MiB/s,w=333MiB/s][r=42.6k,w=42.6k IOPS][eta 01m:49s]
Jobs: 4 (f=4): [m(4)][10.0%][r=258MiB/s,w=258MiB/s][r=32.0k,w=32.0k IOPS][eta 01m:48s]
Jobs: 4 (f=4): [m(4)][11.7%][r=266MiB/s,w=269MiB/s][r=34.0k,w=34.4k IOPS][eta 01m:46s] 
Jobs: 4 (f=4): [m(4)][12.5%][r=283MiB/s,w=284MiB/s][r=36.2k,w=36.3k IOPS][eta 01m:45s]
Jobs: 4 (f=4): [m(4)][13.3%][r=321MiB/s,w=321MiB/s][r=41.1k,w=41.1k IOPS][eta 01m:44s]
Jobs: 4 (f=4): [m(4)][14.2%][r=264MiB/s,w=268MiB/s][r=33.8k,w=34.3k IOPS][eta 01m:43s]
Jobs: 4 (f=4): [m(4)][15.0%][r=302MiB/s,w=302MiB/s][r=38.7k,w=38.7k IOPS][eta 01m:42s]
Jobs: 4 (f=4): [m(4)][15.8%][r=269MiB/s,w=271MiB/s][r=34.5k,w=34.6k IOPS][eta 01m:41s]
Jobs: 4 (f=4): [m(4)][17.5%][r=274MiB/s,w=275MiB/s][r=35.1k,w=35.2k IOPS][eta 01m:39s] 
Jobs: 4 (f=4): [m(4)][18.3%][r=248MiB/s,w=249MiB/s][r=31.8k,w=31.9k IOPS][eta 01m:38s]
Jobs: 4 (f=4): [m(4)][20.0%][r=256MiB/s,w=254MiB/s][r=32.8k,w=32.5k IOPS][eta 01m:36s] 
Jobs: 4 (f=4): [m(4)][21.8%][r=279MiB/s,w=279MiB/s][r=35.8k,w=35.7k IOPS][eta 01m:33s] 
Jobs: 4 (f=4): [m(4)][22.5%][r=313MiB/s,w=314MiB/s][r=40.0k,w=40.2k IOPS][eta 01m:33s]
Jobs: 4 (f=4): [m(4)][23.3%][r=325MiB/s,w=329MiB/s][r=41.6k,w=42.1k IOPS][eta 01m:32s]
Jobs: 4 (f=4): [m(4)][24.2%][r=295MiB/s,w=294MiB/s][r=37.8k,w=37.6k IOPS][eta 01m:31s]
Jobs: 4 (f=4): [m(4)][26.1%][r=355MiB/s,w=351MiB/s][r=45.4k,w=44.0k IOPS][eta 01m:28s] 
Jobs: 4 (f=4): [m(4)][26.7%][r=385MiB/s,w=383MiB/s][r=49.3k,w=48.0k IOPS][eta 01m:28s]
Jobs: 4 (f=4): [m(4)][27.5%][r=359MiB/s,w=357MiB/s][r=45.0k,w=45.7k IOPS][eta 01m:27s]
Jobs: 4 (f=4): [m(4)][28.3%][r=253MiB/s,w=255MiB/s][r=32.3k,w=32.6k IOPS][eta 01m:26s]
Jobs: 4 (f=4): [m(4)][29.2%][r=256MiB/s,w=254MiB/s][r=32.8k,w=32.5k IOPS][eta 01m:25s]
Jobs: 4 (f=4): [m(4)][30.0%][r=279MiB/s,w=280MiB/s][r=35.7k,w=35.8k IOPS][eta 01m:24s]
Jobs: 4 (f=4): [m(4)][31.1%][r=306MiB/s,w=302MiB/s][r=39.2k,w=38.6k IOPS][eta 01m:22s]
Jobs: 4 (f=4): [m(4)][31.7%][r=259MiB/s,w=262MiB/s][r=33.1k,w=33.6k IOPS][eta 01m:22s]
Jobs: 4 (f=4): [m(4)][33.3%][r=290MiB/s,w=288MiB/s][r=37.1k,w=36.8k IOPS][eta 01m:20s] 
Jobs: 4 (f=4): [m(4)][34.2%][r=287MiB/s,w=285MiB/s][r=36.7k,w=36.5k IOPS][eta 01m:19s]
Jobs: 4 (f=4): [m(4)][35.0%][r=254MiB/s,w=254MiB/s][r=32.5k,w=32.6k IOPS][eta 01m:18s]
Jobs: 4 (f=4): [m(4)][36.7%][r=275MiB/s,w=275MiB/s][r=35.2k,w=35.2k IOPS][eta 01m:16s] 
Jobs: 4 (f=4): [m(4)][38.3%][r=253MiB/s,w=250MiB/s][r=32.3k,w=32.0k IOPS][eta 01m:14s] 
Jobs: 4 (f=4): [m(4)][39.2%][r=254MiB/s,w=255MiB/s][r=32.6k,w=32.7k IOPS][eta 01m:13s]
Jobs: 4 (f=4): [m(4)][40.0%][r=272MiB/s,w=273MiB/s][r=34.8k,w=34.9k IOPS][eta 01m:12s]
Jobs: 4 (f=4): [m(4)][40.8%][r=276MiB/s,w=273MiB/s][r=35.3k,w=34.0k IOPS][eta 01m:11s]
Jobs: 4 (f=4): [m(4)][42.5%][r=272MiB/s,w=273MiB/s][r=34.9k,w=34.0k IOPS][eta 01m:09s] 
Jobs: 4 (f=4): [m(4)][43.7%][r=225MiB/s,w=225MiB/s][r=28.8k,w=28.8k IOPS][eta 01m:07s]
Jobs: 4 (f=4): [m(4)][44.2%][r=277MiB/s,w=276MiB/s][r=35.4k,w=35.3k IOPS][eta 01m:07s]
Jobs: 4 (f=4): [m(4)][45.0%][r=278MiB/s,w=278MiB/s][r=35.6k,w=35.6k IOPS][eta 01m:06s]
Jobs: 4 (f=4): [m(4)][45.8%][r=279MiB/s,w=278MiB/s][r=35.7k,w=35.6k IOPS][eta 01m:05s]
Jobs: 4 (f=4): [m(4)][47.5%][r=306MiB/s,w=304MiB/s][r=39.2k,w=38.9k IOPS][eta 01m:03s] 
Jobs: 4 (f=4): [m(4)][48.3%][r=251MiB/s,w=254MiB/s][r=32.1k,w=32.5k IOPS][eta 01m:02s]
Jobs: 4 (f=4): [m(4)][49.2%][r=179MiB/s,w=181MiB/s][r=22.0k,w=23.1k IOPS][eta 01m:01s]
Jobs: 4 (f=4): [m(4)][50.8%][r=257MiB/s,w=259MiB/s][r=32.9k,w=33.2k IOPS][eta 00m:59s] 
Jobs: 4 (f=4): [m(4)][52.1%][r=263MiB/s,w=258MiB/s][r=33.7k,w=33.0k IOPS][eta 00m:57s]
Jobs: 4 (f=4): [m(4)][52.9%][r=270MiB/s,w=271MiB/s][r=34.6k,w=34.7k IOPS][eta 00m:57s]
Jobs: 4 (f=4): [m(4)][53.7%][r=282MiB/s,w=284MiB/s][r=36.1k,w=36.4k IOPS][eta 00m:56s]
Jobs: 4 (f=4): [m(4)][54.5%][r=330MiB/s,w=331MiB/s][r=42.3k,w=42.3k IOPS][eta 00m:55s]
Jobs: 4 (f=4): [m(4)][56.2%][r=392MiB/s,w=394MiB/s][r=50.1k,w=50.5k IOPS][eta 00m:53s] 
Jobs: 4 (f=4): [m(4)][57.9%][r=247MiB/s,w=248MiB/s][r=31.6k,w=31.8k IOPS][eta 00m:51s] 
Jobs: 4 (f=4): [m(4)][59.5%][r=237MiB/s,w=238MiB/s][r=30.4k,w=30.5k IOPS][eta 00m:49s] 
Jobs: 4 (f=4): [m(4)][61.2%][r=226MiB/s,w=224MiB/s][r=28.0k,w=28.7k IOPS][eta 00m:47s] 
Jobs: 4 (f=4): [m(4)][62.5%][r=241MiB/s,w=243MiB/s][r=30.8k,w=31.0k IOPS][eta 00m:45s]
Jobs: 4 (f=4): [m(4)][62.8%][r=238MiB/s,w=238MiB/s][r=30.5k,w=30.5k IOPS][eta 00m:45s]
Jobs: 4 (f=4): [m(4)][63.6%][r=252MiB/s,w=250MiB/s][r=32.3k,w=32.0k IOPS][eta 00m:44s]
Jobs: 4 (f=4): [m(4)][65.0%][r=246MiB/s,w=245MiB/s][r=31.5k,w=31.4k IOPS][eta 00m:42s]
Jobs: 4 (f=4): [m(4)][66.1%][r=188MiB/s,w=188MiB/s][r=24.1k,w=24.1k IOPS][eta 00m:41s] 
Jobs: 4 (f=4): [m(4)][67.8%][r=22.1MiB/s,w=22.7MiB/s][r=2824,w=2901 IOPS][eta 00m:39s] 
Jobs: 4 (f=4): [m(4)][69.4%][r=139MiB/s,w=139MiB/s][r=17.8k,w=17.8k IOPS][eta 00m:37s] 
Jobs: 4 (f=4): [m(4)][70.2%][r=93.9MiB/s,w=92.5MiB/s][r=12.0k,w=11.8k IOPS][eta 00m:36s]
Jobs: 4 (f=4): [m(4)][71.7%][r=264MiB/s,w=262MiB/s][r=33.8k,w=33.5k IOPS][eta 00m:34s]
Jobs: 4 (f=4): [m(4)][72.5%][r=262MiB/s,w=260MiB/s][r=33.5k,w=33.3k IOPS][eta 00m:33s]
Jobs: 4 (f=4): [m(4)][73.3%][r=245MiB/s,w=246MiB/s][r=31.3k,w=31.4k IOPS][eta 00m:32s]
Jobs: 4 (f=4): [m(4)][74.2%][r=248MiB/s,w=246MiB/s][r=31.8k,w=31.4k IOPS][eta 00m:31s]
Jobs: 4 (f=4): [m(4)][75.0%][r=276MiB/s,w=272MiB/s][r=35.3k,w=34.8k IOPS][eta 00m:30s]
Jobs: 4 (f=4): [m(4)][75.8%][r=238MiB/s,w=239MiB/s][r=30.5k,w=30.6k IOPS][eta 00m:29s]
Jobs: 4 (f=4): [m(4)][76.7%][r=250MiB/s,w=247MiB/s][r=32.0k,w=31.6k IOPS][eta 00m:28s]
Jobs: 4 (f=4): [m(4)][77.5%][r=245MiB/s,w=243MiB/s][r=31.3k,w=31.1k IOPS][eta 00m:27s]
Jobs: 4 (f=4): [m(4)][78.3%][r=245MiB/s,w=243MiB/s][r=31.4k,w=31.1k IOPS][eta 00m:26s]
Jobs: 4 (f=4): [m(4)][79.2%][r=242MiB/s,w=242MiB/s][r=30.0k,w=31.0k IOPS][eta 00m:25s]
Jobs: 4 (f=4): [m(4)][80.0%][r=255MiB/s,w=255MiB/s][r=32.6k,w=32.6k IOPS][eta 00m:24s]
Jobs: 4 (f=4): [m(4)][80.8%][r=255MiB/s,w=252MiB/s][r=32.6k,w=32.2k IOPS][eta 00m:23s]
Jobs: 4 (f=4): [m(4)][81.7%][r=261MiB/s,w=259MiB/s][r=33.4k,w=33.1k IOPS][eta 00m:22s]
Jobs: 4 (f=4): [m(4)][82.5%][r=231MiB/s,w=232MiB/s][r=29.6k,w=29.7k IOPS][eta 00m:21s]
Jobs: 4 (f=4): [m(4)][84.2%][r=270MiB/s,w=274MiB/s][r=34.6k,w=35.0k IOPS][eta 00m:19s] 
Jobs: 4 (f=4): [m(4)][85.8%][r=272MiB/s,w=269MiB/s][r=34.8k,w=34.4k IOPS][eta 00m:17s] 
Jobs: 4 (f=4): [m(4)][87.5%][r=79.5MiB/s,w=78.1MiB/s][r=10.2k,w=9997 IOPS][eta 00m:15s]
Jobs: 4 (f=4): [m(4)][89.9%][r=316MiB/s,w=319MiB/s][r=40.4k,w=40.8k IOPS][eta 00m:12s] 
Jobs: 4 (f=4): [m(4)][90.8%][r=423MiB/s,w=423MiB/s][r=54.1k,w=54.2k IOPS][eta 00m:11s] 
Jobs: 4 (f=4): [m(4)][91.7%][r=244MiB/s,w=245MiB/s][r=31.3k,w=31.4k IOPS][eta 00m:10s]
Jobs: 4 (f=4): [m(4)][93.3%][r=105MiB/s,w=105MiB/s][r=13.4k,w=13.4k IOPS][eta 00m:08s] 
Jobs: 4 (f=4): [m(4)][95.0%][r=19.6MiB/s,w=20.2MiB/s][r=2508,w=2587 IOPS][eta 00m:06s] 
Jobs: 4 (f=4): [m(4)][96.7%][r=209MiB/s,w=212MiB/s][r=26.8k,w=27.1k IOPS][eta 00m:04s] 
Jobs: 4 (f=4): [m(4)][97.5%][r=242MiB/s,w=239MiB/s][r=30.9k,w=30.6k IOPS][eta 00m:03s]
Jobs: 4 (f=4): [m(4)][98.3%][r=228MiB/s,w=226MiB/s][r=29.2k,w=28.0k IOPS][eta 00m:02s]
Jobs: 4 (f=4): [m(4)][100.0%][r=244MiB/s,w=243MiB/s][r=31.3k,w=31.1k IOPS][eta 00m:00s]
iops-test-job: (groupid=0, jobs=4): err= 0: pid=3584699: Tue Feb 14 23:57:32 2023
  read: IOPS=32.8k, BW=256MiB/s (269MB/s)(30.0GiB/120001msec)
    slat (usec): min=2, max=174369, avg=26.36, stdev=359.56
    clat (usec): min=3, max=601144, avg=15563.34, stdev=17856.30
     lat (usec): min=41, max=601174, avg=15589.88, stdev=17864.14
    clat percentiles (msec):
     |  1.00th=[    4],  5.00th=[    4], 10.00th=[    5], 20.00th=[    6],
     | 30.00th=[    7], 40.00th=[    9], 50.00th=[   12], 60.00th=[   16],
     | 70.00th=[   18], 80.00th=[   22], 90.00th=[   29], 95.00th=[   36],
     | 99.00th=[   87], 99.50th=[  124], 99.90th=[  218], 99.95th=[  247],
     | 99.99th=[  330]
   bw (  KiB/s): min=16320, max=579184, per=100.00%, avg=262231.26, stdev=25518.87, samples=948
   iops        : min= 2040, max=72398, avg=32778.16, stdev=3189.83, samples=948
  write: IOPS=32.8k, BW=256MiB/s (268MB/s)(29.0GiB/120001msec); 0 zone resets
    slat (usec): min=5, max=492910, avg=90.23, stdev=751.61
    clat (usec): min=3, max=601137, avg=15566.67, stdev=17838.24
     lat (usec): min=145, max=601289, avg=15657.13, stdev=17944.25
    clat percentiles (msec):
     |  1.00th=[    4],  5.00th=[    4], 10.00th=[    5], 20.00th=[    6],
     | 30.00th=[    7], 40.00th=[    9], 50.00th=[   12], 60.00th=[   16],
     | 70.00th=[   18], 80.00th=[   22], 90.00th=[   29], 95.00th=[   36],
     | 99.00th=[   87], 99.50th=[  124], 99.90th=[  218], 99.95th=[  247],
     | 99.99th=[  330]
   bw (  KiB/s): min=15792, max=582944, per=99.99%, avg=262011.22, stdev=25442.28, samples=948
   iops        : min= 1974, max=72868, avg=32750.58, stdev=3180.25, samples=948
  lat (usec)   : 4=0.01%, 10=0.01%, 50=0.01%, 100=0.01%, 250=0.01%
  lat (usec)   : 500=0.01%, 750=0.01%, 1000=0.01%
  lat (msec)   : 2=0.01%, 4=7.66%, 10=36.45%, 20=32.00%, 50=21.50%
  lat (msec)   : 100=1.61%, 250=0.74%, 500=0.04%, 750=0.01%
  cpu          : usr=2.86%, sys=33.05%, ctx=1580534, majf=0, minf=78
  IO depths    : 1=0.1%, 2=0.1%, 4=0.1%, 8=0.1%, 16=0.1%, 32=0.1%, >=64=100.0%
     submit    : 0=0.0%, 4=100.0%, 8=0.0%, 16=0.0%, 32=0.0%, 64=0.0%, >=64=0.0%
     complete  : 0=0.0%, 4=100.0%, 8=0.0%, 16=0.0%, 32=0.0%, 64=0.0%, >=64=0.1%
     issued rwts: total=3933550,3930407,0,0 short=0,0,0,0 dropped=0,0,0,0
     latency   : target=0, window=0, percentile=100.00%, depth=256

Run status group 0 (all jobs):
   READ: bw=256MiB/s (269MB/s), 256MiB/s-256MiB/s (269MB/s-269MB/s), io=30.0GiB (32.2GB), run=120001-120001msec
  WRITE: bw=256MiB/s (268MB/s), 256MiB/s-256MiB/s (268MB/s-268MB/s), io=29.0GiB (32.2GB), run=120001-120001msec

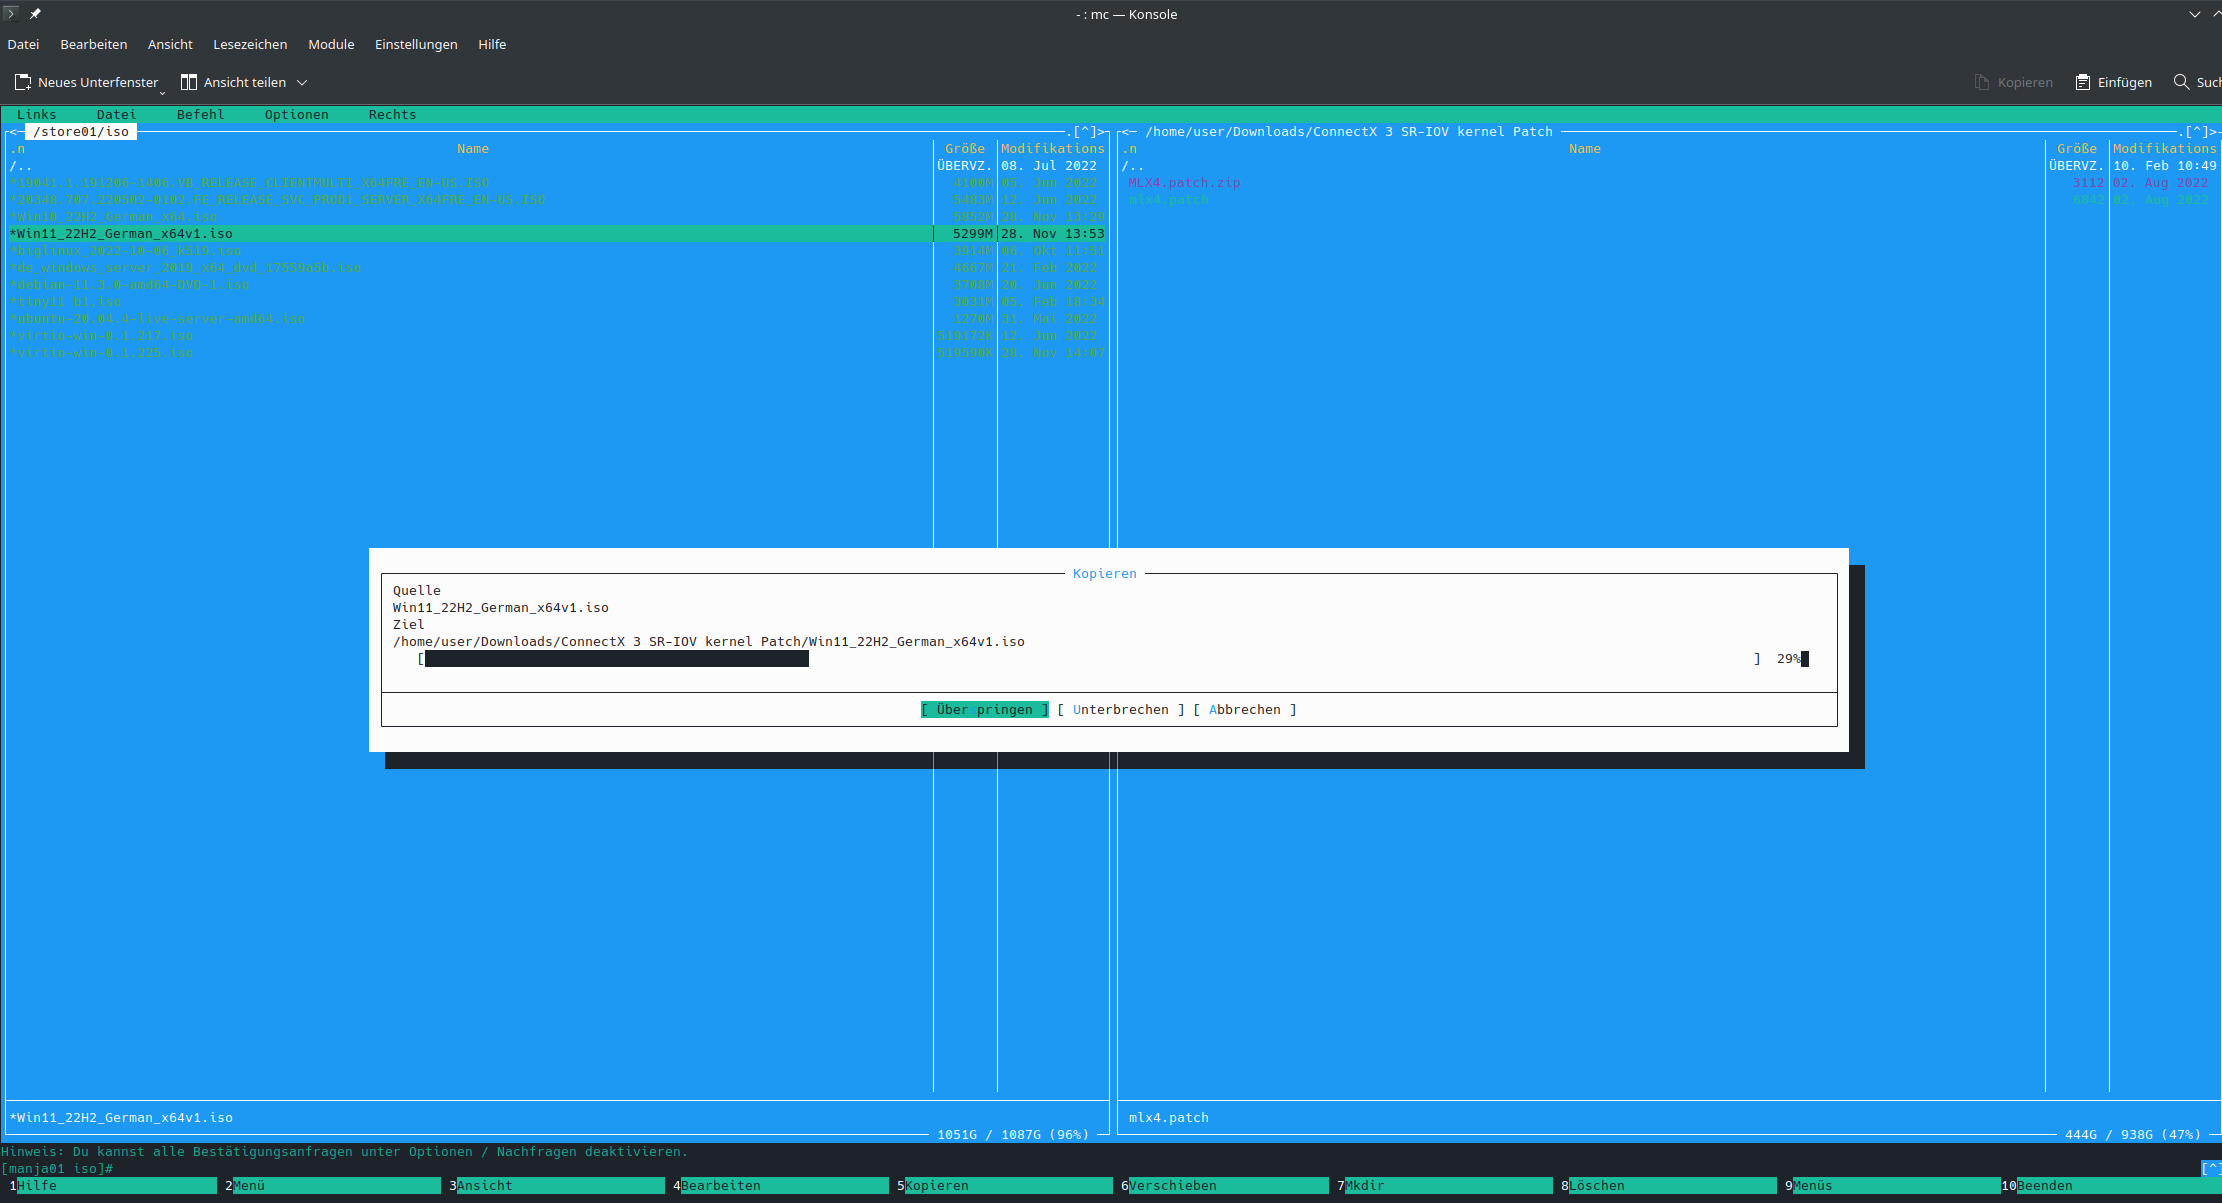
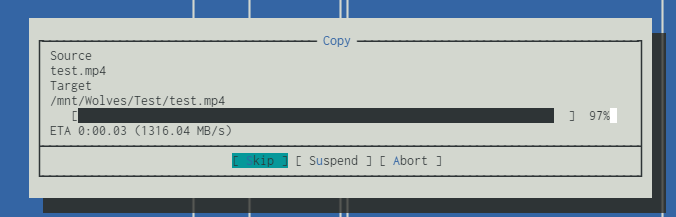
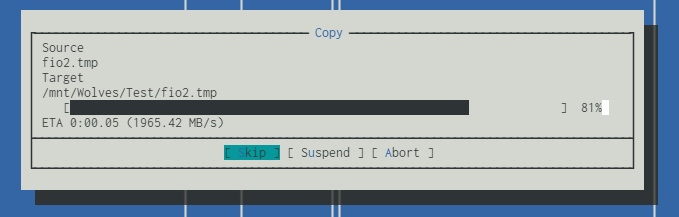
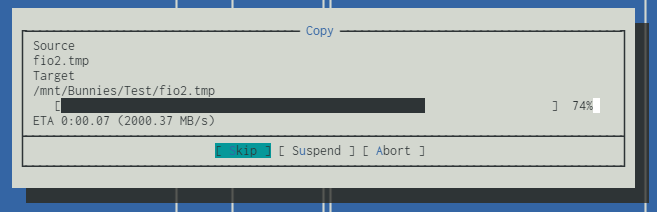
After doing this, I tried another file copy and got the max write speed over 10Gb copper:
image

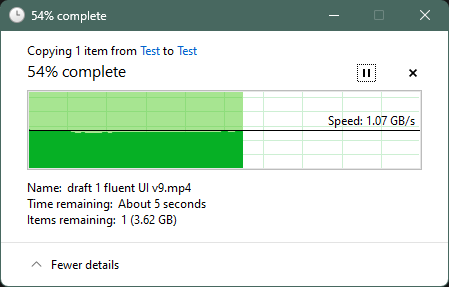
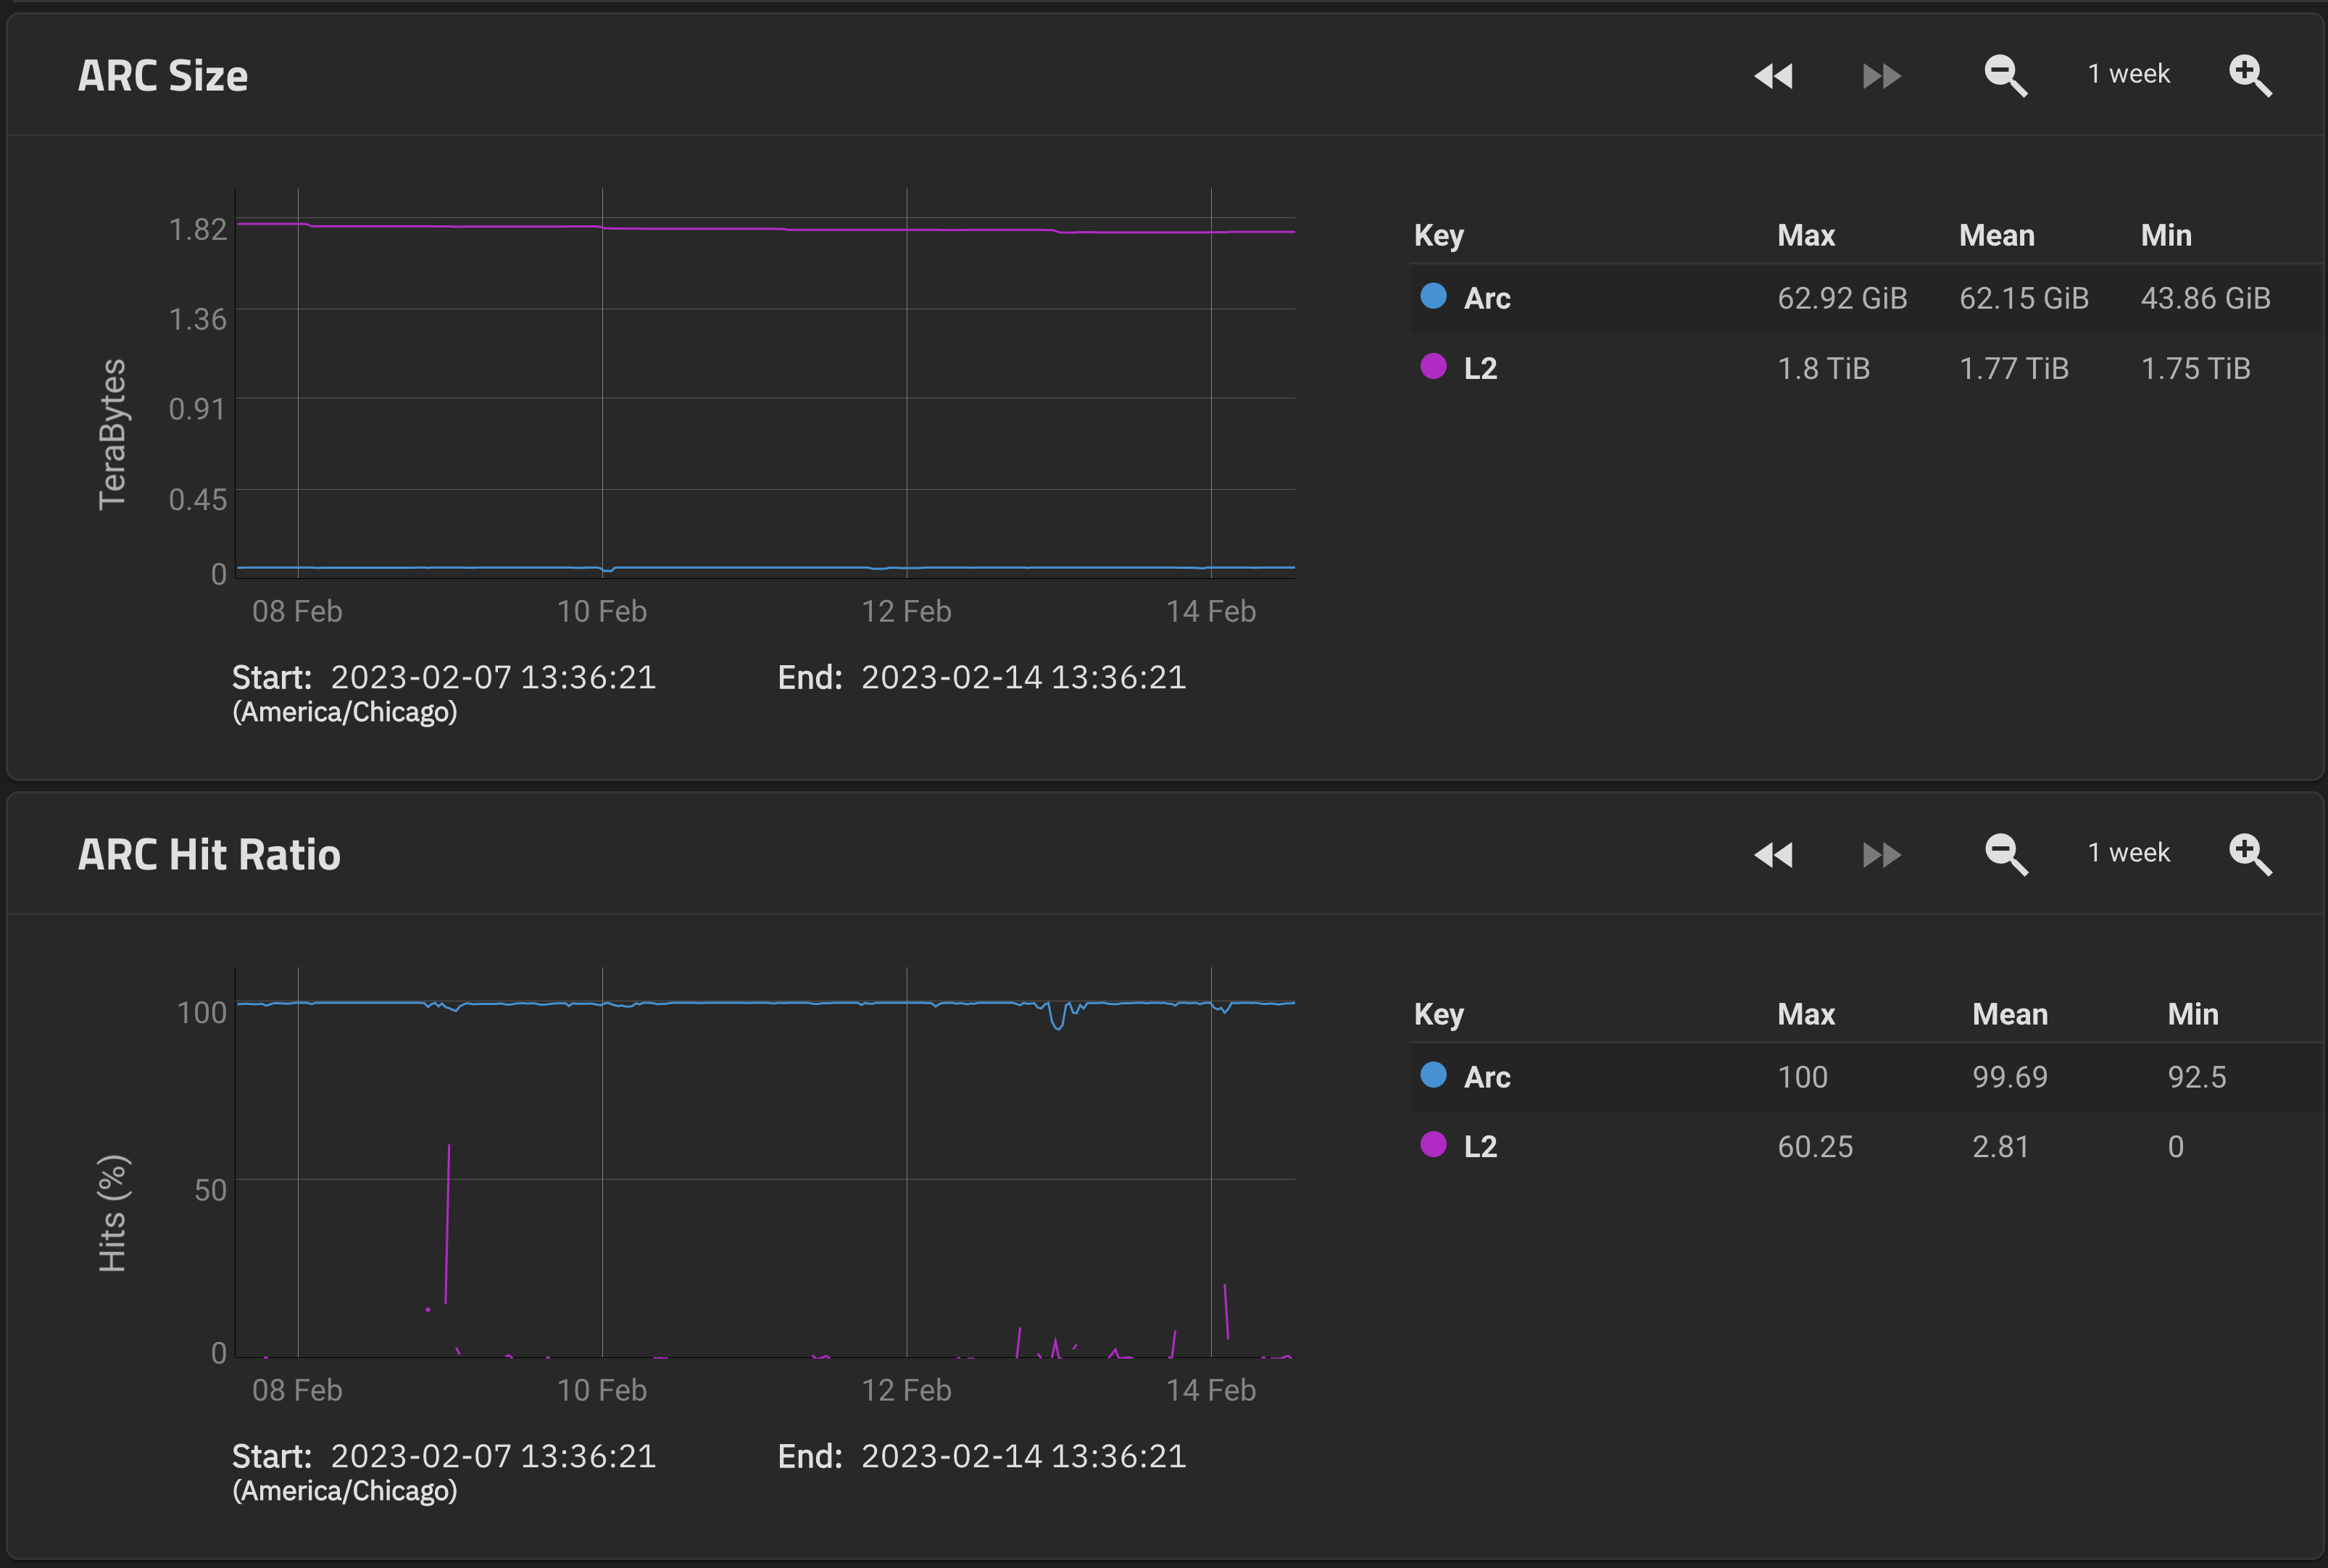
Which means this is probably all writing to Arc right?

But this is a lot higher than what fio was showing. Not sure how to read or understand the fio stats.

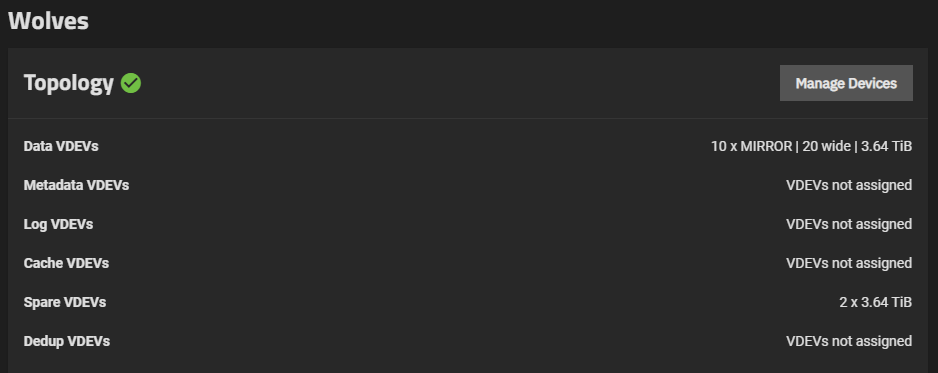
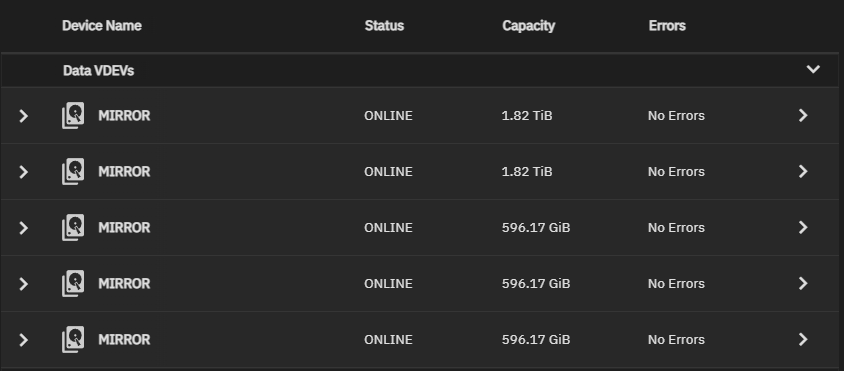
If you understand it, here are my zpool iostat stats on this same pool:

# zpool iostat -v Wolves -l
                                            capacity     operations     bandwidth    total_wait     disk_wait    syncq_wait    asyncq_wait  scrub   trim
pool                                      alloc   free   read  write   read  write   read  write   read  write   read  write   read  write   wait   wait
----------------------------------------  -----  -----  -----  -----  -----  -----  -----  -----  -----  -----  -----  -----  -----  -----  -----  -----
Wolves                                    15.4T  20.9T      0     38  10.6K  4.30M  611us   18ms  597us    1ms  878ns  671ns    4us   17ms   19ms      -
  mirror-0                                2.77T   872G      0      3    985   368K  620us   17ms  618us    1ms  835ns  673ns  983ns   16ms    2ms      -
    5dfaf5ee-a57f-44cb-acf6-b97130bc2ee1      -      -      0      1    492   184K  611us   17ms  608us    1ms  838ns  709ns  982ns   16ms    2ms      -
    2da54a3c-8725-478e-adaf-1a7a53c0890b      -      -      0      1    492   184K  630us   17ms  628us    1ms  831ns  637ns  984ns   16ms    2ms      -
  mirror-1                                2.84T   799G      0      2  1.01K   349K  564us   17ms  563us    1ms  830ns  672ns    1us   16ms      -      -
    2bbaffd9-ac67-4239-b3d7-81046dc4bd24      -      -      0      1    525   175K  578us   17ms  577us    1ms  854ns  715ns    1us   16ms      -      -
    e631eb85-1ab7-40b5-8161-727e8d1a9a3a      -      -      0      1    512   175K  550us   17ms  549us    1ms  807ns  630ns    1us   16ms      -      -
  mirror-2                                2.88T   768G      0      3   1020   350K  631us   17ms  629us    1ms  839ns  681ns    1us   16ms    2ms      -
    f287f68c-2293-4d4b-abde-e6e019faf73b      -      -      0      1    497   175K  643us   17ms  641us    1ms  827ns  728ns  962ns   16ms    2ms      -
    e471104b-c2ab-4e2b-9c7c-14aa187aef32      -      -      0      1    523   175K  619us   17ms  617us    1ms  853ns  634ns    1us   16ms    2ms      -
  mirror-3                                1.23T  2.39T      0      4  1.07K   462K  655us   19ms  632us    1ms    1us  672ns    3us   18ms   19ms      -
    33dcaafb-6eae-4931-8743-20f9b32d44fd      -      -      0      2    579   231K  716us   18ms  683us    1ms  888ns  718ns    3us   17ms   32ms      -
    4fa1a66c-effc-4531-b5c0-8c514293055d      -      -      0      2    516   231K  586us   19ms  576us    1ms    1us  627ns    4us   18ms    7ms      -
  mirror-4                                1.27T  2.36T      0      4  1.11K   477K  655us   17ms  579us    1ms  856ns  675ns    7us   16ms   42ms      -
    d2edc92c-4250-40c4-b382-0beb39ab8d6d      -      -      0      2    586   239K  589us   17ms  554us    1ms  864ns  715ns    5us   16ms   18ms      -
    0da118f2-7df8-42ee-8a94-fa02dcca1b96      -      -      0      2    546   239K  726us   17ms  605us    1ms  847ns  635ns    8us   16ms   68ms      -
  mirror-5                                1.26T  2.37T      0      4  1.09K   480K  553us   16ms  544us    1ms  857ns  667ns    3us   15ms    6ms      -
    11fcc837-6d7c-466e-b2c0-a0d5e8c82fa5      -      -      0      2    568   240K  529us   16ms  519us    1ms  848ns  705ns    4us   15ms    7ms      -
    435d8322-9143-42fe-803b-7b6abbe75baa      -      -      0      2    552   240K  580us   16ms  572us    1ms  866ns  629ns    3us   15ms    5ms      -
  mirror-6                                1.26T  2.36T      0      4  1.08K   478K  563us   17ms  560us    1ms  843ns  665ns    5us   16ms    2ms      -
    dc9cafbd-4c82-4ae0-a3be-b47ed18fa6ac      -      -      0      2    556   239K  562us   17ms  558us    1ms  844ns  708ns    8us   16ms    2ms      -
    3bb29f56-8158-4ac9-8d25-8aff78bd1f7f      -      -      0      2    545   239K  564us   17ms  562us    1ms  842ns  621ns    3us   16ms    2ms      -
  mirror-7                                1.25T  2.37T      0      3  1.09K   456K  580us   18ms  578us    1ms  862ns  663ns    3us   18ms      -      -
    6084d12e-e15c-4f89-8bd6-396bc723fb84      -      -      0      1    551   228K  562us   17ms  561us    1ms  877ns  707ns    2us   16ms      -      -
    72fa67ef-c81d-4b98-a7b7-aa192e1625ea      -      -      0      1    569   228K  597us   20ms  596us    1ms  847ns  618ns    3us   19ms      -      -
  mirror-8                                 320G  3.31T      0      4  1.06K   488K  633us   19ms  629us    1ms  926ns  667ns    6us   18ms    1ms      -
    e8bc4881-36f2-45f3-9795-597ce62e0e05      -      -      0      2    556   244K  601us   19ms  598us    1ms  934ns  706ns    3us   18ms  105us      -
    2b55a8d1-a442-45b8-8431-853ca7b10e9b      -      -      0      2    532   244K  668us   19ms  663us    1ms  918ns  627ns    9us   18ms    4ms      -
  mirror-9                                 310G  3.32T      0      4  1.07K   498K  672us   19ms  668us    1ms  917ns  671ns    8us   19ms      -      -
    0c8790ab-d731-4ae2-8b4d-f134b02929d2      -      -      0      2    559   249K  712us   19ms  709us    1ms  916ns  714ns    6us   19ms      -      -
    ec03bf0d-4168-418f-b83b-7e21e457ca83      -      -      0      2    538   249K  633us   19ms  627us    1ms  917ns  628ns   10us   19ms      -      -
----------------------------------------  -----  -----  -----  -----  -----  -----  -----  -----  -----  -----  -----  -----  -----  -----  -----  -----

your fio results are at least about the level I would expect for your configuration, for an accurate evaluation you need the results from a known functioning system with comparable configuration.
That was random read/write, let’s see what’s going on with sequential read, here the result of a 10 HDD Raidz pool.

  pool: store01
 state: ONLINE
  scan: scrub repaired 0B in 08:44:48 with 0 errors on Sun Feb  5 08:44:50 2023
config:

        NAME                                      STATE     READ WRITE CKSUM
        store01                                   ONLINE       0     0     0
          raidz1-0                                ONLINE       0     0     0
            abee51d9-165b-4365-b6e3-b19ae12618da  ONLINE       0     0     0
            56c07d15-2701-4405-bbc2-c487cbcd6b2b  ONLINE       0     0     0
            d1d9e612-9bc4-4431-8215-7bb254b02ee6  ONLINE       0     0     0
            11fbb178-d98d-44eb-af2c-5d9c7267e0cf  ONLINE       0     0     0
            a8d6c94c-6e8c-407d-a9af-ec4a4b471444  ONLINE       0     0     0
            038df7c2-51fc-4af6-a4a1-a29eccdd6ff6  ONLINE       0     0     0
            e0d51aea-8ea0-40d1-9121-62b1cdb9d275  ONLINE       0     0     0
            c90df55e-3e3f-4a27-815b-16ef5724accb  ONLINE       0     0     0
            dfd6906c-cbd6-4521-a176-75c830742650  ONLINE       0     0     0
            541cbdd8-d142-4bba-b9b4-7eeb7f60172b  ONLINE       0     0     0
        special
          mirror-1                                ONLINE       0     0     0
            212b6594-7ab7-2d40-8ec4-f6d50fabeddf  ONLINE       0     0     0
            57eac33e-f49c-7e4a-adb1-2daa2fb8701c  ONLINE       0     0     0
        cache
          ece2c393-8eaa-8643-b205-1fbb750635ea    ONLINE       0     0     0
root@truenas[~]# fio --filename=/mnt/store01/fio.tmp --direct=1 --rw=read --bs=4k --ioengine=libaio --iodepth=256 --runtime=120 --numjobs=4 --time_based --group_reporting --name=iops-test-job --eta-newline=1 --readonly
iops-test-job: (g=0): rw=read, bs=(R) 4096B-4096B, (W) 4096B-4096B, (T) 4096B-4096B, ioengine=libaio, iodepth=256
...
fio-3.25
Starting 4 processes
Jobs: 4 (f=4): [R(4)][2.5%][r=3456MiB/s][r=885k IOPS][eta 01m:57s]
Jobs: 4 (f=4): [R(4)][4.2%][r=3503MiB/s][r=897k IOPS][eta 01m:55s] 
Jobs: 4 (f=4): [R(4)][5.8%][r=3766MiB/s][r=964k IOPS][eta 01m:53s] 
Jobs: 4 (f=4): [R(4)][7.5%][r=3911MiB/s][r=1001k IOPS][eta 01m:51s]
Jobs: 4 (f=4): [R(4)][9.2%][r=3932MiB/s][r=1007k IOPS][eta 01m:49s] 
Jobs: 4 (f=4): [R(4)][10.9%][r=2370MiB/s][r=607k IOPS][eta 01m:46s] 
Jobs: 4 (f=4): [R(4)][12.5%][r=2534MiB/s][r=649k IOPS][eta 01m:45s] 
Jobs: 4 (f=4): [R(4)][14.2%][r=2346MiB/s][r=601k IOPS][eta 01m:43s] 
Jobs: 4 (f=4): [R(4)][15.8%][r=2338MiB/s][r=599k IOPS][eta 01m:41s] 
Jobs: 4 (f=4): [R(4)][17.5%][r=2448MiB/s][r=627k IOPS][eta 01m:39s] 
Jobs: 4 (f=4): [R(4)][19.2%][r=2343MiB/s][r=600k IOPS][eta 01m:37s] 
Jobs: 4 (f=4): [R(4)][20.8%][r=2349MiB/s][r=601k IOPS][eta 01m:35s] 
Jobs: 4 (f=4): [R(4)][22.5%][r=2347MiB/s][r=601k IOPS][eta 01m:33s] 
Jobs: 4 (f=4): [R(4)][24.2%][r=2361MiB/s][r=604k IOPS][eta 01m:31s] 
Jobs: 4 (f=4): [R(4)][26.1%][r=2374MiB/s][r=608k IOPS][eta 01m:28s] 
Jobs: 4 (f=4): [R(4)][27.5%][r=2334MiB/s][r=597k IOPS][eta 01m:27s] 
Jobs: 4 (f=4): [R(4)][29.2%][r=2361MiB/s][r=604k IOPS][eta 01m:25s] 
Jobs: 4 (f=4): [R(4)][31.1%][r=2361MiB/s][r=604k IOPS][eta 01m:22s] 
Jobs: 4 (f=4): [R(4)][32.8%][r=2365MiB/s][r=605k IOPS][eta 01m:20s] 
Jobs: 4 (f=4): [R(4)][33.9%][r=2519MiB/s][r=645k IOPS][eta 01m:20s]
Jobs: 4 (f=4): [R(4)][35.5%][r=2386MiB/s][r=611k IOPS][eta 01m:18s] 
Jobs: 4 (f=4): [R(4)][37.2%][r=2335MiB/s][r=598k IOPS][eta 01m:16s] 
Jobs: 4 (f=4): [R(4)][38.8%][r=2353MiB/s][r=602k IOPS][eta 01m:14s] 
Jobs: 4 (f=4): [R(4)][40.5%][r=2358MiB/s][r=604k IOPS][eta 01m:12s] 
Jobs: 4 (f=4): [R(4)][42.1%][r=2362MiB/s][r=605k IOPS][eta 01m:10s] 
Jobs: 4 (f=4): [R(4)][44.2%][r=2365MiB/s][r=606k IOPS][eta 01m:07s] 
Jobs: 4 (f=4): [R(4)][45.5%][r=2363MiB/s][r=605k IOPS][eta 01m:06s] 
Jobs: 4 (f=4): [R(4)][47.1%][r=2331MiB/s][r=597k IOPS][eta 01m:04s] 
Jobs: 4 (f=4): [R(4)][48.8%][r=2351MiB/s][r=602k IOPS][eta 01m:02s] 
Jobs: 4 (f=4): [R(4)][50.4%][r=2347MiB/s][r=601k IOPS][eta 01m:00s] 
Jobs: 4 (f=4): [R(4)][52.5%][r=2362MiB/s][r=605k IOPS][eta 00m:57s] 
Jobs: 4 (f=4): [R(4)][53.7%][r=2359MiB/s][r=604k IOPS][eta 00m:56s] 
Jobs: 4 (f=4): [R(4)][55.4%][r=2356MiB/s][r=603k IOPS][eta 00m:54s] 
Jobs: 4 (f=4): [R(4)][57.0%][r=2362MiB/s][r=605k IOPS][eta 00m:52s] 
Jobs: 4 (f=4): [R(4)][58.7%][r=2480MiB/s][r=635k IOPS][eta 00m:50s] 
Jobs: 4 (f=4): [R(4)][60.3%][r=2350MiB/s][r=602k IOPS][eta 00m:48s] 
Jobs: 4 (f=4): [R(4)][62.5%][r=2354MiB/s][r=603k IOPS][eta 00m:45s] 
Jobs: 4 (f=4): [R(4)][63.6%][r=2359MiB/s][r=604k IOPS][eta 00m:44s] 
Jobs: 4 (f=4): [R(4)][65.8%][r=2351MiB/s][r=602k IOPS][eta 00m:41s] 
Jobs: 4 (f=4): [R(4)][66.9%][r=2384MiB/s][r=610k IOPS][eta 00m:40s] 
Jobs: 4 (f=4): [R(4)][68.6%][r=2356MiB/s][r=603k IOPS][eta 00m:38s] 
Jobs: 4 (f=4): [R(4)][70.2%][r=2316MiB/s][r=593k IOPS][eta 00m:36s] 
Jobs: 4 (f=4): [R(4)][71.9%][r=2345MiB/s][r=600k IOPS][eta 00m:34s] 
Jobs: 4 (f=4): [R(4)][73.6%][r=2340MiB/s][r=599k IOPS][eta 00m:32s] 
Jobs: 4 (f=4): [R(4)][75.2%][r=2351MiB/s][r=602k IOPS][eta 00m:30s] 
Jobs: 4 (f=4): [R(4)][76.9%][r=2355MiB/s][r=603k IOPS][eta 00m:28s] 
Jobs: 4 (f=4): [R(4)][78.5%][r=2356MiB/s][r=603k IOPS][eta 00m:26s] 
Jobs: 4 (f=4): [R(4)][80.2%][r=2433MiB/s][r=623k IOPS][eta 00m:24s] 
Jobs: 4 (f=4): [R(4)][81.8%][r=2354MiB/s][r=603k IOPS][eta 00m:22s] 
Jobs: 4 (f=4): [R(4)][83.5%][r=2350MiB/s][r=602k IOPS][eta 00m:20s] 
Jobs: 4 (f=4): [R(4)][85.1%][r=2344MiB/s][r=600k IOPS][eta 00m:18s] 
Jobs: 4 (f=4): [R(4)][87.5%][r=2356MiB/s][r=603k IOPS][eta 00m:15s] 
Jobs: 4 (f=4): [R(4)][88.4%][r=2308MiB/s][r=591k IOPS][eta 00m:14s] 
Jobs: 4 (f=4): [R(4)][90.1%][r=2307MiB/s][r=591k IOPS][eta 00m:12s] 
Jobs: 4 (f=4): [R(4)][91.7%][r=2321MiB/s][r=594k IOPS][eta 00m:10s] 
Jobs: 4 (f=4): [R(4)][93.4%][r=2331MiB/s][r=597k IOPS][eta 00m:08s] 
Jobs: 4 (f=4): [R(4)][95.0%][r=2316MiB/s][r=593k IOPS][eta 00m:06s] 
Jobs: 4 (f=4): [R(4)][96.7%][r=2343MiB/s][r=600k IOPS][eta 00m:04s] 
Jobs: 4 (f=4): [R(4)][98.3%][r=2364MiB/s][r=605k IOPS][eta 00m:02s] 
Jobs: 4 (f=4): [R(4)][100.0%][r=2360MiB/s][r=604k IOPS][eta 00m:00s]
iops-test-job: (groupid=0, jobs=4): err= 0: pid=2553571: Wed Feb 15 08:25:39 2023
  read: IOPS=637k, BW=2489MiB/s (2610MB/s)(292GiB/120001msec)
    slat (nsec): min=1831, max=4232.9k, avg=5725.08, stdev=6292.32
    clat (nsec): min=1767, max=5897.2k, avg=1600579.32, stdev=229077.94
     lat (usec): min=3, max=5903, avg=1606.37, stdev=229.88
    clat percentiles (usec):
     |  1.00th=[  963],  5.00th=[ 1004], 10.00th=[ 1139], 20.00th=[ 1598],
     | 30.00th=[ 1647], 40.00th=[ 1663], 50.00th=[ 1680], 60.00th=[ 1696],
     | 70.00th=[ 1713], 80.00th=[ 1729], 90.00th=[ 1745], 95.00th=[ 1778],
     | 99.00th=[ 1811], 99.50th=[ 1827], 99.90th=[ 1893], 99.95th=[ 2278],
     | 99.99th=[ 2671]
   bw (  MiB/s): min= 2296, max= 4045, per=100.00%, avg=2490.96, stdev=98.59, samples=956
   iops        : min=587880, max=1035658, avg=637685.98, stdev=25240.14, samples=956
  lat (usec)   : 2=0.01%, 4=0.01%, 10=0.01%, 20=0.01%, 50=0.01%
  lat (usec)   : 100=0.01%, 250=0.01%, 500=0.01%, 750=0.01%, 1000=4.47%
  lat (msec)   : 2=95.44%, 4=0.08%, 10=0.01%
  cpu          : usr=8.76%, sys=86.12%, ctx=365067, majf=0, minf=1073
  IO depths    : 1=0.1%, 2=0.1%, 4=0.1%, 8=0.1%, 16=0.1%, 32=0.1%, >=64=100.0%
     submit    : 0=0.0%, 4=100.0%, 8=0.0%, 16=0.0%, 32=0.0%, 64=0.0%, >=64=0.0%
     complete  : 0=0.0%, 4=100.0%, 8=0.0%, 16=0.0%, 32=0.0%, 64=0.0%, >=64=0.1%
     issued rwts: total=76475316,0,0,0 short=0,0,0,0 dropped=0,0,0,0
     latency   : target=0, window=0, percentile=100.00%, depth=256

Run status group 0 (all jobs):
   READ: bw=2489MiB/s (2610MB/s), 2489MiB/s-2489MiB/s (2610MB/s-2610MB/s), io=292GiB (313GB), run=120001-120001msec
1 Like

use mc and copy a >20GB file from one pool to the other pool

1 Like

Just to clarify, ARC acts as a Read Cache.

Over 1GB/s is also what I would expect for a Pool like yours via 10Gbit/s Ethernet.
That Pool Layout is plenty fast to saturate faster connections than 10Gbit/s when it comes to Reading from either Disk or ARC.

I’ve seen mismatched Transfer Speeds with Windows in a very similar setup, but in that case it didn’t have anything to do with the Network Adapter. Same pattern where Write was faster than Read speeds.

It was purely an OS+SMB Limitation in that case and I think your situation is similar.
You don’t have a Linux System on site to test with, making it easier to rule out Networking?

1 Like

yes install Red Hat Enterprise Linux 8.2 on your client, then connect client and server directly without jumbo frames and remove everything that is not default from your samba config to create a baseline.

Check the linktatus of your nics with lspci -vvv

LnkSta: Speed 8GT/s (ok), Width x4 (ok)

Check performance with dd and fio and change one thing at a time based on these results, jumbo frames, Truenas Sysctl, Samba config and LACP

For example dd write from my client via SMB to my NAS

dd if=/dev/zero of=/home/user/smb4k/NAS/backup/testfile1 bs=1G count=50

50+0 Datensätze ein

50+0 Datensätze aus

53687091200 Bytes (54 GB, 50 GiB) kopiert, 27,6718 s, 1,9 GB/s

[user ~]# dd if=/dev/zero of=/home/user/smb4k/NAS/backup/testfile2 bs=1G count=50

50+0 Datensätze ein

50+0 Datensätze aus

53687091200 Bytes (54 GB, 50 GiB) kopiert, 26,7385 s, 2,0 GB/s

NAS without network

root@truenas[~]# dd if=/dev/zero of=/mnt/store01/fio2.tmp bs=1G count=50
50+0 records in
50+0 records out
53687091200 bytes (54 GB, 50 GiB) copied, 17.2807 s, 3.1 GB/s

fio read throughput test


root@truenas[~]# fio --filename=/mnt/store01/fio2.tmp --direct=1 --rw=read --bs=64k --ioengine=libaio --iodepth=64 --runtime=120 --numjobs=4 --time_based --group_reporting --name=throughput-test-job --eta-newline=1 --readonly
throughput-test-job: (g=0): rw=read, bs=(R) 64.0KiB-64.0KiB, (W) 64.0KiB-64.0KiB, (T) 64.0KiB-64.0KiB, ioengine=libaio, iodepth=64
...
fio-3.25
Starting 4 processes
Jobs: 4 (f=4): [R(4)][2.5%][r=6839MiB/s][r=109k IOPS][eta 01m:57s]
Jobs: 4 (f=4): [R(4)][4.2%][r=6721MiB/s][r=108k IOPS][eta 01m:55s] 
Jobs: 4 (f=4): [R(4)][5.8%][r=6133MiB/s][r=98.1k IOPS][eta 01m:53s] 
Jobs: 4 (f=4): [R(4)][7.5%][r=6247MiB/s][r=99.0k IOPS][eta 01m:51s] 
Jobs: 4 (f=4): [R(4)][9.2%][r=6453MiB/s][r=103k IOPS][eta 01m:49s]  
Jobs: 4 (f=4): [R(4)][10.9%][r=6434MiB/s][r=103k IOPS][eta 01m:46s] 
Jobs: 4 (f=4): [R(4)][12.5%][r=6307MiB/s][r=101k IOPS][eta 01m:45s] 
Jobs: 4 (f=4): [R(4)][14.2%][r=6284MiB/s][r=101k IOPS][eta 01m:43s] 
Jobs: 4 (f=4): [R(4)][15.8%][r=6477MiB/s][r=104k IOPS][eta 01m:41s] 
Jobs: 4 (f=4): [R(4)][17.5%][r=6306MiB/s][r=101k IOPS][eta 01m:39s] 
Jobs: 4 (f=4): [R(4)][19.2%][r=6335MiB/s][r=101k IOPS][eta 01m:37s] 
Jobs: 4 (f=4): [R(4)][20.8%][r=6252MiB/s][r=100k IOPS][eta 01m:35s] 
Jobs: 4 (f=4): [R(4)][22.5%][r=6232MiB/s][r=99.7k IOPS][eta 01m:33s]
Jobs: 4 (f=4): [R(4)][24.2%][r=6219MiB/s][r=99.5k IOPS][eta 01m:31s] 
Jobs: 4 (f=4): [R(4)][26.1%][r=6300MiB/s][r=101k IOPS][eta 01m:28s] 
Jobs: 4 (f=4): [R(4)][27.5%][r=6337MiB/s][r=101k IOPS][eta 01m:27s] 
Jobs: 4 (f=4): [R(4)][29.2%][r=6302MiB/s][r=101k IOPS][eta 01m:25s]  
Jobs: 4 (f=4): [R(4)][31.1%][r=6228MiB/s][r=99.7k IOPS][eta 01m:22s]
Jobs: 4 (f=4): [R(4)][32.8%][r=6144MiB/s][r=98.3k IOPS][eta 01m:20s] 
Jobs: 4 (f=4): [R(4)][34.2%][r=6225MiB/s][r=99.6k IOPS][eta 01m:19s]
Jobs: 4 (f=4): [R(4)][35.8%][r=6235MiB/s][r=99.8k IOPS][eta 01m:17s]
Jobs: 4 (f=4): [R(4)][37.5%][r=6319MiB/s][r=101k IOPS][eta 01m:15s] 
Jobs: 4 (f=4): [R(4)][39.2%][r=6213MiB/s][r=99.4k IOPS][eta 01m:13s]
Jobs: 4 (f=4): [R(4)][40.8%][r=6202MiB/s][r=99.2k IOPS][eta 01m:11s]
Jobs: 4 (f=4): [R(4)][42.5%][r=6522MiB/s][r=104k IOPS][eta 01m:09s] 
Jobs: 4 (f=4): [R(4)][44.2%][r=6329MiB/s][r=101k IOPS][eta 01m:07s] 
Jobs: 4 (f=4): [R(4)][45.8%][r=6372MiB/s][r=102k IOPS][eta 01m:05s] 
Jobs: 4 (f=4): [R(4)][47.5%][r=6433MiB/s][r=103k IOPS][eta 01m:03s] 
Jobs: 4 (f=4): [R(4)][49.2%][r=6163MiB/s][r=98.6k IOPS][eta 01m:01s]
Jobs: 4 (f=4): [R(4)][50.8%][r=6553MiB/s][r=105k IOPS][eta 00m:59s] 
Jobs: 4 (f=4): [R(4)][52.5%][r=6365MiB/s][r=102k IOPS][eta 00m:57s] 
Jobs: 4 (f=4): [R(4)][54.2%][r=6440MiB/s][r=103k IOPS][eta 00m:55s] 
Jobs: 4 (f=4): [R(4)][55.8%][r=6346MiB/s][r=102k IOPS][eta 00m:53s] 
Jobs: 4 (f=4): [R(4)][57.5%][r=6640MiB/s][r=106k IOPS][eta 00m:51s] 
Jobs: 4 (f=4): [R(4)][59.2%][r=6553MiB/s][r=105k IOPS][eta 00m:49s] 
Jobs: 4 (f=4): [R(4)][60.8%][r=6510MiB/s][r=104k IOPS][eta 00m:47s] 
Jobs: 4 (f=4): [R(4)][62.5%][r=6374MiB/s][r=102k IOPS][eta 00m:45s] 
Jobs: 4 (f=4): [R(4)][64.7%][r=6450MiB/s][r=103k IOPS][eta 00m:42s] 
Jobs: 4 (f=4): [R(4)][65.8%][r=6525MiB/s][r=104k IOPS][eta 00m:41s] 
Jobs: 4 (f=4): [R(4)][67.5%][r=6459MiB/s][r=103k IOPS][eta 00m:39s] 
Jobs: 4 (f=4): [R(4)][69.2%][r=6590MiB/s][r=105k IOPS][eta 00m:37s] 
Jobs: 4 (f=4): [R(4)][71.4%][r=6461MiB/s][r=103k IOPS][eta 00m:34s] 
Jobs: 4 (f=4): [R(4)][72.5%][r=6457MiB/s][r=103k IOPS][eta 00m:33s] 
Jobs: 4 (f=4): [R(4)][74.2%][r=6259MiB/s][r=100k IOPS][eta 00m:31s] 
Jobs: 4 (f=4): [R(4)][75.8%][r=6565MiB/s][r=105k IOPS][eta 00m:29s]  
Jobs: 4 (f=4): [R(4)][77.5%][r=6128MiB/s][r=98.0k IOPS][eta 00m:27s]
Jobs: 4 (f=4): [R(4)][79.2%][r=5906MiB/s][r=94.5k IOPS][eta 00m:25s] 
Jobs: 4 (f=4): [R(4)][80.8%][r=5823MiB/s][r=93.2k IOPS][eta 00m:23s] 
Jobs: 4 (f=4): [R(4)][82.5%][r=5834MiB/s][r=93.3k IOPS][eta 00m:21s] 
Jobs: 4 (f=4): [R(4)][84.2%][r=6305MiB/s][r=101k IOPS][eta 00m:19s]  
Jobs: 4 (f=4): [R(4)][85.8%][r=6391MiB/s][r=102k IOPS][eta 00m:17s] 
Jobs: 4 (f=4): [R(4)][87.5%][r=6412MiB/s][r=103k IOPS][eta 00m:15s] 
Jobs: 4 (f=4): [R(4)][89.9%][r=5613MiB/s][r=89.8k IOPS][eta 00m:12s]
Jobs: 4 (f=4): [R(4)][90.8%][r=5612MiB/s][r=89.8k IOPS][eta 00m:11s] 
Jobs: 4 (f=4): [R(4)][93.3%][r=6637MiB/s][r=106k IOPS][eta 00m:08s]  
Jobs: 4 (f=4): [R(4)][94.2%][r=6694MiB/s][r=107k IOPS][eta 00m:07s] 
Jobs: 4 (f=4): [R(4)][95.8%][r=6728MiB/s][r=108k IOPS][eta 00m:05s] 
Jobs: 4 (f=4): [R(4)][97.5%][r=6581MiB/s][r=105k IOPS][eta 00m:03s] 
Jobs: 4 (f=4): [R(4)][99.2%][r=6550MiB/s][r=105k IOPS][eta 00m:01s] 
Jobs: 4 (f=4): [R(4)][100.0%][r=6584MiB/s][r=105k IOPS][eta 00m:00s]
throughput-test-job: (groupid=0, jobs=4): err= 0: pid=2807530: Wed Feb 15 10:42:38 2023
  read: IOPS=101k, BW=6322MiB/s (6629MB/s)(741GiB/120001msec)
    slat (usec): min=7, max=4509, avg=38.56, stdev= 7.12
    clat (nsec): min=1482, max=9791.9k, avg=2491581.12, stdev=249827.99
     lat (usec): min=38, max=9832, avg=2530.27, stdev=253.26
    clat percentiles (usec):
     |  1.00th=[ 1893],  5.00th=[ 1958], 10.00th=[ 2114], 20.00th=[ 2343],
     | 30.00th=[ 2442], 40.00th=[ 2474], 50.00th=[ 2540], 60.00th=[ 2573],
     | 70.00th=[ 2606], 80.00th=[ 2671], 90.00th=[ 2737], 95.00th=[ 2802],
     | 99.00th=[ 3163], 99.50th=[ 3261], 99.90th=[ 3523], 99.95th=[ 3621],
     | 99.99th=[ 4293]
   bw (  MiB/s): min= 4776, max= 7461, per=100.00%, avg=6323.75, stdev=87.84, samples=956
   iops        : min=76416, max=119378, avg=101179.98, stdev=1405.42, samples=956
  lat (usec)   : 2=0.01%, 4=0.01%, 50=0.01%, 100=0.01%, 250=0.01%
  lat (usec)   : 500=0.01%, 750=0.01%, 1000=0.01%
  lat (msec)   : 2=6.51%, 4=93.47%, 10=0.02%
  cpu          : usr=2.64%, sys=97.34%, ctx=1514, majf=0, minf=2109
  IO depths    : 1=0.1%, 2=0.1%, 4=0.1%, 8=0.1%, 16=0.1%, 32=0.1%, >=64=100.0%
     submit    : 0=0.0%, 4=100.0%, 8=0.0%, 16=0.0%, 32=0.0%, 64=0.0%, >=64=0.0%
     complete  : 0=0.0%, 4=100.0%, 8=0.0%, 16=0.0%, 32=0.0%, 64=0.1%, >=64=0.0%
     issued rwts: total=12138523,0,0,0 short=0,0,0,0 dropped=0,0,0,0
     latency   : target=0, window=0, percentile=100.00%, depth=64

Run status group 0 (all jobs):
   READ: bw=6322MiB/s (6629MB/s), 6322MiB/s-6322MiB/s (6629MB/s-6629MB/s), io=741GiB (796GB), run=120001-120001msec

if you see something like this, then it is clear that it is your cache

READ: bw=10.9GiB/s (11.7GB/s), 10.9GiB/s-10.9GiB/s (11.7GB/s-11.7GB/s), io=1312GiB (1409GB), run=120002-120002msec

2 Likes

I had to modify your command a bit. It wouldn’t run without --size nor would it run with --readonly, so I changed those.

Same zpool as before, but now testing sequential read speed

This is so disappointing. Your HDDs are way faster than my SSDs. I’m more than upset I’ve been basically getting less performance than I should. Are these Crucial MX500 SSDs really bad or something?

Either way, these numbers are much higher than the 250-600MB/s read speeds I’m getting over SMB using either 10Gb or 25Gb. Could it be that the Mellanox ConnectX-6 card or the transceivers are bad?

# fio --filename=/mnt/Wolves/Test/fio.tmp --direct=1 --rw=read --bs=4k --ioengine=libaio --iodepth=256 --runtime=120 --numjobs=4 --time_based --group_reporting --name=iops-test-job --eta-newline=1 --size=5GiB
iops-test-job: (g=0): rw=read, bs=(R) 4096B-4096B, (W) 4096B-4096B, (T) 4096B-4096B, ioengine=libaio, iodepth=256
...
fio-3.25
Starting 4 processes
iops-test-job: Laying out IO file (1 file / 4768MiB)
Jobs: 4 (f=4): [R(4)][3.3%][r=2254MiB/s][r=577k IOPS][eta 01m:57s]
Jobs: 4 (f=4): [R(4)][5.0%][r=2083MiB/s][r=533k IOPS][eta 01m:55s] 
Jobs: 4 (f=4): [R(4)][6.6%][r=1971MiB/s][r=505k IOPS][eta 01m:53s] 
Jobs: 4 (f=4): [R(4)][8.3%][r=2120MiB/s][r=543k IOPS][eta 01m:51s] 
Jobs: 4 (f=4): [R(4)][9.9%][r=2242MiB/s][r=574k IOPS][eta 01m:49s] 
Jobs: 4 (f=4): [R(4)][11.7%][r=1840MiB/s][r=471k IOPS][eta 01m:46s] 
Jobs: 4 (f=4): [R(4)][13.2%][r=2142MiB/s][r=548k IOPS][eta 01m:45s] 
Jobs: 4 (f=4): [R(4)][14.9%][r=2104MiB/s][r=539k IOPS][eta 01m:43s] 
Jobs: 4 (f=4): [R(4)][16.5%][r=2205MiB/s][r=565k IOPS][eta 01m:41s] 
Jobs: 4 (f=4): [R(4)][18.2%][r=2173MiB/s][r=556k IOPS][eta 01m:39s] 
Jobs: 4 (f=4): [R(4)][19.8%][r=2007MiB/s][r=514k IOPS][eta 01m:37s] 
Jobs: 4 (f=4): [R(4)][21.5%][r=1915MiB/s][r=490k IOPS][eta 01m:35s] 
Jobs: 4 (f=4): [R(4)][23.1%][r=2013MiB/s][r=515k IOPS][eta 01m:33s] 
Jobs: 4 (f=4): [R(4)][24.8%][r=2190MiB/s][r=561k IOPS][eta 01m:31s] 
Jobs: 4 (f=4): [R(4)][26.7%][r=2087MiB/s][r=534k IOPS][eta 01m:28s] 
Jobs: 4 (f=4): [R(4)][28.1%][r=1984MiB/s][r=508k IOPS][eta 01m:27s] 
Jobs: 4 (f=4): [R(4)][29.8%][r=2081MiB/s][r=533k IOPS][eta 01m:25s] 
Jobs: 4 (f=4): [R(4)][31.7%][r=2087MiB/s][r=534k IOPS][eta 01m:22s] 
Jobs: 4 (f=4): [R(4)][33.3%][r=2081MiB/s][r=533k IOPS][eta 01m:20s] 
Jobs: 4 (f=4): [R(4)][34.7%][r=2156MiB/s][r=552k IOPS][eta 01m:19s] 
Jobs: 4 (f=4): [R(4)][36.4%][r=1933MiB/s][r=495k IOPS][eta 01m:17s] 
Jobs: 4 (f=4): [R(4)][38.0%][r=1958MiB/s][r=501k IOPS][eta 01m:15s] 
Jobs: 4 (f=4): [R(4)][39.7%][r=2254MiB/s][r=577k IOPS][eta 01m:13s] 
Jobs: 4 (f=4): [R(4)][41.3%][r=2112MiB/s][r=541k IOPS][eta 01m:11s] 
Jobs: 4 (f=4): [R(4)][43.0%][r=2123MiB/s][r=544k IOPS][eta 01m:09s] 
Jobs: 4 (f=4): [R(4)][44.6%][r=2109MiB/s][r=540k IOPS][eta 01m:07s] 
Jobs: 4 (f=4): [R(4)][46.3%][r=2243MiB/s][r=574k IOPS][eta 01m:05s] 
Jobs: 4 (f=4): [R(4)][47.9%][r=2206MiB/s][r=565k IOPS][eta 01m:03s] 
Jobs: 4 (f=4): [R(4)][49.6%][r=2161MiB/s][r=553k IOPS][eta 01m:01s] 
Jobs: 4 (f=4): [R(4)][51.2%][r=2175MiB/s][r=557k IOPS][eta 00m:59s] 
Jobs: 4 (f=4): [R(4)][52.9%][r=2135MiB/s][r=547k IOPS][eta 00m:57s] 
Jobs: 4 (f=4): [R(4)][54.5%][r=2002MiB/s][r=513k IOPS][eta 00m:55s] 
Jobs: 4 (f=4): [R(4)][56.2%][r=2178MiB/s][r=558k IOPS][eta 00m:53s] 
Jobs: 4 (f=4): [R(4)][57.9%][r=2098MiB/s][r=537k IOPS][eta 00m:51s] 
Jobs: 4 (f=4): [R(4)][59.5%][r=2076MiB/s][r=531k IOPS][eta 00m:49s] 
Jobs: 4 (f=4): [R(4)][61.2%][r=1868MiB/s][r=478k IOPS][eta 00m:47s] 
Jobs: 4 (f=4): [R(4)][62.8%][r=2011MiB/s][r=515k IOPS][eta 00m:45s] 
Jobs: 4 (f=4): [R(4)][65.0%][r=2150MiB/s][r=550k IOPS][eta 00m:42s] 
Jobs: 4 (f=4): [R(4)][66.1%][r=2079MiB/s][r=532k IOPS][eta 00m:41s] 
Jobs: 4 (f=4): [R(4)][67.8%][r=2013MiB/s][r=515k IOPS][eta 00m:39s] 
Jobs: 4 (f=4): [R(4)][69.4%][r=2249MiB/s][r=576k IOPS][eta 00m:37s] 
Jobs: 4 (f=4): [R(4)][71.7%][r=2259MiB/s][r=578k IOPS][eta 00m:34s] 
Jobs: 4 (f=4): [R(4)][72.7%][r=2241MiB/s][r=574k IOPS][eta 00m:33s] 
Jobs: 4 (f=4): [R(4)][74.4%][r=2224MiB/s][r=569k IOPS][eta 00m:31s] 
Jobs: 4 (f=4): [R(4)][76.0%][r=2125MiB/s][r=544k IOPS][eta 00m:29s] 
Jobs: 4 (f=4): [R(4)][77.7%][r=2140MiB/s][r=548k IOPS][eta 00m:27s] 
Jobs: 4 (f=4): [R(4)][79.3%][r=2221MiB/s][r=569k IOPS][eta 00m:25s] 
Jobs: 4 (f=4): [R(4)][81.0%][r=2452MiB/s][r=628k IOPS][eta 00m:23s] 
Jobs: 4 (f=4): [R(4)][82.6%][r=2004MiB/s][r=513k IOPS][eta 00m:21s] 
Jobs: 4 (f=4): [R(4)][84.3%][r=1861MiB/s][r=476k IOPS][eta 00m:19s] 
Jobs: 4 (f=4): [R(4)][86.0%][r=2033MiB/s][r=520k IOPS][eta 00m:17s] 
Jobs: 4 (f=4): [R(4)][87.6%][r=2108MiB/s][r=540k IOPS][eta 00m:15s] 
Jobs: 4 (f=4): [R(4)][90.0%][r=2165MiB/s][r=554k IOPS][eta 00m:12s] 
Jobs: 4 (f=4): [R(4)][90.9%][r=1859MiB/s][r=476k IOPS][eta 00m:11s] 
Jobs: 4 (f=4): [R(4)][93.3%][r=2249MiB/s][r=576k IOPS][eta 00m:08s] 
Jobs: 4 (f=4): [R(4)][94.2%][r=2160MiB/s][r=553k IOPS][eta 00m:07s] 
Jobs: 4 (f=4): [R(4)][95.9%][r=1851MiB/s][r=474k IOPS][eta 00m:05s] 
Jobs: 4 (f=4): [R(4)][97.5%][r=2143MiB/s][r=549k IOPS][eta 00m:03s] 
Jobs: 4 (f=4): [R(4)][99.2%][r=2080MiB/s][r=533k IOPS][eta 00m:01s] 
Jobs: 4 (f=4): [R(4)][100.0%][r=2214MiB/s][r=567k IOPS][eta 00m:00s]
iops-test-job: (groupid=0, jobs=4): err= 0: pid=577499: Wed Feb 15 04:14:47 2023
  read: IOPS=540k, BW=2110MiB/s (2212MB/s)(247GiB/120001msec)
    slat (usec): min=2, max=7527, avg= 6.69, stdev= 3.26
    clat (nsec): min=1910, max=13485k, avg=1888860.42, stdev=297870.13
     lat (usec): min=5, max=13500, avg=1895.62, stdev=299.00
    clat percentiles (usec):
     |  1.00th=[ 1598],  5.00th=[ 1696], 10.00th=[ 1713], 20.00th=[ 1745],
     | 30.00th=[ 1762], 40.00th=[ 1762], 50.00th=[ 1778], 60.00th=[ 1795],
     | 70.00th=[ 1827], 80.00th=[ 1926], 90.00th=[ 2245], 95.00th=[ 2737],
     | 99.00th=[ 2802], 99.50th=[ 2835], 99.90th=[ 2900], 99.95th=[ 3032],
     | 99.99th=[ 3490]
   bw (  MiB/s): min= 1572, max= 2477, per=100.00%, avg=2109.63, stdev=40.38, samples=956
   iops        : min=402626, max=634246, avg=540065.64, stdev=10338.26, samples=956
  lat (usec)   : 2=0.01%, 4=0.01%, 10=0.01%, 20=0.01%, 50=0.01%
  lat (usec)   : 100=0.01%, 250=0.01%, 500=0.01%, 750=0.01%, 1000=0.01%
  lat (msec)   : 2=84.44%, 4=15.54%, 10=0.01%, 20=0.01%
  cpu          : usr=9.17%, sys=90.43%, ctx=144542, majf=0, minf=1080
  IO depths    : 1=0.1%, 2=0.1%, 4=0.1%, 8=0.1%, 16=0.1%, 32=0.1%, >=64=100.0%
     submit    : 0=0.0%, 4=100.0%, 8=0.0%, 16=0.0%, 32=0.0%, 64=0.0%, >=64=0.0%
     complete  : 0=0.0%, 4=100.0%, 8=0.0%, 16=0.0%, 32=0.0%, 64=0.0%, >=64=0.1%
     issued rwts: total=64804664,0,0,0 short=0,0,0,0 dropped=0,0,0,0
     latency   : target=0, window=0, percentile=100.00%, depth=256

Run status group 0 (all jobs):
   READ: bw=2110MiB/s (2212MB/s), 2110MiB/s-2110MiB/s (2212MB/s-2212MB/s), io=247GiB (265GB), run=120001-120001msec

My Offsite NAS with 10x10TB HDDs

I thought my SSDs were bad, so I tested 10 mirrors of 10TB HGST HDDs (HUH721010AL42C0), and they’re slower than yours. What is going on here? Why are your HDDs getting the speeds of my SSDs, and both of my NASs run significantly slower?

Is it that ZFS mirrors aren’t as fast as people say? Looks like your single RAID-Z is plenty fast. Maybe the benchmarks people have put out are completely wrong?

Another thing is this HDD NAS uses 2 SAS expanders, but all these particular drives are on 1 SAS expander with 2 SFF-8643 connectors. That’s meaning 96Gb (12GB/s) total bandwidth and all of that at 8x PCIe 3.0 (8GB/s) using the same LSI 9305 as my main NAS (except my main NAS has 3).

# fio --filename=/mnt/Ducks/Test/fio.tmp --direct=1 --rw=read --bs=4k --ioengine=libaio --iodepth=256 --runtime=120 --numjobs=4 --time_based --group_reporting --name=iops-test-job --eta-newline=1 --size=5GiB
iops-test-job: (g=0): rw=read, bs=(R) 4096B-4096B, (W) 4096B-4096B, (T) 4096B-4096B, ioengine=libaio, iodepth=256
...
fio-3.25
Starting 4 processes
iops-test-job: Laying out IO file (1 file / 4768MiB)
Jobs: 4 (f=4): [R(4)][3.3%][r=622MiB/s][r=159k IOPS][eta 01m:57s]
Jobs: 4 (f=4): [R(4)][5.0%][r=657MiB/s][r=168k IOPS][eta 01m:55s] 
Jobs: 4 (f=4): [R(4)][6.6%][r=640MiB/s][r=164k IOPS][eta 01m:53s] 
Jobs: 4 (f=4): [R(4)][8.3%][r=642MiB/s][r=164k IOPS][eta 01m:51s] 
Jobs: 4 (f=4): [R(4)][9.9%][r=638MiB/s][r=163k IOPS][eta 01m:49s] 
Jobs: 4 (f=4): [R(4)][11.7%][r=639MiB/s][r=164k IOPS][eta 01m:46s] 
Jobs: 4 (f=4): [R(4)][13.2%][r=639MiB/s][r=164k IOPS][eta 01m:45s] 
Jobs: 4 (f=4): [R(4)][14.9%][r=637MiB/s][r=163k IOPS][eta 01m:43s] 
Jobs: 4 (f=4): [R(4)][16.5%][r=640MiB/s][r=164k IOPS][eta 01m:41s] 
Jobs: 4 (f=4): [R(4)][18.2%][r=640MiB/s][r=164k IOPS][eta 01m:39s] 
Jobs: 4 (f=4): [R(4)][19.8%][r=640MiB/s][r=164k IOPS][eta 01m:37s] 
Jobs: 4 (f=4): [R(4)][21.5%][r=642MiB/s][r=164k IOPS][eta 01m:35s] 
Jobs: 4 (f=4): [R(4)][23.1%][r=640MiB/s][r=164k IOPS][eta 01m:33s] 
Jobs: 4 (f=4): [R(4)][24.0%][r=629MiB/s][r=161k IOPS][eta 01m:32s]
Jobs: 4 (f=4): [R(4)][25.6%][r=638MiB/s][r=163k IOPS][eta 01m:30s] 
Jobs: 4 (f=4): [R(4)][26.7%][r=639MiB/s][r=164k IOPS][eta 01m:28s]
Jobs: 4 (f=4): [R(4)][28.1%][r=638MiB/s][r=163k IOPS][eta 01m:27s] 
Jobs: 4 (f=4): [R(4)][29.8%][r=640MiB/s][r=164k IOPS][eta 01m:25s] 
Jobs: 4 (f=4): [R(4)][31.7%][r=641MiB/s][r=164k IOPS][eta 01m:22s] 
Jobs: 4 (f=4): [R(4)][33.3%][r=640MiB/s][r=164k IOPS][eta 01m:20s] 
Jobs: 4 (f=4): [R(4)][34.7%][r=621MiB/s][r=159k IOPS][eta 01m:19s] 
Jobs: 4 (f=4): [R(4)][36.4%][r=638MiB/s][r=163k IOPS][eta 01m:17s] 
Jobs: 4 (f=4): [R(4)][38.0%][r=643MiB/s][r=165k IOPS][eta 01m:15s] 
Jobs: 4 (f=4): [R(4)][39.7%][r=640MiB/s][r=164k IOPS][eta 01m:13s] 
Jobs: 4 (f=4): [R(4)][41.3%][r=641MiB/s][r=164k IOPS][eta 01m:11s] 
Jobs: 4 (f=4): [R(4)][43.0%][r=642MiB/s][r=164k IOPS][eta 01m:09s] 
Jobs: 4 (f=4): [R(4)][44.6%][r=637MiB/s][r=163k IOPS][eta 01m:07s] 
Jobs: 4 (f=4): [R(4)][46.3%][r=638MiB/s][r=163k IOPS][eta 01m:05s] 
Jobs: 4 (f=4): [R(4)][47.9%][r=640MiB/s][r=164k IOPS][eta 01m:03s] 
Jobs: 4 (f=4): [R(4)][49.6%][r=642MiB/s][r=164k IOPS][eta 01m:01s] 
Jobs: 4 (f=4): [R(4)][51.2%][r=639MiB/s][r=164k IOPS][eta 00m:59s] 
Jobs: 4 (f=4): [R(4)][52.9%][r=640MiB/s][r=164k IOPS][eta 00m:57s] 
Jobs: 4 (f=4): [R(4)][54.5%][r=641MiB/s][r=164k IOPS][eta 00m:55s] 
Jobs: 4 (f=4): [R(4)][55.4%][r=610MiB/s][r=156k IOPS][eta 00m:54s]
Jobs: 4 (f=4): [R(4)][57.0%][r=641MiB/s][r=164k IOPS][eta 00m:52s] 
Jobs: 4 (f=4): [R(4)][58.7%][r=637MiB/s][r=163k IOPS][eta 00m:50s] 
Jobs: 4 (f=4): [R(4)][60.3%][r=639MiB/s][r=164k IOPS][eta 00m:48s] 
Jobs: 4 (f=4): [R(4)][62.5%][r=639MiB/s][r=164k IOPS][eta 00m:45s] 
Jobs: 4 (f=4): [R(4)][63.6%][r=640MiB/s][r=164k IOPS][eta 00m:44s] 
Jobs: 4 (f=4): [R(4)][65.8%][r=638MiB/s][r=163k IOPS][eta 00m:41s] 
Jobs: 4 (f=4): [R(4)][66.1%][r=627MiB/s][r=161k IOPS][eta 00m:41s]
Jobs: 4 (f=4): [R(4)][67.8%][r=638MiB/s][r=163k IOPS][eta 00m:39s] 
Jobs: 4 (f=4): [R(4)][69.4%][r=639MiB/s][r=164k IOPS][eta 00m:37s] 
Jobs: 4 (f=4): [R(4)][71.7%][r=641MiB/s][r=164k IOPS][eta 00m:34s] 
Jobs: 4 (f=4): [R(4)][72.7%][r=641MiB/s][r=164k IOPS][eta 00m:33s] 
Jobs: 4 (f=4): [R(4)][74.4%][r=641MiB/s][r=164k IOPS][eta 00m:31s] 
Jobs: 4 (f=4): [R(4)][76.0%][r=634MiB/s][r=162k IOPS][eta 00m:29s] 
Jobs: 4 (f=4): [R(4)][76.9%][r=639MiB/s][r=164k IOPS][eta 00m:28s]
Jobs: 4 (f=4): [R(4)][78.5%][r=636MiB/s][r=163k IOPS][eta 00m:26s] 
Jobs: 4 (f=4): [R(4)][80.2%][r=643MiB/s][r=165k IOPS][eta 00m:24s] 
Jobs: 4 (f=4): [R(4)][81.8%][r=639MiB/s][r=164k IOPS][eta 00m:22s] 
Jobs: 4 (f=4): [R(4)][82.6%][r=640MiB/s][r=164k IOPS][eta 00m:21s]
Jobs: 4 (f=4): [R(4)][84.3%][r=642MiB/s][r=164k IOPS][eta 00m:19s] 
Jobs: 4 (f=4): [R(4)][86.0%][r=641MiB/s][r=164k IOPS][eta 00m:17s] 
Jobs: 4 (f=4): [R(4)][87.5%][r=625MiB/s][r=160k IOPS][eta 00m:15s]
Jobs: 4 (f=4): [R(4)][88.4%][r=641MiB/s][r=164k IOPS][eta 00m:14s] 
Jobs: 4 (f=4): [R(4)][90.1%][r=639MiB/s][r=164k IOPS][eta 00m:12s] 
Jobs: 4 (f=4): [R(4)][91.7%][r=642MiB/s][r=164k IOPS][eta 00m:10s] 
Jobs: 4 (f=4): [R(4)][93.4%][r=641MiB/s][r=164k IOPS][eta 00m:08s] 
Jobs: 4 (f=4): [R(4)][95.0%][r=646MiB/s][r=165k IOPS][eta 00m:06s] 
Jobs: 4 (f=4): [R(4)][96.7%][r=637MiB/s][r=163k IOPS][eta 00m:04s] 
Jobs: 4 (f=4): [R(4)][98.3%][r=638MiB/s][r=163k IOPS][eta 00m:02s] 
Jobs: 4 (f=4): [R(4)][100.0%][r=641MiB/s][r=164k IOPS][eta 00m:00s]
iops-test-job: (groupid=0, jobs=4): err= 0: pid=3819462: Wed Feb 15 04:17:03 2023
  read: IOPS=163k, BW=638MiB/s (669MB/s)(74.8GiB/120001msec)
    slat (usec): min=12, max=16055, avg=19.75, stdev=25.45
    clat (usec): min=8, max=26102, avg=6246.47, stdev=424.73
     lat (usec): min=25, max=26120, avg=6266.74, stdev=425.39
    clat percentiles (usec):
     |  1.00th=[ 5604],  5.00th=[ 6063], 10.00th=[ 6128], 20.00th=[ 6194],
     | 30.00th=[ 6194], 40.00th=[ 6194], 50.00th=[ 6194], 60.00th=[ 6259],
     | 70.00th=[ 6259], 80.00th=[ 6259], 90.00th=[ 6325], 95.00th=[ 6390],
     | 99.00th=[ 7242], 99.50th=[ 8455], 99.90th=[12780], 99.95th=[14091],
     | 99.99th=[17957]
   bw (  KiB/s): min=592695, max=703152, per=100.00%, avg=653709.39, stdev=2280.84, samples=956
   iops        : min=148173, max=175788, avg=163427.27, stdev=570.24, samples=956
  lat (usec)   : 10=0.01%, 20=0.01%, 50=0.01%, 100=0.01%, 250=0.01%
  lat (usec)   : 500=0.01%, 750=0.01%, 1000=0.01%
  lat (msec)   : 2=0.01%, 4=0.01%, 10=99.71%, 20=0.27%, 50=0.01%
  cpu          : usr=19.80%, sys=74.84%, ctx=442350, majf=7, minf=1089
  IO depths    : 1=0.1%, 2=0.1%, 4=0.1%, 8=0.1%, 16=0.1%, 32=0.1%, >=64=100.0%
     submit    : 0=0.0%, 4=100.0%, 8=0.0%, 16=0.0%, 32=0.0%, 64=0.0%, >=64=0.0%
     complete  : 0=0.0%, 4=100.0%, 8=0.0%, 16=0.0%, 32=0.0%, 64=0.0%, >=64=0.1%
     issued rwts: total=19598667,0,0,0 short=0,0,0,0 dropped=0,0,0,0
     latency   : target=0, window=0, percentile=100.00%, depth=256

Run status group 0 (all jobs):
   READ: bw=638MiB/s (669MB/s), 638MiB/s-638MiB/s (669MB/s-669MB/s), io=74.8GiB (80.3GB), run=120001-120001msec

HDD NAS, but 10 year old consumer HDDs

This is a smaller zpool with mismatched consumer HDDs at 5400RPM & 7200RPM. I bought these all over 10 years ago, but the stats are the same as the other 10x10TB HDD array.

I’m including this data for reference since both TrueNAS boxes, while having completely different hardware, are configured similarly with the same LSI 9305 cards.

# fio --filename=/mnt/Swans/Test/fio.tmp --direct=1 --rw=read --bs=4k --ioengine=libaio --iodepth=256 --runtime=120 --numjobs=4 --time_based --group_reporting --name=iops-test-job --eta-newline=1 --size=5GiB
iops-test-job: (g=0): rw=read, bs=(R) 4096B-4096B, (W) 4096B-4096B, (T) 4096B-4096B, ioengine=libaio, iodepth=256
...
fio-3.25
Starting 4 processes
iops-test-job: Laying out IO file (1 file / 4768MiB)
Jobs: 4 (f=4): [R(4)][3.3%][r=637MiB/s][r=163k IOPS][eta 01m:57s]
Jobs: 4 (f=4): [R(4)][5.0%][r=636MiB/s][r=163k IOPS][eta 01m:55s] 
Jobs: 4 (f=4): [R(4)][6.6%][r=637MiB/s][r=163k IOPS][eta 01m:53s] 
Jobs: 4 (f=4): [R(4)][8.3%][r=636MiB/s][r=163k IOPS][eta 01m:51s] 
Jobs: 4 (f=4): [R(4)][9.9%][r=636MiB/s][r=163k IOPS][eta 01m:49s] 
Jobs: 4 (f=4): [R(4)][11.7%][r=636MiB/s][r=163k IOPS][eta 01m:46s] 
Jobs: 4 (f=4): [R(4)][13.2%][r=637MiB/s][r=163k IOPS][eta 01m:45s] 
Jobs: 4 (f=4): [R(4)][14.9%][r=637MiB/s][r=163k IOPS][eta 01m:43s] 
Jobs: 4 (f=4): [R(4)][16.5%][r=635MiB/s][r=162k IOPS][eta 01m:41s] 
Jobs: 4 (f=4): [R(4)][18.2%][r=635MiB/s][r=162k IOPS][eta 01m:39s] 
Jobs: 4 (f=4): [R(4)][19.8%][r=635MiB/s][r=163k IOPS][eta 01m:37s] 
Jobs: 4 (f=4): [R(4)][21.5%][r=637MiB/s][r=163k IOPS][eta 01m:35s] 
Jobs: 4 (f=4): [R(4)][23.1%][r=637MiB/s][r=163k IOPS][eta 01m:33s] 
Jobs: 4 (f=4): [R(4)][24.8%][r=636MiB/s][r=163k IOPS][eta 01m:31s] 
Jobs: 4 (f=4): [R(4)][26.7%][r=641MiB/s][r=164k IOPS][eta 01m:28s] 
Jobs: 4 (f=4): [R(4)][28.1%][r=627MiB/s][r=161k IOPS][eta 01m:27s] 
Jobs: 4 (f=4): [R(4)][29.8%][r=634MiB/s][r=162k IOPS][eta 01m:25s] 
Jobs: 4 (f=4): [R(4)][31.7%][r=638MiB/s][r=163k IOPS][eta 01m:22s] 
Jobs: 4 (f=4): [R(4)][33.3%][r=635MiB/s][r=163k IOPS][eta 01m:20s] 
Jobs: 4 (f=4): [R(4)][34.7%][r=639MiB/s][r=164k IOPS][eta 01m:19s] 
Jobs: 4 (f=4): [R(4)][36.4%][r=637MiB/s][r=163k IOPS][eta 01m:17s] 
Jobs: 4 (f=4): [R(4)][38.0%][r=627MiB/s][r=161k IOPS][eta 01m:15s] 
Jobs: 4 (f=4): [R(4)][39.7%][r=637MiB/s][r=163k IOPS][eta 01m:13s] 
Jobs: 4 (f=4): [R(4)][41.3%][r=635MiB/s][r=163k IOPS][eta 01m:11s] 
Jobs: 4 (f=4): [R(4)][43.0%][r=637MiB/s][r=163k IOPS][eta 01m:09s] 
Jobs: 4 (f=4): [R(4)][44.6%][r=638MiB/s][r=163k IOPS][eta 01m:07s] 
Jobs: 4 (f=4): [R(4)][46.3%][r=637MiB/s][r=163k IOPS][eta 01m:05s] 
Jobs: 4 (f=4): [R(4)][47.9%][r=636MiB/s][r=163k IOPS][eta 01m:03s] 
Jobs: 4 (f=4): [R(4)][49.6%][r=636MiB/s][r=163k IOPS][eta 01m:01s] 
Jobs: 4 (f=4): [R(4)][51.2%][r=635MiB/s][r=163k IOPS][eta 00m:59s] 
Jobs: 4 (f=4): [R(4)][52.9%][r=636MiB/s][r=163k IOPS][eta 00m:57s] 
Jobs: 4 (f=4): [R(4)][54.5%][r=637MiB/s][r=163k IOPS][eta 00m:55s] 
Jobs: 4 (f=4): [R(4)][56.2%][r=632MiB/s][r=162k IOPS][eta 00m:53s] 
Jobs: 4 (f=4): [R(4)][57.9%][r=634MiB/s][r=162k IOPS][eta 00m:51s] 
Jobs: 4 (f=4): [R(4)][59.5%][r=633MiB/s][r=162k IOPS][eta 00m:49s] 
Jobs: 4 (f=4): [R(4)][61.2%][r=637MiB/s][r=163k IOPS][eta 00m:47s] 
Jobs: 4 (f=4): [R(4)][62.8%][r=634MiB/s][r=162k IOPS][eta 00m:45s] 
Jobs: 4 (f=4): [R(4)][65.0%][r=635MiB/s][r=163k IOPS][eta 00m:42s] 
Jobs: 4 (f=4): [R(4)][66.1%][r=631MiB/s][r=162k IOPS][eta 00m:41s] 
Jobs: 4 (f=4): [R(4)][67.8%][r=635MiB/s][r=163k IOPS][eta 00m:39s] 
Jobs: 4 (f=4): [R(4)][69.4%][r=624MiB/s][r=160k IOPS][eta 00m:37s] 
Jobs: 4 (f=4): [R(4)][71.7%][r=634MiB/s][r=162k IOPS][eta 00m:34s] 
Jobs: 4 (f=4): [R(4)][72.7%][r=636MiB/s][r=163k IOPS][eta 00m:33s] 
Jobs: 4 (f=4): [R(4)][74.4%][r=632MiB/s][r=162k IOPS][eta 00m:31s] 
Jobs: 4 (f=4): [R(4)][76.0%][r=634MiB/s][r=162k IOPS][eta 00m:29s] 
Jobs: 4 (f=4): [R(4)][77.7%][r=638MiB/s][r=163k IOPS][eta 00m:27s] 
Jobs: 4 (f=4): [R(4)][79.3%][r=638MiB/s][r=163k IOPS][eta 00m:25s] 
Jobs: 4 (f=4): [R(4)][81.0%][r=636MiB/s][r=163k IOPS][eta 00m:23s] 
Jobs: 4 (f=4): [R(4)][82.6%][r=636MiB/s][r=163k IOPS][eta 00m:21s] 
Jobs: 4 (f=4): [R(4)][84.3%][r=637MiB/s][r=163k IOPS][eta 00m:19s] 
Jobs: 4 (f=4): [R(4)][86.0%][r=638MiB/s][r=163k IOPS][eta 00m:17s] 
Jobs: 4 (f=4): [R(4)][87.6%][r=639MiB/s][r=164k IOPS][eta 00m:15s] 
Jobs: 4 (f=4): [R(4)][88.4%][r=638MiB/s][r=163k IOPS][eta 00m:14s]
Jobs: 4 (f=4): [R(4)][90.1%][r=626MiB/s][r=160k IOPS][eta 00m:12s] 
Jobs: 4 (f=4): [R(4)][91.7%][r=635MiB/s][r=163k IOPS][eta 00m:10s] 
Jobs: 4 (f=4): [R(4)][93.4%][r=636MiB/s][r=163k IOPS][eta 00m:08s] 
Jobs: 4 (f=4): [R(4)][95.0%][r=642MiB/s][r=164k IOPS][eta 00m:06s] 
Jobs: 4 (f=4): [R(4)][96.7%][r=638MiB/s][r=163k IOPS][eta 00m:04s] 
Jobs: 4 (f=4): [R(4)][98.3%][r=638MiB/s][r=163k IOPS][eta 00m:02s] 
Jobs: 4 (f=4): [R(4)][100.0%][r=638MiB/s][r=163k IOPS][eta 00m:00s]
iops-test-job: (groupid=0, jobs=4): err= 0: pid=3880541: Wed Feb 15 04:37:05 2023
  read: IOPS=163k, BW=635MiB/s (666MB/s)(74.4GiB/120001msec)
    slat (usec): min=12, max=16062, avg=19.87, stdev=23.44
    clat (usec): min=8, max=23340, avg=6273.75, stdev=374.62
     lat (usec): min=25, max=23358, avg=6294.14, stdev=375.13
    clat percentiles (usec):
     |  1.00th=[ 5604],  5.00th=[ 6128], 10.00th=[ 6194], 20.00th=[ 6194],
     | 30.00th=[ 6259], 40.00th=[ 6259], 50.00th=[ 6259], 60.00th=[ 6259],
     | 70.00th=[ 6259], 80.00th=[ 6325], 90.00th=[ 6325], 95.00th=[ 6390],
     | 99.00th=[ 6980], 99.50th=[ 7963], 99.90th=[11863], 99.95th=[13829],
     | 99.99th=[18220]
   bw (  KiB/s): min=608190, max=667608, per=100.00%, avg=650822.27, stdev=1612.39, samples=956
   iops        : min=152047, max=166902, avg=162705.24, stdev=403.08, samples=956
  lat (usec)   : 10=0.01%, 20=0.01%, 50=0.01%, 100=0.01%, 250=0.01%
  lat (usec)   : 500=0.01%, 750=0.01%, 1000=0.01%
  lat (msec)   : 2=0.01%, 4=0.01%, 10=99.80%, 20=0.18%, 50=0.01%
  cpu          : usr=20.01%, sys=74.64%, ctx=446411, majf=0, minf=1080
  IO depths    : 1=0.1%, 2=0.1%, 4=0.1%, 8=0.1%, 16=0.1%, 32=0.1%, >=64=100.0%
     submit    : 0=0.0%, 4=100.0%, 8=0.0%, 16=0.0%, 32=0.0%, 64=0.0%, >=64=0.0%
     complete  : 0=0.0%, 4=100.0%, 8=0.0%, 16=0.0%, 32=0.0%, 64=0.0%, >=64=0.1%
     issued rwts: total=19514010,0,0,0 short=0,0,0,0 dropped=0,0,0,0
     latency   : target=0, window=0, percentile=100.00%, depth=256

Run status group 0 (all jobs):
   READ: bw=635MiB/s (666MB/s), 635MiB/s-635MiB/s (666MB/s-666MB/s), io=74.4GiB (79.9GB), run=120001-120001msec

Notes

I’ve always had poor ZFS performance. I thought this was normal and that maybe my systems were too slow. Spending over $20K on my latest NAS though, I’m more than unimpressed.

I’m surprised you guys are getting such great stats. Seems like magic to me.

I’ve never used mc before. I looked up the man page, and there are a bunch of options. Do you have a preferred set of commands you use for testing pool-to-pool transfer speeds?

mc=midnight commander, copy with f5

1 Like

I’d prefer to not touch the OS in any of my gaming rigs. I could build another rig, but I’ve lent all my spare high-end desktop gear to my many-years-younger cousin for his gaming rigs.


All 3 LSI cards show this:

LnkSta:	Speed 8GT/s (ok), Width x8 (ok)

The two on-board Broadcom BCM57416 NICs show:

LnkCap:	Port #0, Speed 8GT/s, Width x8, ASPM not supported
LnkSta:	Speed 8GT/s (ok), Width x4 (downgraded)

Not sure what that means, but since iperf3 can do the max-bandwidth, I’m assuming this is fine. It says 8GT/s which means PCIe 3.0 and at x4 is ~32Gb of bandwidth per adapter. That should be more than enough for 10Gb Ethernet.


SSD NAS

# dd if=/dev/zero of=/mnt/Wolves/Test/fio2.tmp bs=1G count=50
50+0 records in
50+0 records out
53687091200 bytes (54 GB, 50 GiB) copied, 24.9237 s, 2.2 GB/s

HDD NAS

# dd if=/dev/zero of=/mnt/Ducks/Test/fio2.tmp bs=1G count=50
50+0 records in
50+0 records out
53687091200 bytes (54 GB, 50 GiB) copied, 60.1481 s, 893 MB/s

What did you mean about “if I see numbers like these, it’s the cache”? You mean if my read speeds are much faster, then it’s the cache? It would make sense then that it’s the cache because these read speeds, while slower than yours, are much faster than the link speed.

But the cache would be my RAM. This zpool I’ve been testing on doesn’t have Optane cache drives like the other one. To be clear, both SSD zpools had the same SMB performance**.

The only thing they have in common is the RAM. How should I test it?

no, I have 256GB RAM, the result with 11.7GB/s was from ARC.
Once you have read the file once, you have to create a new one, otherwise the file will come out of the cache

1 Like

Wolves is the zpool we’ve been testing. Bunnies is the other one with Optane cache, log, and metadata drives. The only difference between them is Wolves uses 4TB SSDs and Bunnies uses 2TB SSDs (17 mirrors).

It seems like the whole system is topping out at 2GB/s read and write speeds.

Bunnies ↔️ Wolves

10GB file

image

50GB file

image

Wolves ↔️ Bunnies

10GB file

50GB file

image

CPU stats during these transfers

no mirror should be far better, Raidz is a compromise, I have 60TB of data, Raid10 makes no sense for me at home

1 Like

something is wrong with your system, I get 3.1GB/s write with normal HDDs in Raidz.
Thing is, if just one SSD has issues the whole pool suffers in regards to performance.

Thing about it, I have only a 2660v3 CPU, almost 10 years old, with 10 HDDs.

Have you checked your logs?
journalctl -r | grep -i error

1 Like