Link speed slower over fiber SFP28 vs cooper SFP+?

I’m having performance problems with my 25Gb fiber SFP28 modules where 10Gb copper Ethernet is faster.

SKIP TO Link speed slower over fiber SFP28 vs cooper SFP+? - #121 by Sawtaytoes. The current situation is the same with the SAME EXACT ISSUE, but the way I present it is better.

Hardware

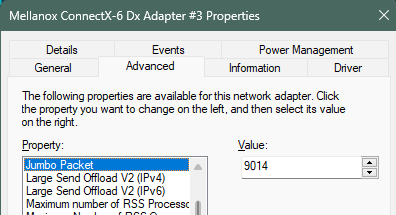
I have a UniFi USW-Pro-Aggregation switch and a Mellanox ConnectX-6 NIC on my PC connected on a PCIe 4.0 x4 slot. My ConnectX-6 has two SFP28 ports.

Since I have no other 25Gb devices, I’m testing everything to my NAS with its 2x10Gb adapters in LACP mode (meaning I’m limited to a max of 10Gb per connection).

Testing

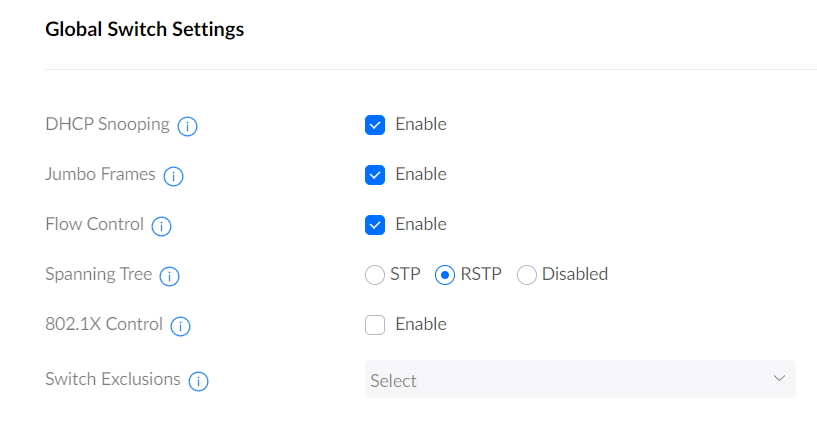
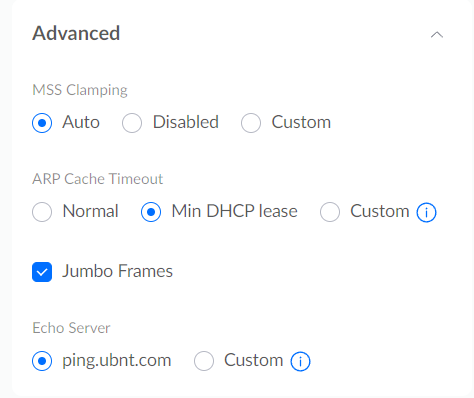
NOTE: I tried Jumbo Frames but had connection issues, so I might need to enable it at the switch level in UniFi.

I tested my NIC with both an SFP28 fiber transceiver and an SFP+ 10Gb copper module.

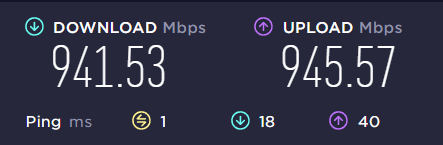
iperf3 was showing the same 10Gb max on both transceivers. This is good.

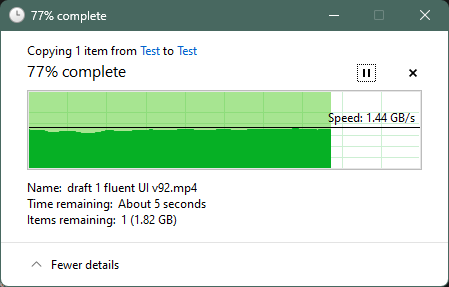
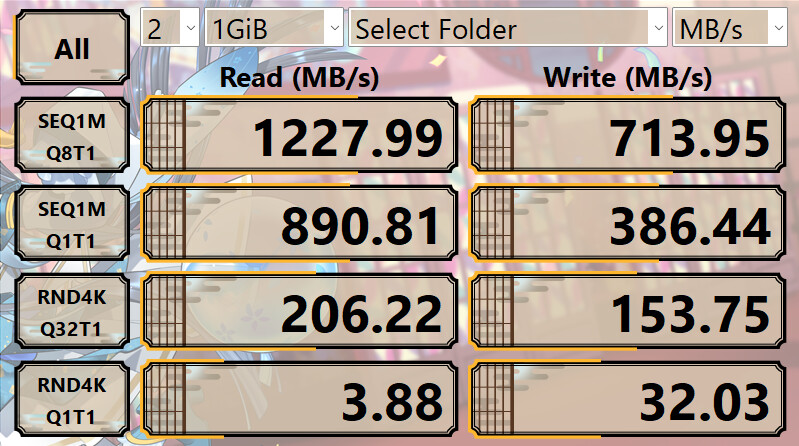
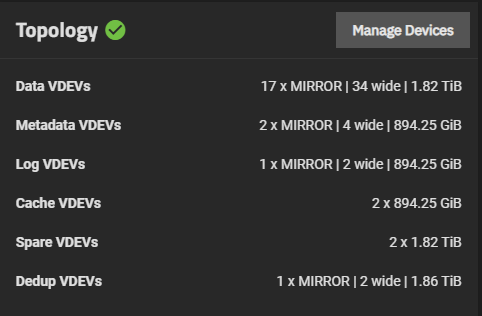
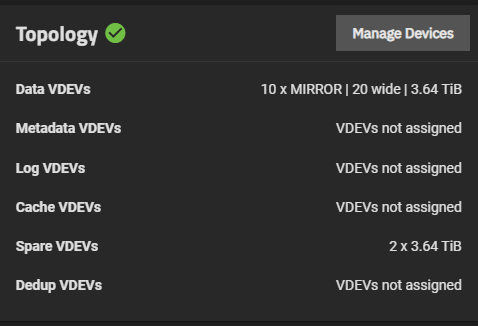
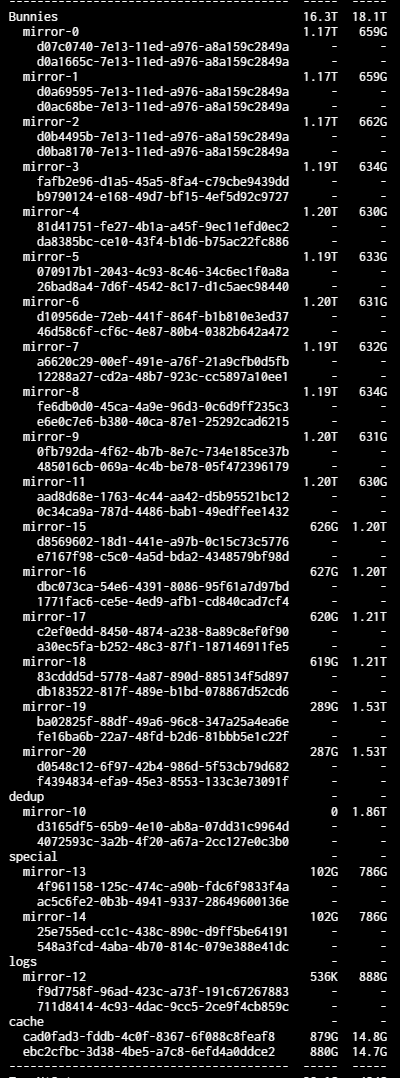
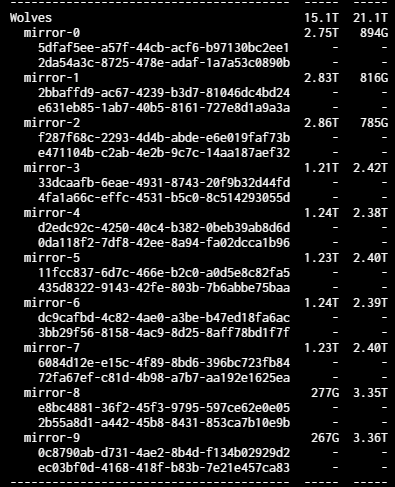
When using SMB though, I noticed some awfully strange results. My NAS is running TrueNAS SCALE and is made up of all SSDs with 60 SSDs spread between two zpools. I should theoretically be able to get some pretty high speeds, but that hasn’t been my experience device-to-device. It maxes out around 700-800MB/s.

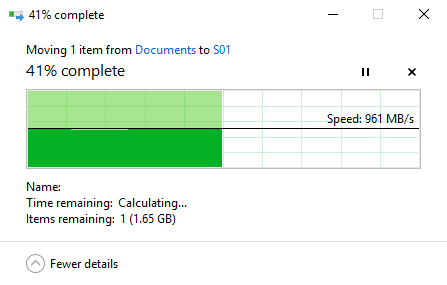
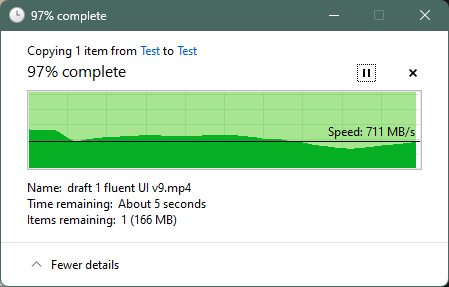
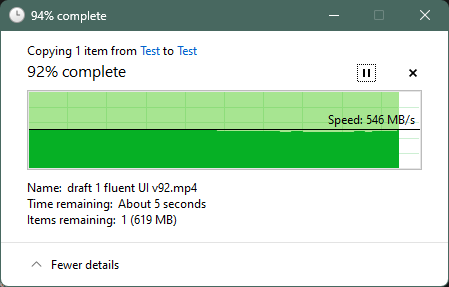
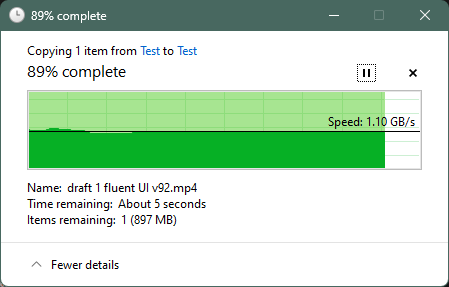
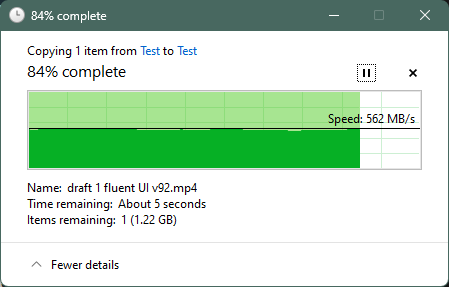
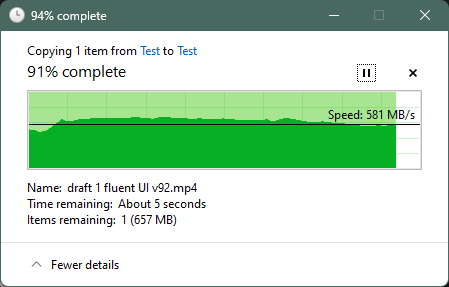
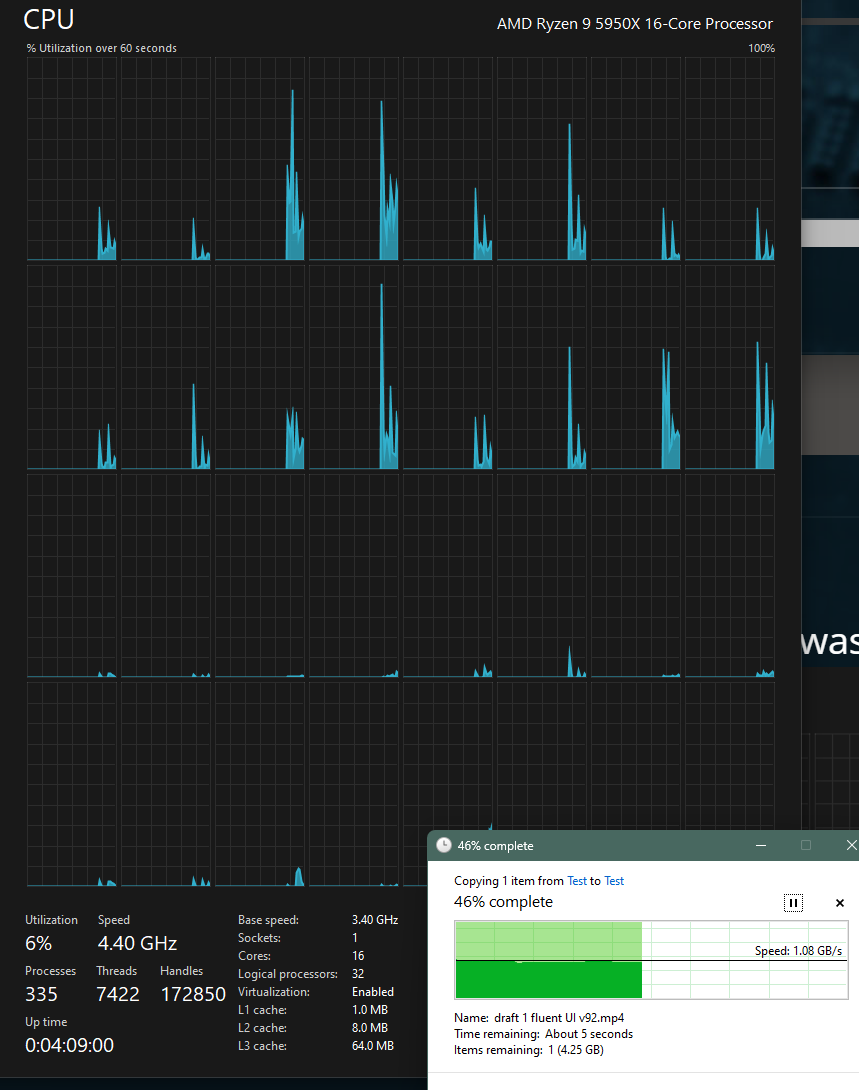
When transferring over 10Gb copper Ethernet, my speeds are ~600/1100MB/s read and write. Why is the write speed so much faster? Beats me. That’s typically much slower.

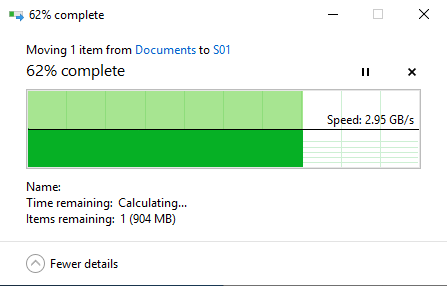
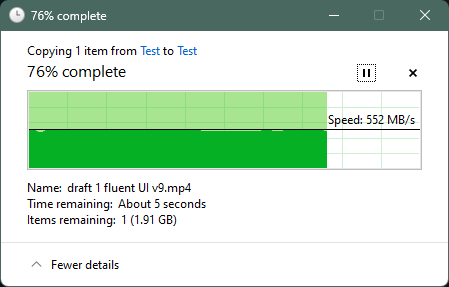
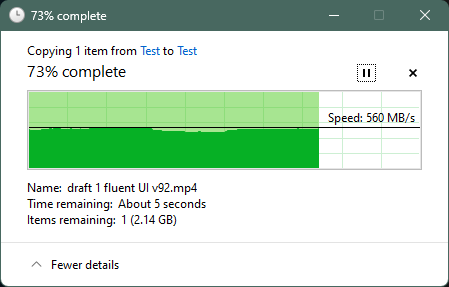
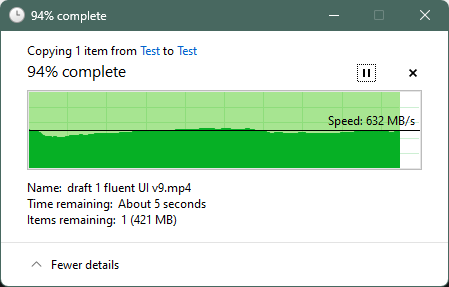
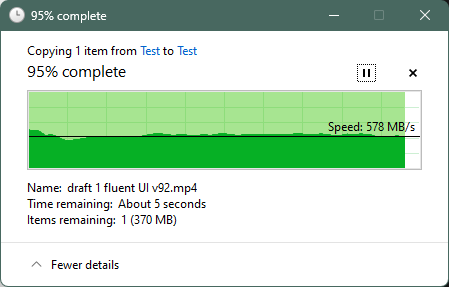
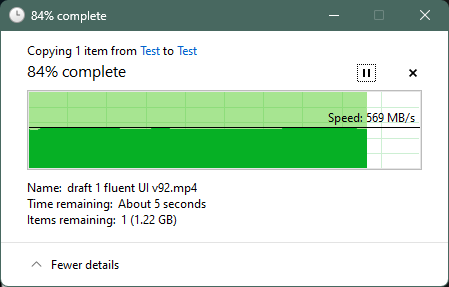
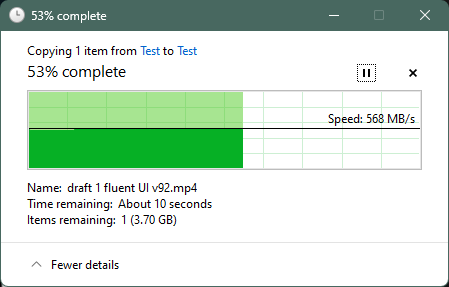
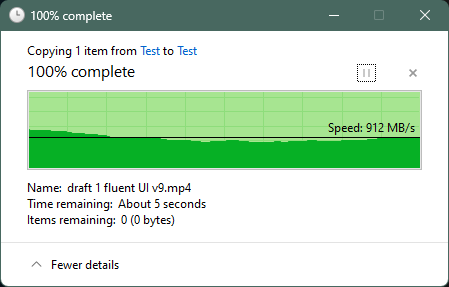
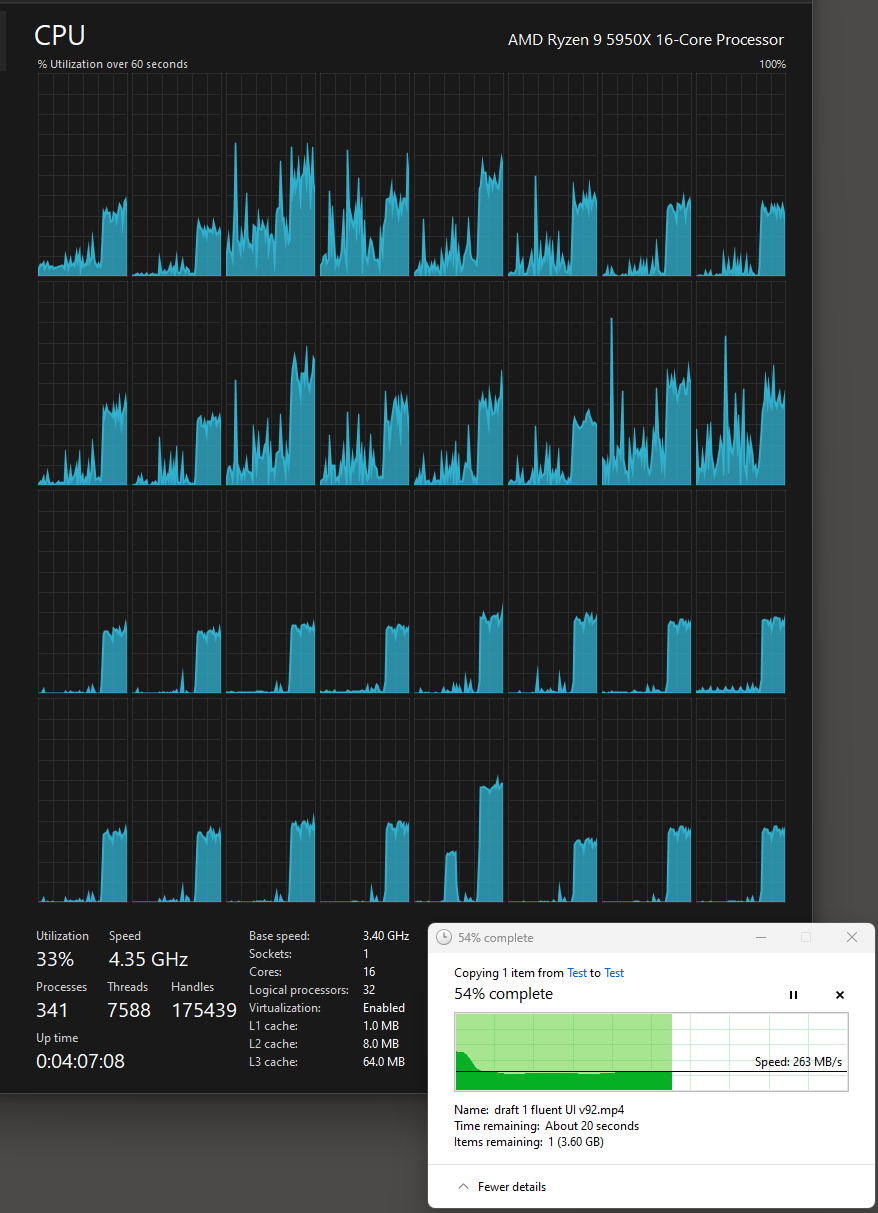
Using the 25Gb SFP28 module with fiber that I ran last night, I’m getting ~600/600MB/s read and write.

This makes me think something’s wrong:

  1. Is it the UniFi switch? If so, then why is iperf3 fine?
  2. Is it because of Jumbo Frames not being enabled? If so, then why does 10Gb copper work fine? Or maybe it’s not fine because the read speeds are so slow?
  3. Is it some configuration with SMB? I don’t have multi-whatever enabled that’s suppose to speed up transfers, but still, why is 10Gb faster?
  4. Is it some configuration in Windows? There might be some SMB config I’m missing. I remember LinusTechTips talking about it in their 100Gb site-to-site fiber video.

Possible Debugging

  1. Since I have two all-SSD zpools on the NAS, I can test transfer speeds from one to the other, just that someone needs to give me a command to run.
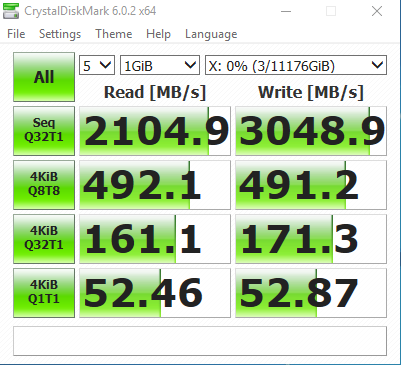
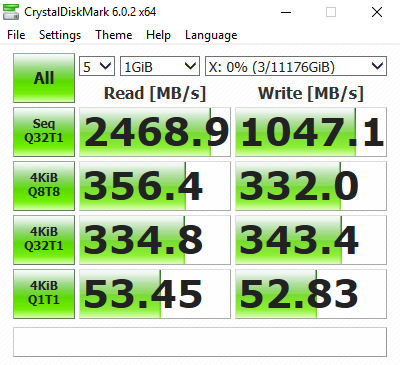
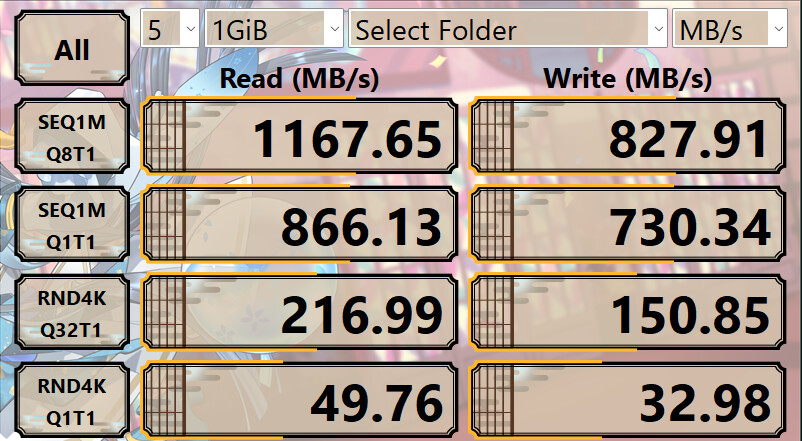
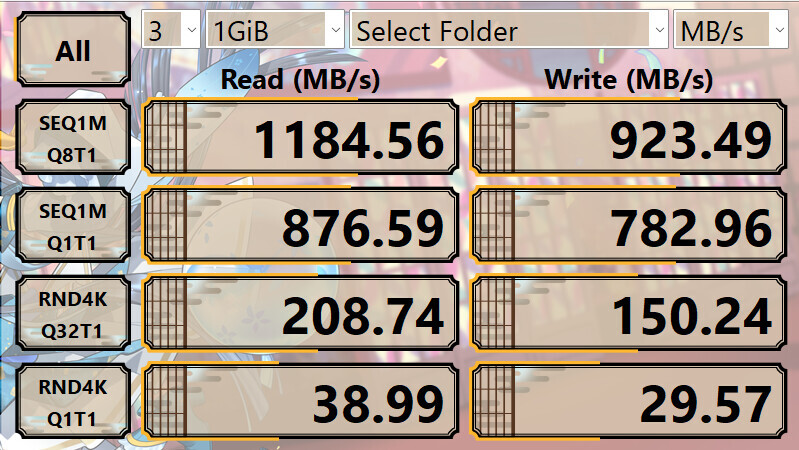
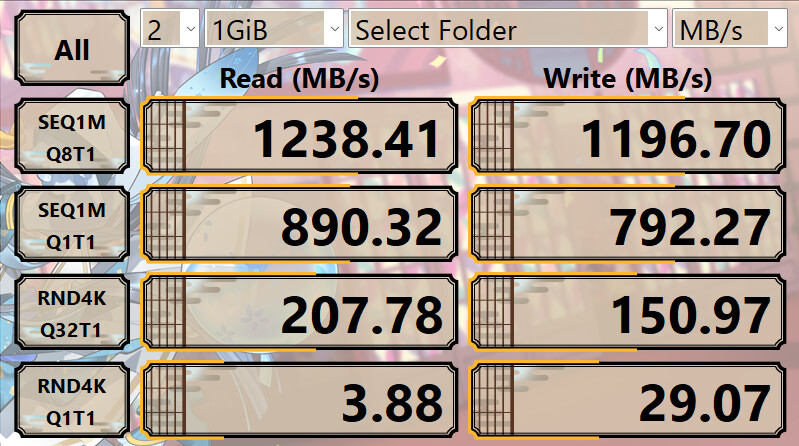
  2. Can I use Crystal Disk Mark to test network drives? Would that help narrow down SMB issues?
  3. Is it worth it to enable Jumbo Frames?
  4. Is my fiber dirty? I don’t have tools to check other than what UniFi or Mellanox drivers show.

How large of a file are you transferring? I don’t know how your cache is, but Id transfer like a 50GB file just to be semi-safe.

Try connecting the PC and NAS directly and remove the network. Just do a direct point to point and test again. See if the results are any different. If they are different, that could point to the switch.

I have used Crystal Disk mark to test network drives before. It is very handy for testing actual file transfer speeds between points over the file sharing protocol you are using.

Jumbo Frames do need to be enabled on all NICs and switches, otherwise it will either drop packets completely or will spend a lot of time breaking down the packets into smaller sized ones if the switch is capable of that (usually only L3 switches and routers). These can help a lot. Here are pics of my transfers via SMB with jumbo frames enabled:

LocalToServerFile_9000MTU

and not enabled:

LocalToServerFile_normalMTU

And Crystal Disk Mark, jumbo frames:

ServerCrystal_9000MTU

CDM, no jumbo frames:

ServerCrystal_normalMTU

Oddly, notice the significant drop in Q32 1T performance of the network drive with jumbo frames on. I suspect because it is a large queue depth of transactions that the overhead of the frames is making performance degrade. But significant sequential speed and higher thread depth speed though.

edit:
This was with fiber from my Windows PC to NAS server running Server 2018, using Mellanox ConnectX-3 NICs in both, connected at 40 gigabit over a Mellanox SX1024 switch. These tests were from about 5 years ago now.

2 Likes

This is great information! I definitely need to go Jumbo Frames network-wide.

You said L3 switches, but I don’t think I have any yet there’s still an option in UniFi for it.

I also need to test with Crystal Mark :+1:.

How I tested

I was testing transfers with one to three of the same 10GB files. I would expect my server’s 128GB RAM Arc to do something or my 2TB L2Arc. Something’s not adding up.

Eliminating bottlenecks

I can go NAS directly to my PC, but only over 10Gb. That can still help us mitigate any bottlenecks with the switch.

One thing to note is the 25Gb ports on this switch are weird. If you have 1xSFP28, then all 25Gb ports need to be 25Gb. No more stepping down.

When going copper to copper, I’m using the SFP+ ports. No data going to SPF28 ports. I’m wondering if there are two separate chips in there.

Other potential issues

While this may look like a NIC or switch issue, it could also be related to my NAS setup which runs TrueNAS SCALE.

If you know how, I’d like to test zpool performance to see if there are any bottlenecks there. For instance, why is my write speed nearly double my read speed?

Turn on Flow Control and try

Isn’t Flow Control just Smart Queing or similar? Or is it actually something else?

As a control, these are my stats using CrystalDiskMark with no other changes (no jumbo, flow control, etc).

The NAS is only 10Gb Copper.*

25Gb Fiber

10Gb Copper

Transferring a 10GB file using Windows Explorer

These numbers don’t match match CrystalDiskMark, but what I can say is there’s clearly as NAS limitation on the read speed whether that be Ethernet, the CPU, zpool, Jumbo Frames, or something else.

25Gb Fiber

Read

Test 1

image

Test 2

image

Write

Test 1

image

Test 2

image

10Gb Copper

Read

Test 1

image

Test 2

image

Write

Test 1

image

Test 2

image

1 Like

make sure you aren’t exceeding the fibre bend radius etc. on your cables.

they’re a lot more sensitive to abuse than copper.

1 Like

Correct. I made sure none of them are bent very much.

I saw that these cables are supposed to bend more than others, but either way, I’ve made sure they’re going smooth.

In this case, iperf3 is correctly doing 10Gb, it’s just something wrong with SMB and potentially my NAS.

Jumbo Frame & Flow Control

I checked the box for both Flow Control and Jumbo Frames on both UniFi network and the router.

How I did it

Mellanox

This is how I enabled it on the Mellanox adapters (each one):
image

UniFi

Network (all Switches)

Router

image

Internet results

My Internet connection is still ~1Gb up and down:
image
My Internet connection has been slower than normal recently. These numbers are actually slightly higher than they were the last few days.

Quick note: Over fiber, I got this super fast speed writing a 10GB file over SMB, but I haven’t seen this speed since:
image

PC ↔️ NAS Tests

After jumbo frames and flow control.

This is my PC connected to my NAS; and the NAS has 2x10Gb links, so the max it can do is 10Gb over a single connection.

iperf3

10Gb Copper

Sending
Connecting to host 10.1.0.6, port 5201
[  4] local 10.1.0.228 port 64725 connected to 10.1.0.6 port 5201
[ ID] Interval           Transfer     Bandwidth
[  4]   0.00-1.00   sec  1.09 GBytes  9.36 Gbits/sec
[  4]   1.00-2.00   sec  1.09 GBytes  9.38 Gbits/sec
[  4]   2.00-3.00   sec  1.11 GBytes  9.53 Gbits/sec
[  4]   3.00-4.00   sec  1.10 GBytes  9.44 Gbits/sec
[  4]   4.00-5.00   sec  1.10 GBytes  9.43 Gbits/sec
[  4]   5.00-6.00   sec  1.09 GBytes  9.38 Gbits/sec
[  4]   6.00-7.00   sec  1.10 GBytes  9.44 Gbits/sec
[  4]   7.00-8.00   sec  1.11 GBytes  9.51 Gbits/sec
[  4]   8.00-9.00   sec  1.09 GBytes  9.36 Gbits/sec
[  4]   9.00-10.00  sec  1.10 GBytes  9.46 Gbits/sec
- - - - - - - - - - - - - - - - - - - - - - - - -
[ ID] Interval           Transfer     Bandwidth
[  4]   0.00-10.00  sec  11.0 GBytes  9.43 Gbits/sec                  sender
[  4]   0.00-10.00  sec  11.0 GBytes  9.43 Gbits/sec                  receiver
Receiving
Connecting to host 10.1.0.6, port 5201
Reverse mode, remote host 10.1.0.6 is sending
[  4] local 10.1.0.228 port 64692 connected to 10.1.0.6 port 5201
[ ID] Interval           Transfer     Bandwidth
[  4]   0.00-1.00   sec  1.14 GBytes  9.77 Gbits/sec
[  4]   1.00-2.00   sec  1.15 GBytes  9.84 Gbits/sec
[  4]   2.00-3.00   sec  1.14 GBytes  9.76 Gbits/sec
[  4]   3.00-4.00   sec  1.14 GBytes  9.83 Gbits/sec
[  4]   4.00-5.00   sec  1.15 GBytes  9.89 Gbits/sec
[  4]   5.00-6.00   sec  1.15 GBytes  9.87 Gbits/sec
[  4]   6.00-7.00   sec  1.15 GBytes  9.90 Gbits/sec
[  4]   7.00-8.00   sec  1.15 GBytes  9.85 Gbits/sec
[  4]   8.00-9.00   sec  1.15 GBytes  9.89 Gbits/sec
[  4]   9.00-10.00  sec  1.15 GBytes  9.87 Gbits/sec
- - - - - - - - - - - - - - - - - - - - - - - - -
[ ID] Interval           Transfer     Bandwidth       Retr
[  4]   0.00-10.00  sec  11.5 GBytes  9.85 Gbits/sec    0             sender
[  4]   0.00-10.00  sec  11.5 GBytes  9.85 Gbits/sec                  receiver

25Gb Fiber

Sending
Connecting to host 10.1.0.6, port 5201
[  4] local 10.1.0.231 port 49275 connected to 10.1.0.6 port 5201
[ ID] Interval           Transfer     Bandwidth
[  4]   0.00-1.00   sec  1.05 GBytes  9.01 Gbits/sec
[  4]   1.00-2.00   sec  1.12 GBytes  9.65 Gbits/sec
[  4]   2.00-3.00   sec  1.09 GBytes  9.39 Gbits/sec
[  4]   3.00-4.00   sec  1.08 GBytes  9.24 Gbits/sec
[  4]   4.00-5.00   sec  1.11 GBytes  9.56 Gbits/sec
[  4]   5.00-6.00   sec  1.12 GBytes  9.61 Gbits/sec
[  4]   6.00-7.00   sec  1.12 GBytes  9.58 Gbits/sec
[  4]   7.00-8.00   sec  1.11 GBytes  9.53 Gbits/sec
[  4]   8.00-9.00   sec  1.06 GBytes  9.09 Gbits/sec
[  4]   9.00-10.00  sec  1.02 GBytes  8.74 Gbits/sec
- - - - - - - - - - - - - - - - - - - - - - - - -
[ ID] Interval           Transfer     Bandwidth
[  4]   0.00-10.00  sec  10.9 GBytes  9.34 Gbits/sec                  sender
[  4]   0.00-10.00  sec  10.9 GBytes  9.34 Gbits/sec                  receiver
Receiving
Connecting to host 10.1.0.6, port 5201
Reverse mode, remote host 10.1.0.6 is sending
[  4] local 10.1.0.231 port 49288 connected to 10.1.0.6 port 5201
[ ID] Interval           Transfer     Bandwidth
[  4]   0.00-1.00   sec  1.08 GBytes  9.30 Gbits/sec
[  4]   1.00-2.00   sec  1.15 GBytes  9.85 Gbits/sec
[  4]   2.00-3.00   sec  1.14 GBytes  9.81 Gbits/sec
[  4]   3.00-4.00   sec  1.15 GBytes  9.88 Gbits/sec
[  4]   4.00-5.00   sec  1.11 GBytes  9.51 Gbits/sec
[  4]   5.00-6.00   sec  1.13 GBytes  9.73 Gbits/sec
[  4]   6.00-7.00   sec  1.15 GBytes  9.87 Gbits/sec
[  4]   7.00-8.00   sec  1.15 GBytes  9.85 Gbits/sec
[  4]   8.00-9.00   sec  1.15 GBytes  9.87 Gbits/sec
[  4]   9.00-10.00  sec  1.14 GBytes  9.76 Gbits/sec
- - - - - - - - - - - - - - - - - - - - - - - - -
[ ID] Interval           Transfer     Bandwidth       Retr
[  4]   0.00-10.00  sec  11.3 GBytes  9.74 Gbits/sec    0             sender
[  4]   0.00-10.00  sec  11.3 GBytes  9.74 Gbits/sec                  receiver

As before, the stats are on-par, but they look slightly higher overall.

CrystalDiskMark

10Gb Copper

Before

After

25Gb Fiber

Before

After

Windows Explorer (10GB file)

10Gb Copper

Read

image

Write

image

25Gb Fiber

Read

image

Write

image

Conclusion

Cooper is still faster than fiber, but there was that 1 instance where fiber had a fast write speed.

I still want to know why the write speed on my NAS is so much faster than the read speed. What’s going on here?

1 Like

What’s the file system on the NAS and how many drives of what type?

ZFS is the filesystem.

System:

  • SuperMicro H12SSL-NT
  • AMD Epyc 7232p (8C/16T similar to Ryzen 7 5800X)
  • 128GB DDR4 3200 RAM
  • 3 x LSI 9305 cards (I spread drives out equally as much as possible between them in both pools)
  • All of this in a Storinator XL60 chassis which is direct-attach (no SAS expander)

Both pools are in the same machine.

Pool 1:
image

  • All data drives are 2TB Crucial MX500 SSDs.
  • All 894.25GiB drives are Intel Optane 905p.
  • I don’t use dedupe even though I have 2 drives setup for it. I’m probably gonna move those to be data disks.

Pool 2:
image

  • All drives are 4TB Crucial MX500 SSDs.

There are 2 other pools in this box, one for TrueNAS’s boot-pool and the other for TrueNAS Apps. Both use a single SSD mirror.

I built all this in December, so it’s relatively new. I added more drives in early-Jan and took my old pools and rewrote all the data, so it’s a pretty even spread:

image

Could be the ssd drives maybe?

Also check your CPU load under iperf3 in both Linux and Windows and then again don’t a file transfer.

CPU speed testing

What should I be using to check my CPU speed? And what stats are important to look for?

Also, what did you mean by “then again don’t a file transfer”?

Crucial MX500 Firmware issue

Most of my drives are on M3CR045, but some are on M3CR046 because I had used them in Windows prior to putting them in the NAS. Then there are a few with M3CR023 too. Not sure why, but those can’t upgrade to the M3CR046 firmware.

To update the firmware in Windows, I had to have multiple of the same drive in the system, and then one of them wouldn’t get updated. I only upgraded the firmware on 4 of them this way.

I wonder if I can update these from a Windows Docker container. Or maybe I can extract the .bin file from the Windows app? It’s gotta be stored on-disk somewhere.

Either way, updating to the latest firmware is definitely a good option provided I can do that.

on your NAS you can use HTOP, and windows task manager should be enough.

I want to see if the CPU’s are bottlenecking your transfers.

The Idea is to test using first iperf3 between the devices. I expect this to provide highest bandwidth between NAS and PC with the lowest CPU use.

Then test again but this time with a file copy. I am interested in seeing if the overhead of file read/write is pegging the CPU on either the NAS or windows.

Windows is know for poor file copy performance, and poor drive IO from a network. But its also possible that the NAS may be struggling to provide the cards with enough data if the overhead of ZFS and the network copy are hitting the CPU too hard.

The differences you are seeing in DAS vs FIBER connections are negligible enough.

1 Like

The 25gb slowdown may be caused by a few things or a combination of things.

Perhaps when you start sending data it is going at 25gb, the traffic fills up a buffer really fast and realizes it can’t run that speed when one endpoint is still 10gb, and has to start purging that buffer and throttling speed until it finds the speed everything can move at properly. When this behavior happens on typical networks it may not be that much of a performance penalty, but perhaps at very high speeds and larger differences in endpoints like 25gb and 10gb the penalty is greater

Another reason could be that the data is being sent between chipsets in the switch and causing extra latency

The LACP could also be bringing a penalty to things if the system has to check what port it should put traffic on before things get started.

1 Like

I ran these tasks multiple times and am only showing on of the runs since they were all the same.

NOTE: All tests done with 10Gb Copper

NAS ↔️ PC

Running iperf3 shows 1 core being pegged when receiving data, but then it’s over quickly after that.

As a reminder, iperf3 shows the same max-speed when using 25Gb and 10Gb.

Speeds are extra slow today, and all CPU load is coming from Windows:

PC ↔️ NAS

Write speed was 1GB/s+ with no CPU load on my desktop:

The differences you are seeing in DAS vs FIBER connections are negligible enough.

I wouldn’t say a 500MB/s write speed is negligible. That’s byte, not bit.

You can be bottlenecked by a different part of the system depending on how Samba is connecting. Is it possible it’s using RDMA or Multichannel in one but not the other?

1 Like

welp… so much for that idea.

1 Like

you should test the performance directly on the NAS.
Use fio, here the results of an Intel SSD DC P4618 and ZFS to compare.

[manja01 ~]# fio --filename=/store01/testfile --direct=1 --rw=randrw --bs=8k --ioengine=libaio --iodepth=256 --runtime=120 --numjobs=4 --time_based --group_reporting --name=iops-test-job --eta-newline=1

iops-test-job: (g=0): rw=randrw, bs=(R) 8192B-8192B, (W) 8192B-8192B, (T) 8192B-8192B, ioengine=libaio, iodepth=256

...

fio-3.29

Starting 4 processes

Jobs: 4 (f=4): [m(4)][2.5%][r=277MiB/s,w=276MiB/s][r=35.4k,w=35.3k IOPS][eta 01m:57s]

Jobs: 4 (f=4): [m(4)][100.0%][r=251MiB/s,w=254MiB/s][r=32.1k,w=32.5k IOPS][eta 00m:00s]

iops-test-job: (groupid=0, jobs=4): err= 0: pid=911005: Sun Jul 3 16:44:52 2022

read: IOPS=34.5k, BW=269MiB/s (283MB/s)(31.6GiB/120001msec)

slat (usec): min=2, max=7698, avg=49.69, stdev=55.04

clat (usec): min=12, max=72919, avg=14790.83, stdev=6390.12

lat (usec): min=72, max=72948, avg=14840.72, stdev=6409.81

clat percentiles (usec):

| 1.00th=[ 6718], 5.00th=[ 8029], 10.00th=[ 8717], 20.00th=[10028],

| 30.00th=[11076], 40.00th=[11994], 50.00th=[13042], 60.00th=[14615],

| 70.00th=[16450], 80.00th=[18482], 90.00th=[22152], 95.00th=[26870],

| 99.00th=[39060], 99.50th=[43254], 99.90th=[51643], 99.95th=[54264],

| 99.99th=[59507]

bw ( KiB/s): min=166400, max=509584, per=100.00%, avg=276172.13, stdev=12514.72, samples=956

iops : min=20800, max=63698, avg=34521.50, stdev=1564.35, samples=956

write: IOPS=34.5k, BW=269MiB/s (282MB/s)(31.6GiB/120001msec); 0 zone resets

slat (usec): min=3, max=7812, avg=61.35, stdev=58.01

clat (usec): min=75, max=72853, avg=14785.88, stdev=6391.74

lat (usec): min=147, max=73082, avg=14847.46, stdev=6416.23

clat percentiles (usec):

| 1.00th=[ 6718], 5.00th=[ 8029], 10.00th=[ 8717], 20.00th=[10028],

| 30.00th=[11076], 40.00th=[11994], 50.00th=[13042], 60.00th=[14615],

| 70.00th=[16450], 80.00th=[18482], 90.00th=[22152], 95.00th=[26870],

| 99.00th=[39060], 99.50th=[43254], 99.90th=[51643], 99.95th=[54264],

| 99.99th=[59507]

bw ( KiB/s): min=167360, max=507856, per=100.00%, avg=276014.88, stdev=12509.18, samples=956

iops : min=20920, max=63482, avg=34501.83, stdev=1563.65, samples=956

lat (usec) : 20=0.01%, 50=0.01%, 100=0.01%, 250=0.01%, 500=0.01%

lat (usec) : 750=0.01%, 1000=0.01%

lat (msec) : 2=0.01%, 4=0.01%, 10=20.21%, 20=64.72%, 50=14.93%

lat (msec) : 100=0.14%

cpu : usr=4.72%, sys=92.69%, ctx=87212, majf=0, minf=41834

IO depths : 1=0.1%, 2=0.1%, 4=0.1%, 8=0.1%, 16=0.1%, 32=0.1%, >=64=100.0%

submit : 0=0.0%, 4=100.0%, 8=0.0%, 16=0.0%, 32=0.0%, 64=0.0%, >=64=0.0%

complete : 0=0.0%, 4=100.0%, 8=0.0%, 16=0.0%, 32=0.0%, 64=0.0%, >=64=0.1%

issued rwts: total=4139525,4137375,0,0 short=0,0,0,0 dropped=0,0,0,0

latency : target=0, window=0, percentile=100.00%, depth=256

Run status group 0 (all jobs):

READ: bw=269MiB/s (283MB/s), 269MiB/s-269MiB/s (283MB/s-283MB/s), io=31.6GiB (33.9GB), run=120001-120001msec

WRITE: bw=269MiB/s (282MB/s), 269MiB/s-269MiB/s (282MB/s-282MB/s), io=31.6GiB (33.9GB), run=120001-120001msec

or with dd

Linux_I/O_Performance_Tests_using_dd

1 Like