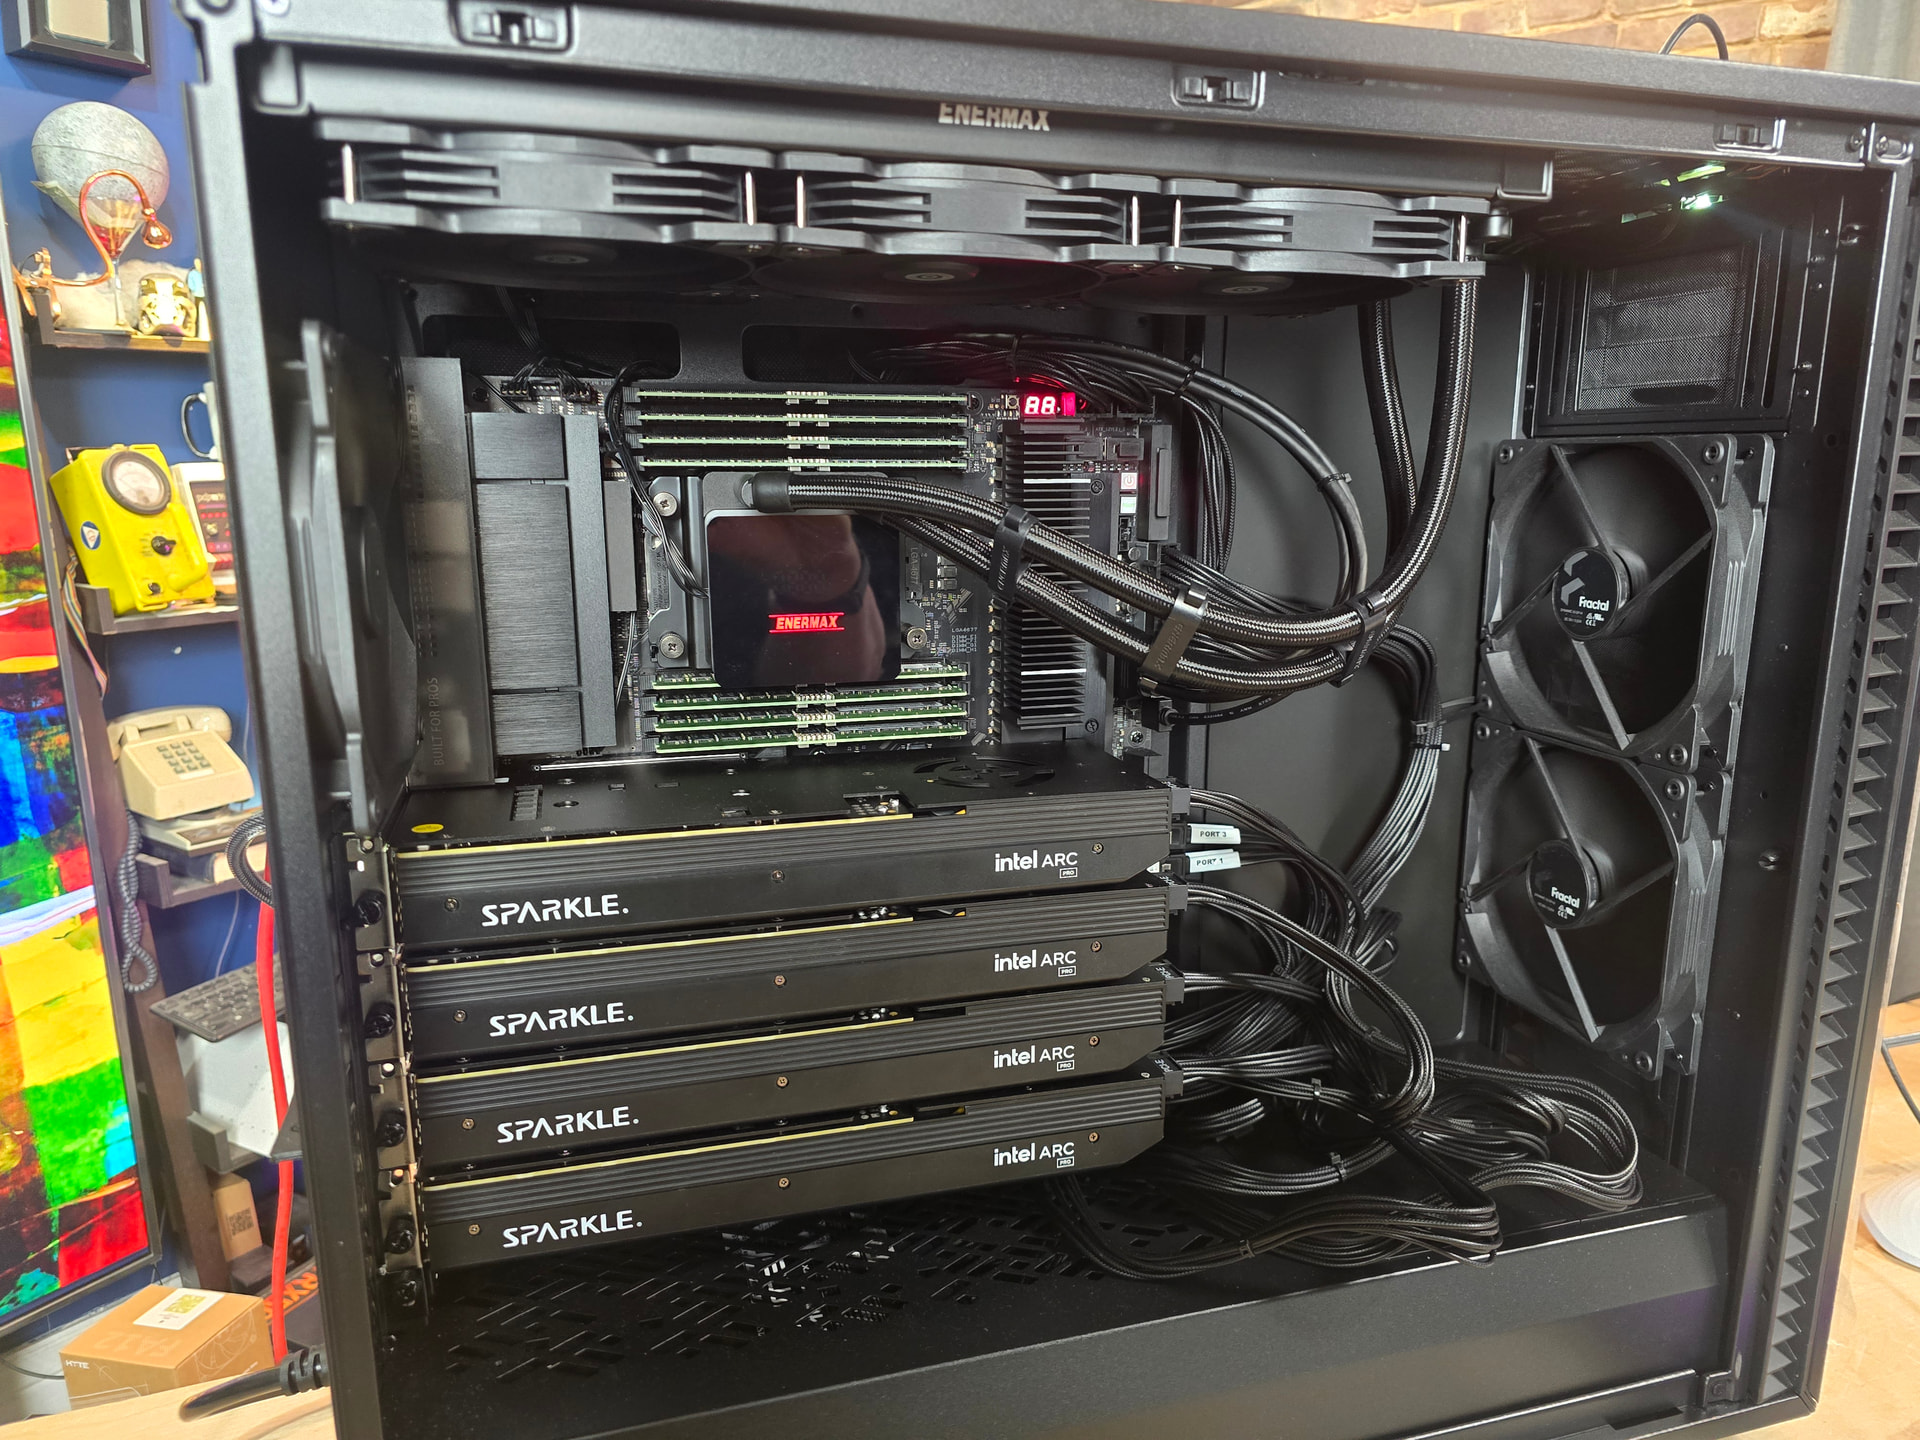
it’s here!!!
intel@intel-battlematrix:~$ lspci |grep VGA
05:00.0 VGA compatible controller: ASPEED Technology, Inc. ASPEED Graphics Family (rev 52)
18:00.0 VGA compatible controller: Intel Corporation Device e211
36:00.0 VGA compatible controller: Intel Corporation Device e211
54:00.0 VGA compatible controller: Intel Corporation Device e211
72:00.0 VGA compatible controller: Intel Corporation Device e211
            .-/+oossssoo+/-.               intel@intel-battlematrix
        `:+ssssssssssssssssss+:`           ------------------------
      -+ssssssssssssssssssyyssss+-         OS: Ubuntu 25.04 x86_64
    .ossssssssssssssssssdMMMNysssso.       Kernel: 6.14.0-1008-intel
   /ssssssssssshdmmNNmmyNMMMMhssssss/      Uptime: 1 hour, 25 mins
  +ssssssssshmydMMMMMMMNddddyssssssss+     Packages: 1636 (dpkg), 12 (snap)
 /sssssssshNMMMyhhyyyyhmNMMMNhssssssss/    Shell: bash 5.2.37
.ssssssssdMMMNhsssssssssshNMMMdssssssss.   Resolution: 1024x768
+sssshhhyNMMNyssssssssssssyNMMMysssssss+   Terminal: /dev/pts/4
ossyNMMMNyMMhsssssssssssssshmmmhssssssso   CPU: Intel Xeon w5-3435X (32) @ 4.500GHz
ossyNMMMNyMMhsssssssssssssshmmmhssssssso   GPU: Intel Device e211
+sssshhhyNMMNyssssssssssssyNMMMysssssss+   GPU: Intel Device e211
.ssssssssdMMMNhsssssssssshNMMMdssssssss.   GPU: Intel Device e211
 /sssssssshNMMMyhhyyyyhdNMMMNhssssssss/    Memory: 88844MiB / 257243MiB
  +sssssssssdmydMMMMMMMMddddyssssssss+
   /ssssssssssshdmNNNNmyNMMMMhssssss/
    .ossssssssssssssssssdMMMNysssso.
      -+sssssssssssssssssyyyssss+-
        `:+ssssssssssssssssss+:`
            .-/+oossssoo+/-.
gpt oss120b
TORCH_LLM_ALLREDUCE=1 VLLM_USE_V1=1 CCL_ZE_IPC_EXCHANGE=pidfd VLLM_ALLOW_LONG_MAX_MODEL_LEN=1 VLLM_WORKER_MULTIPROC_METHOD=spawn python3 -m vllm.entrypoints.openai.api_server --model openai/gpt-oss-120b --dtype=bfloat16 --enforce-eager --port 8000 --host 0.0.0.0 --trust-remote-code --gpu-memory-util=0.95 --no-enable-prefix-caching --max-num-batched-tokens=8192 --disable-log-requests --max-model-len=8192 --quantization mxfp4 --block-size 64 --tensor-parallel-size 4
Waiting for endpoint to become up in 600 seconds
 |                                                                                                                                                                                        | 00:06 elapsed, 1397:02:30 remaining
Initial test run completed. Starting main benchmark run...
Traffic request rate: inf
Burstiness factor: 1.0 (Poisson process)
Maximum request concurrency: None
100%|██████████████████████████████████████████████████████████████████████████████████████████████████████████████████████████████████████████████████████████████████████████████████████████| 50/50 [00:25<00:00,  1.93it/s]
============ Serving Benchmark Result ============
Successful requests:                     50
Benchmark duration (s):                  25.95
Total input tokens:                      51200
Total generated tokens:                  25600
Request throughput (req/s):              1.93
Output token throughput (tok/s):         986.61
Total Token throughput (tok/s):          2959.84
---------------Time to First Token----------------
Mean TTFT (ms):                          3920.69
Median TTFT (ms):                        4348.54
P99 TTFT (ms):                           6626.93
-----Time per Output Token (excl. 1st token)------
Mean TPOT (ms):                          42.88
Median TPOT (ms):                        42.08
P99 TPOT (ms):                           48.93
---------------Inter-token Latency----------------
Mean ITL (ms):                           42.88
Median ITL (ms):                         38.10
P99 ITL (ms):                            41.10
==================================================
(APIServer pid=895) INFO 02-22 19:32:07 [loggers.py:123] Engine 000: Avg prompt throughput: 60.4 tokens/s, Avg generation throughput: 36.5 tokens/s, Running: 0 reqs, Waiting: 0 reqs, GPU KV cache usage: 0.0%, Prefix cache hit rate: 0.0%
(APIServer pid=895) INFO:     10.200.0.55:60966 - "POST /v1/chat/completions HTTP/1.1" 200 OK
(APIServer pid=895) INFO 02-22 19:32:17 [loggers.py:123] Engine 000: Avg prompt throughput: 10.3 tokens/s, Avg generation throughput: 28.9 tokens/s, Running: 1 reqs, Waiting: 0 reqs, GPU KV cache usage: 0.4%, Prefix cache hit rate: 0.0%
(APIServer pid=895) INFO 02-22 19:32:27 [loggers.py:123] Engine 000: Avg prompt throughput: 0.0 tokens/s, Avg generation throughput: 38.6 tokens/s, Running: 1 reqs, Waiting: 0 reqs, GPU KV cache usage: 0.8%, Prefix cache hit rate: 0.0%
(APIServer pid=895) INFO 02-22 19:32:37 [loggers.py:123] Engine 000: Avg prompt throughput: 0.0 tokens/s, Avg generation throughput: 38.7 tokens/s, Running: 1 reqs, Waiting: 0 reqs, GPU KV cache usage: 1.2%, Prefix cache hit rate: 0.0%
(APIServer pid=895) INFO 02-22 19:32:47 [loggers.py:123] Engine 000: Avg prompt throughput: 0.0 tokens/s, Avg generation throughput: 38.4 tokens/s, Running: 1 reqs, Waiting: 0 reqs, GPU KV cache usage: 1.5%, Prefix cache hit rate: 0.0%
(APIServer pid=895) INFO 02-22 19:32:57 [loggers.py:123] Engine 000: Avg prompt throughput: 0.0 tokens/s, Avg generation throughput: 38.7 tokens/s, Running: 1 reqs, Waiting: 0 reqs, GPU KV cache usage: 1.9%, Prefix cache hit rate: 0.0%
(APIServer pid=895) INFO 02-22 19:33:07 [loggers.py:123] Engine 000: Avg prompt throughput: 0.0 tokens/s, Avg generation throughput: 38.4 tokens/s, Running: 1 reqs, Waiting: 0 reqs, GPU KV cache usage: 2.2%, Prefix cache hit rate: 0.0%
(APIServer pid=895) INFO 02-22 19:33:17 [loggers.py:123] Engine 000: Avg prompt throughput: 0.0 tokens/s, Avg generation throughput: 38.3 tokens/s, Running: 1 reqs, Waiting: 0 reqs, GPU KV cache usage: 2.6%, Prefix cache hit rate: 0.0%
(APIServer pid=895) INFO 02-22 19:33:27 [loggers.py:123] Engine 000: Avg prompt throughput: 299.3 tokens/s, Avg generation throughput: 36.9 tokens/s, Running: 1 reqs, Waiting: 0 reqs, GPU KV cache usage: 3.0%, Prefix cache hit rate: 0.0%
(APIServer pid=895) INFO:     10.200.0.55:60966 - "POST /v1/chat/completions HTTP/1.1" 200 OK
(APIServer pid=895) INFO 02-22 19:33:37 [loggers.py:123] Engine 000: Avg prompt throughput: 0.0 tokens/s, Avg generation throughput: 22.9 tokens/s, Running: 0 reqs, Waiting: 0 reqs, GPU KV cache usage: 0.0%, Prefix cache hit rate: 0.0%
(APIServer pid=895) INFO 02-22 19:33:47 [loggers.py:123] Engine 000: Avg prompt throughput: 0.0 tokens/s, Avg generation throughput: 0.0 tokens/s, Running: 0 reqs, Waiting: 0 reqs, GPU KV cache usage: 0.0%, Prefix cache hit rate: 0.0%
This is both excellent scaling and excellent parallel throughput.
However, for a single request, with gpt-oss120b we’re in that roughly 20-40t/s performance window.
LLama 70b
So I ran into a problem and I thought --max-num-batched-tokens or no-enable-batched would help me diagnose. Turns out V1 is designed ONLY for batching.
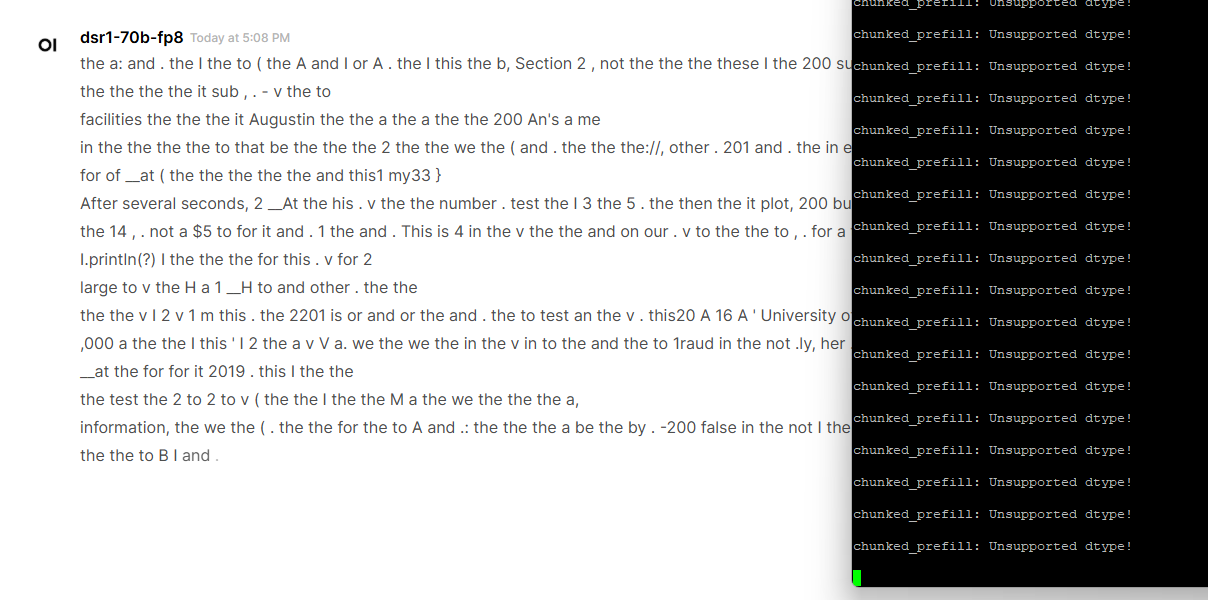
^Cchunked_prefill: Unsupported dtype!

(Worker_TP3 pid=5173) INFO 02-22 21:17:20 [multiproc_executor.py:546] Parent process exited, terminating worker
(APIServer pid=4954) WARNING 02-22 21:17:20 [_logger.py:68] port 8000 is used by process psutil.Process(pid=4954, name='python3', status='running') launched with command:
(APIServer pid=4954) WARNING 02-22 21:17:20 [_logger.py:68] python3 -m vllm.entrypoints.openai.api_server --model meta-llama/Llama-3.1-70B --served-model-name meta-llama/Llama-3.1-70B --enforce-eager --host 0.0.0.0 --port 8000 --trust-remote-code --gpu-memory-utilization 0.90 --no-enable-prefix-caching --no-enable-chunked-prefill --max-model-len 2048 --block-size 16 --quantization fp8 --tensor-parallel-size 4
(APIServer pid=4954) INFO 02-22 21:17:20 [launcher.py:101] Shutting down FastAPI HTTP server.
(Worker_TP0 pid=5170) INFO 02-22 21:17:20 [multiproc_executor.py:546] Parent process exited, terminating worker
(Worker_TP1 pid=5171) INFO 02-22 21:17:20 [multiproc_executor.py:546] Parent process exited, terminating worker
(Worker_TP2 pid=5172) INFO 02-22 21:17:20 [multiproc_executor.py:546] Parent process exited, terminating worker
^C(APIServer pid=4954) INFO:     Shutting down
(APIServer pid=4954) INFO:     Waiting for connections to close. (CTRL+C to force quit)
(APIServer pid=4954) INFO 02-22 21:17:24 [loggers.py:123] Engine 000: Avg prompt throughput: 0.0 tokens/s, Avg generation throughput: 206.4 tokens/s, Running: 20 reqs, Waiting: 30 reqs, GPU KV cache usage: 96.3%, Prefix cache hit rate: 0.0%
So vllm bench serve is broken here with the spam of chunked_prefill: Unsupported dtype! ?
however
TORCH_LLM_ALLREDUCE=1 VLLM_USE_V1=1 CCL_ZE_IPC_EXCHANGE=pidfd VLLM_ALLOW_LONG_MAX_MODEL_LEN=1 VLLM_WORKER_MULTIPROC_METHOD=spawn python3 -m vllm.entrypoints.openai.api_server --model meta-llama/Llama-3.1-70B --enforce-eager --host 0.0.0.0 --port 8000 --trust-remote-code --gpu-memory-utilization 0.90 --no-enable-prefix-caching --no-enable-chunked-prefill --max-model-len 2048 --block-size 64 --quantization fp8 --tensor-parallel-size 4

# Readability
TORCH_LLM_ALLREDUCE=1 \
VLLM_USE_V1=1 \
CCL_ZE_IPC_EXCHANGE=pidfd \
VLLM_ALLOW_LONG_MAX_MODEL_LEN=1 \
VLLM_WORKER_MULTIPROC_METHOD=spawn \
python3 -m vllm.entrypoints.openai.api_server \
  --model meta-llama/Llama-3.1-70B \
  --enforce-eager \
  --host 0.0.0.0 \
  --port 8000 \
  --trust-remote-code \
  --gpu-memory-utilization 0.90 \
  --no-enable-prefix-caching \
  --no-enable-chunked-prefill \
  --max-model-len 2048 \
  --block-size 64 \
  --quantization fp8 \
  --tensor-parallel-size 4
–block-size 64 is the solution to this problem.
============ Serving Benchmark Result ============
Successful requests:                     50
Benchmark duration (s):                  110.22
Total input tokens:                      51150
Total generated tokens:                  20526
Request throughput (req/s):              0.45
Output token throughput (tok/s):         186.23
Total Token throughput (tok/s):          650.29
---------------Time to First Token----------------
Mean TTFT (ms):                          34482.42
Median TTFT (ms):                        19422.21
P99 TTFT (ms):                           76096.98
-----Time per Output Token (excl. 1st token)------
Mean TPOT (ms):                          310.94
Median TPOT (ms):                        107.19
P99 TPOT (ms):                           1444.64
---------------Inter-token Latency----------------
Mean ITL (ms):                           104.44
Median ITL (ms):                         67.47
P99 ITL (ms):                            1439.60
==================================================
Not bad! TTFT is, as expected, a bit rough with the dynamic quant.
If you set this up in openwebui it’ll give you:

you need to create a chat template like llama3.jinja
{% set loop_messages = messages %}
{% for message in loop_messages %}
{% if loop.index0 == 0 %}<|begin_of_text|>{% endif %}<|start_header_id|>{{ message['role'] }}<|end_header_id|>

{% if message['content'] is string %}
{{ message['content'] }}
{% else %}
{% for part in message['content'] %}
{% if part.get('type') == 'text' %}
{{ part.get('text', '') }}
{% endif %}
{% endfor %}
{% endif %}<|eot_id|>
{% endfor %}
{% if add_generation_prompt %}<|start_header_id|>assistant<|end_header_id|>

{% endif %}
then use --chat-template /path/to/llama3.jinja as part of the startup.
TORCH_LLM_ALLREDUCE=1 VLLM_USE_V1=1 CCL_ZE_IPC_EXCHANGE=pidfd VLLM_ALLOW_LONG_MAX_MODEL_LEN=1 VLLM_WORKER_MULTIPROC_METHOD=spawn python3 -m vllm.entrypoints.openai.api_server --model meta-llama/Llama-3.1-70B --enforce-eager --host 0.0.0.0 --port 8000 --trust-remote-code --gpu-memory-utilization 0.90 --chat-template ./llama3.jinja --max-model-len 2048 --block-size 64 --quantization fp8 --tensor-parallel-size 4
It is also helpful to set the temperature to 0.2, max_tokens and a repetition penalty.. but that tends to be more on the openwebui side of things.
When using this model with just one client via Openwebui I get
(APIServer pid=2023) INFO 02-24 19:44:11 [loggers.py:123] Engine 000: Avg prompt throughput: 0.0 tokens/s, Avg generation throughput: 19.1 tokens/s, Running: 1 reqs, Wait
In general Llama 70b-fp16 (in dynamic fp8) behaved a bit weirdly. It can work as well as this however:
Qwen3-30B-A3B
TORCH_LLM_ALLREDUCE=1 VLLM_USE_V1=1 CCL_ZE_IPC_EXCHANGE=pidfd VLLM_ALLOW_LONG_MAX_MODEL_LEN=1 VLLM_WORKER_MULTIPROC_METHOD=spawn python3 -m vllm.entrypoints.openai.api_server --model Qwen/Qwen3-30B-A3B --enforce-eager --host 0.0.0.0 --port 8000 --trust-remote-code --gpu-memory-utilization 0.90 --max-model-len 2048 --block-size 64 --quantization fp8 --tensor-parallel-size 4
For the benchmark:
(APIServer pid=2587) INFO 02-24 20:00:13 [loggers.py:123] Engine 000: Avg prompt throughput: 3166.1 tokens/s, Avg generation throughput: 881.1 tokens/s, Running: 50 reqs, Waiting: 0 reqs, GPU KV cache usage: 12.4%, Prefix cache hit rate: 1.8%
============ Serving Benchmark Result ============
Successful requests:                     50
Benchmark duration (s):                  25.82
Total input tokens:                      51034
Total generated tokens:                  25600
Request throughput (req/s):              1.94
Output token throughput (tok/s):         991.66
Total Token throughput (tok/s):          2968.56
---------------Time to First Token----------------
Mean TTFT (ms):                          2858.24
Median TTFT (ms):                        2768.20
P99 TTFT (ms):                           5462.78
-----Time per Output Token (excl. 1st token)------
Mean TPOT (ms):                          43.97
Median TPOT (ms):                        44.12
P99 TPOT (ms):                           48.14
---------------Inter-token Latency----------------
Mean ITL (ms):                           43.97
Median ITL (ms):                         39.65
P99 ITL (ms):                            219.20
==================================================
Single client openwebui metrics:
(APIServer pid=2587) INFO 02-24 20:01:33 [loggers.py:123] Engine 000: Avg prompt throughput: 0.0 tokens/s, Avg generation throughput: 29.1 tokens/s, Running: 1 reqs, Waiting: 0 reqs, GPU


KV cache usage: 0.1%, Prefix cache hit rate: 1.8%

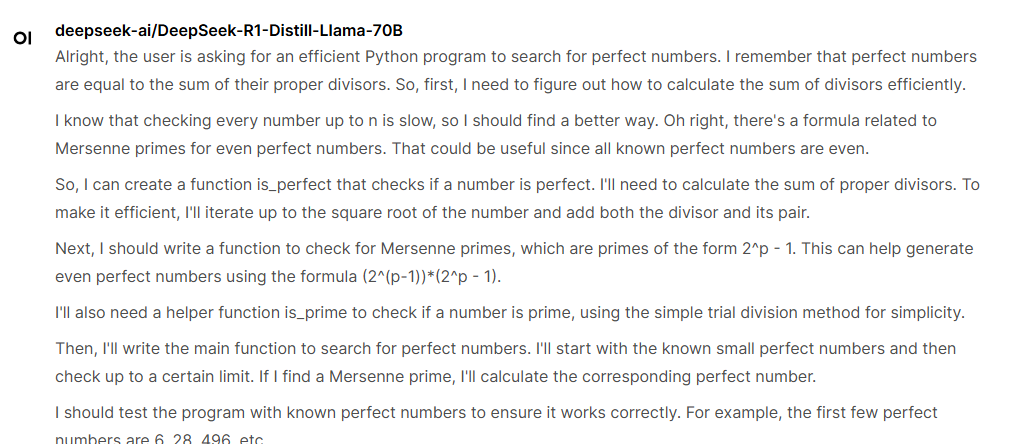
Deepseek R! Distill Llama 70B
I was curious about this llama-based deepseek distillation given the hiccups on Llama 70b, so I tried it and it worked fine.
Command I used (no chat template needed)
TORCH_LLM_ALLREDUCE=1 VLLM_USE_V1=1 CCL_ZE_IPC_EXCHANGE=pidfd VLLM_ALLOW_LONG_MAX_MODEL_LEN=1 VLLM_WORKER_MULTIPROC_METHOD=spawn python3 -m vllm.entrypoints.openai.api_server --model deepseek-ai/DeepSeek-R1-Distill-Llama-70B --enforce-eager --host 0.0.0.0 --port 8000 --trust-remote-code --gpu-memory-utilization 0.90 --max-model-len 2048 --block-size 64 --quantization fp8 --tensor-parallel-size 4
(APIServer pid=4414) INFO 02-24 20:35:36 [loggers.py:123] Engine 000: Avg prompt throughput: 0.0 tokens/s, Avg generation throughput: 19.2 tokens/s, Running: 1 reqs, Waiting: 0 reqs, GPU KV cache usage: 1.4%, Prefix cache hit rate: 0.0%
============ Serving Benchmark Result ============
Successful requests:                     50
Benchmark duration (s):                  143.17
Total input tokens:                      51150
Total generated tokens:                  25600
Request throughput (req/s):              0.35
Output token throughput (tok/s):         178.80
Total Token throughput (tok/s):          536.06
---------------Time to First Token----------------
Mean TTFT (ms):                          43833.33
Median TTFT (ms):                        38216.57
P99 TTFT (ms):                           113761.08
-----Time per Output Token (excl. 1st token)------
Mean TPOT (ms):                          99.47
Median TPOT (ms):                        98.13
P99 TPOT (ms):                           165.66
---------------Inter-token Latency----------------
Mean ITL (ms):                           99.47
Median ITL (ms):                         67.58
P99 ITL (ms):                            1436.97
==================================================
And the actual openwebui results are coherent!
Battlematrix (4× Intel B60) vLLM caveat for Llama-70B / DeepSeek-R1-Distill-Llama-70B FP8 benchmarks
I finally got Llama-3.1-70B and DeepSeek-R1-Distill-Llama-70B running on the 4×B60 “Battlematrix” setup using Intel’s XPU vLLM stack, but there’s an important caveat for anyone trying to reproduce results.
TL;DR
-
In this Intel vLLM XPU build, when
VLLM_USE_V1=1is enabled, chunked prefill appears to be forced on, even if you pass:--no-enable-chunked-prefill
-
The CLI arg is parsed (shows as false in logs), but the scheduler still reports chunked prefill enabled.
-
I was hitting
chunked_prefill: Unsupported dtype!with FP8 until I changed:--block-size 64
-
With
--block-size 64, both:-
meta-llama/Llama-3.1-70B -
deepseek-ai/DeepSeek-R1-Distill-Llama-70B
work in FP8 with tensor parallel = 4.
-
Tango down, we’ve lost a gpu
[ 1406.844376] hid-generic 0003:3384:0007.000A: hiddev2,hidraw5: USB HID v1.11 Device [System76 Launch Heavy Configurable Keyboard (launch_heavy_1)] on usb-0000:00:14.0-6.3.6/input1
[ 5818.822901] {1}[Hardware Error]: Hardware error from APEI Generic Hardware Error Source: 0
[ 5818.822912] {1}[Hardware Error]: It has been corrected by h/w and requires no further action
[ 5818.822916] {1}[Hardware Error]: event severity: corrected
[ 5818.822920] {1}[Hardware Error]:  Error 0, type: corrected
[ 5818.822925] {1}[Hardware Error]:   section_type: PCIe error
[ 5818.822928] {1}[Hardware Error]:   port_type: 5, upstream switch port
[ 5818.822932] {1}[Hardware Error]:   version: 3.0
[ 5818.822935] {1}[Hardware Error]:   command: 0x0147, status: 0x0011
[ 5818.822940] {1}[Hardware Error]:   device_id: 0000:34:00.0
[ 5818.822945] {1}[Hardware Error]:   slot: 0
[ 5818.822948] {1}[Hardware Error]:   secondary_bus: 0x35
[ 5818.822951] {1}[Hardware Error]:   vendor_id: 0x8086, device_id: 0xe2ff
[ 5818.822955] {1}[Hardware Error]:   class_code: 060400
[ 5818.822959] {1}[Hardware Error]:   bridge: secondary_status: 0x0000, control: 0x0013
[ 5818.822963] {1}[Hardware Error]:   aer_cor_status: 0x00002001, aer_cor_mask: 0x00000000
[ 5818.822967] {1}[Hardware Error]:   aer_uncor_status: 0x00100000, aer_uncor_mask: 0x00180000
[ 5818.822971] {1}[Hardware Error]:   aer_uncor_severity: 0x00463030
[ 5818.822974] {1}[Hardware Error]:   TLP Header: 00000000 00000000 00000000 00000000
[ 5818.823043] pcieport 0000:34:00.0: AER: aer_status: 0x00002001, aer_mask: 0x00000000
[ 5818.823056] pcieport 0000:34:00.0:    [ 0] RxErr                  (First)
[ 5818.823063] pcieport 0000:34:00.0:    [13] NonFatalErr
[ 5818.823069] pcieport 0000:34:00.0: AER: aer_layer=Physical Layer, aer_agent=Receiver ID
[ 7526.844152] audit: type=1400 audit(1771790400.347:224): apparmor="DENIED" operation="open" class="file" profile="snap.firmware-updater.firmware-notifier" name="/proc/sys/vm/max_map_count" pid=15365 comm="firmware-notifi" requested_mask="r" denied_mask="r" fsuid=1000 ouid=0
[ 9143.258478] xe 0000:54:00.0: [drm] VM worker error: -12
Helpful script for diagnosing intel gpu down
for i in 0 1 2 3; do
  echo "=== GPU $i ==="
  ZE_AFFINITY_MASK=$i python3 -m vllm.entrypoints.openai.api_server \
    --model Qwen/Qwen3-0.6B \
    --served-model-name qwen-test-$i \
    --host 0.0.0.0 --port $((8100+i)) \
    --dtype bfloat16 \
    --gpu-memory-utilization 0.8 \
    --max-model-len 1024 \
    --max-num-batched-tokens 1024 \
    --enforce-eager &
  sleep 20
  curl -s http://127.0.0.1:$((8100+i))/v1/models || true
  pkill -f "port $((8100+i))" || true
  sleep 5
done
Deepseek Distill 70b
TORCH_LLM_ALLREDUCE=1 \
VLLM_USE_V1=1 \
CCL_ZE_IPC_EXCHANGE=pidfd \
VLLM_ALLOW_LONG_MAX_MODEL_LEN=1 \
VLLM_WORKER_MULTIPROC_METHOD=spawn \
python3 -m vllm.entrypoints.openai.api_server \
  --model deepseek-ai/DeepSeek-R1-Distill-Llama-70B \
  --served-model-name dsr1-70b-fp8 \
  --enforce-eager \
  --host 0.0.0.0 \
  --port 8000 \
  --gpu-memory-utilization 0.90 \
  --no-enable-prefix-caching \
  --no-enable-chunked-prefill \
  --max-model-len 2048 \
  --block-size 16 \
  --quantization fp8 \
  --tensor-parallel-size 4
vllm bench serve \
  --backend vllm \
  --endpoint-type openai \
  --base-url http://127.0.0.1:8000 \
  --endpoint /v1/completions \
  --model dsr1-70b-fp8 \
  --tokenizer deepseek-ai/DeepSeek-R1-Distill-Llama-70B \
  --dataset-name random \
  --num-prompts 50 \
  --random-input-len 1024 \
  --random-output-len 512 \
  --percentile-metrics ttft,tpot,itl \
  --metric-percentiles 99
(APIServer pid=8919) INFO 02-22 21:57:24 [loggers.py:123] Engine 000: Avg prompt throughput: 0.0 tokens/s, Avg generation throughput: 272.0 tokens/s, Running: 0 reqs, Waiting: 0 reqs, GPU KV cache usage: 0.0%, Prefix cache hit rate: 0.0%
Why short synthetic benchmarks look fast, but agentic coding (OpenCode, etc.) feels slower
This is the big gotcha.
A lot of benchmark runs (including what I’m posting below) use something like:
-
~1K input tokens
-
a few hundred output tokens
That’s useful for comparison, but it doesn’t fully represent agentic coding workloads.
What changes with tools like OpenCode / agentic coding workflows
Agentic coding often carries:
-
very large context windows (e.g. 10K+ tokens)
-
prior turns
-
file excerpts
-
tool outputs
-
diffs
-
system prompts / planning traces
That makes the prefill phase much heavier.
 )

 .
