Nitty Gritty
Okay the rest of this is a hodge podge of notes, benchmarks, and some graphs collected during this testing.
$ cowsay -s "this is exciting"
 __________________
< this is exciting >
 ------------------
        \   ^__^
         \  (**)\_______
            (__)\       )\/\
             U  ||----w |
                ||     ||
Hardware Configuration
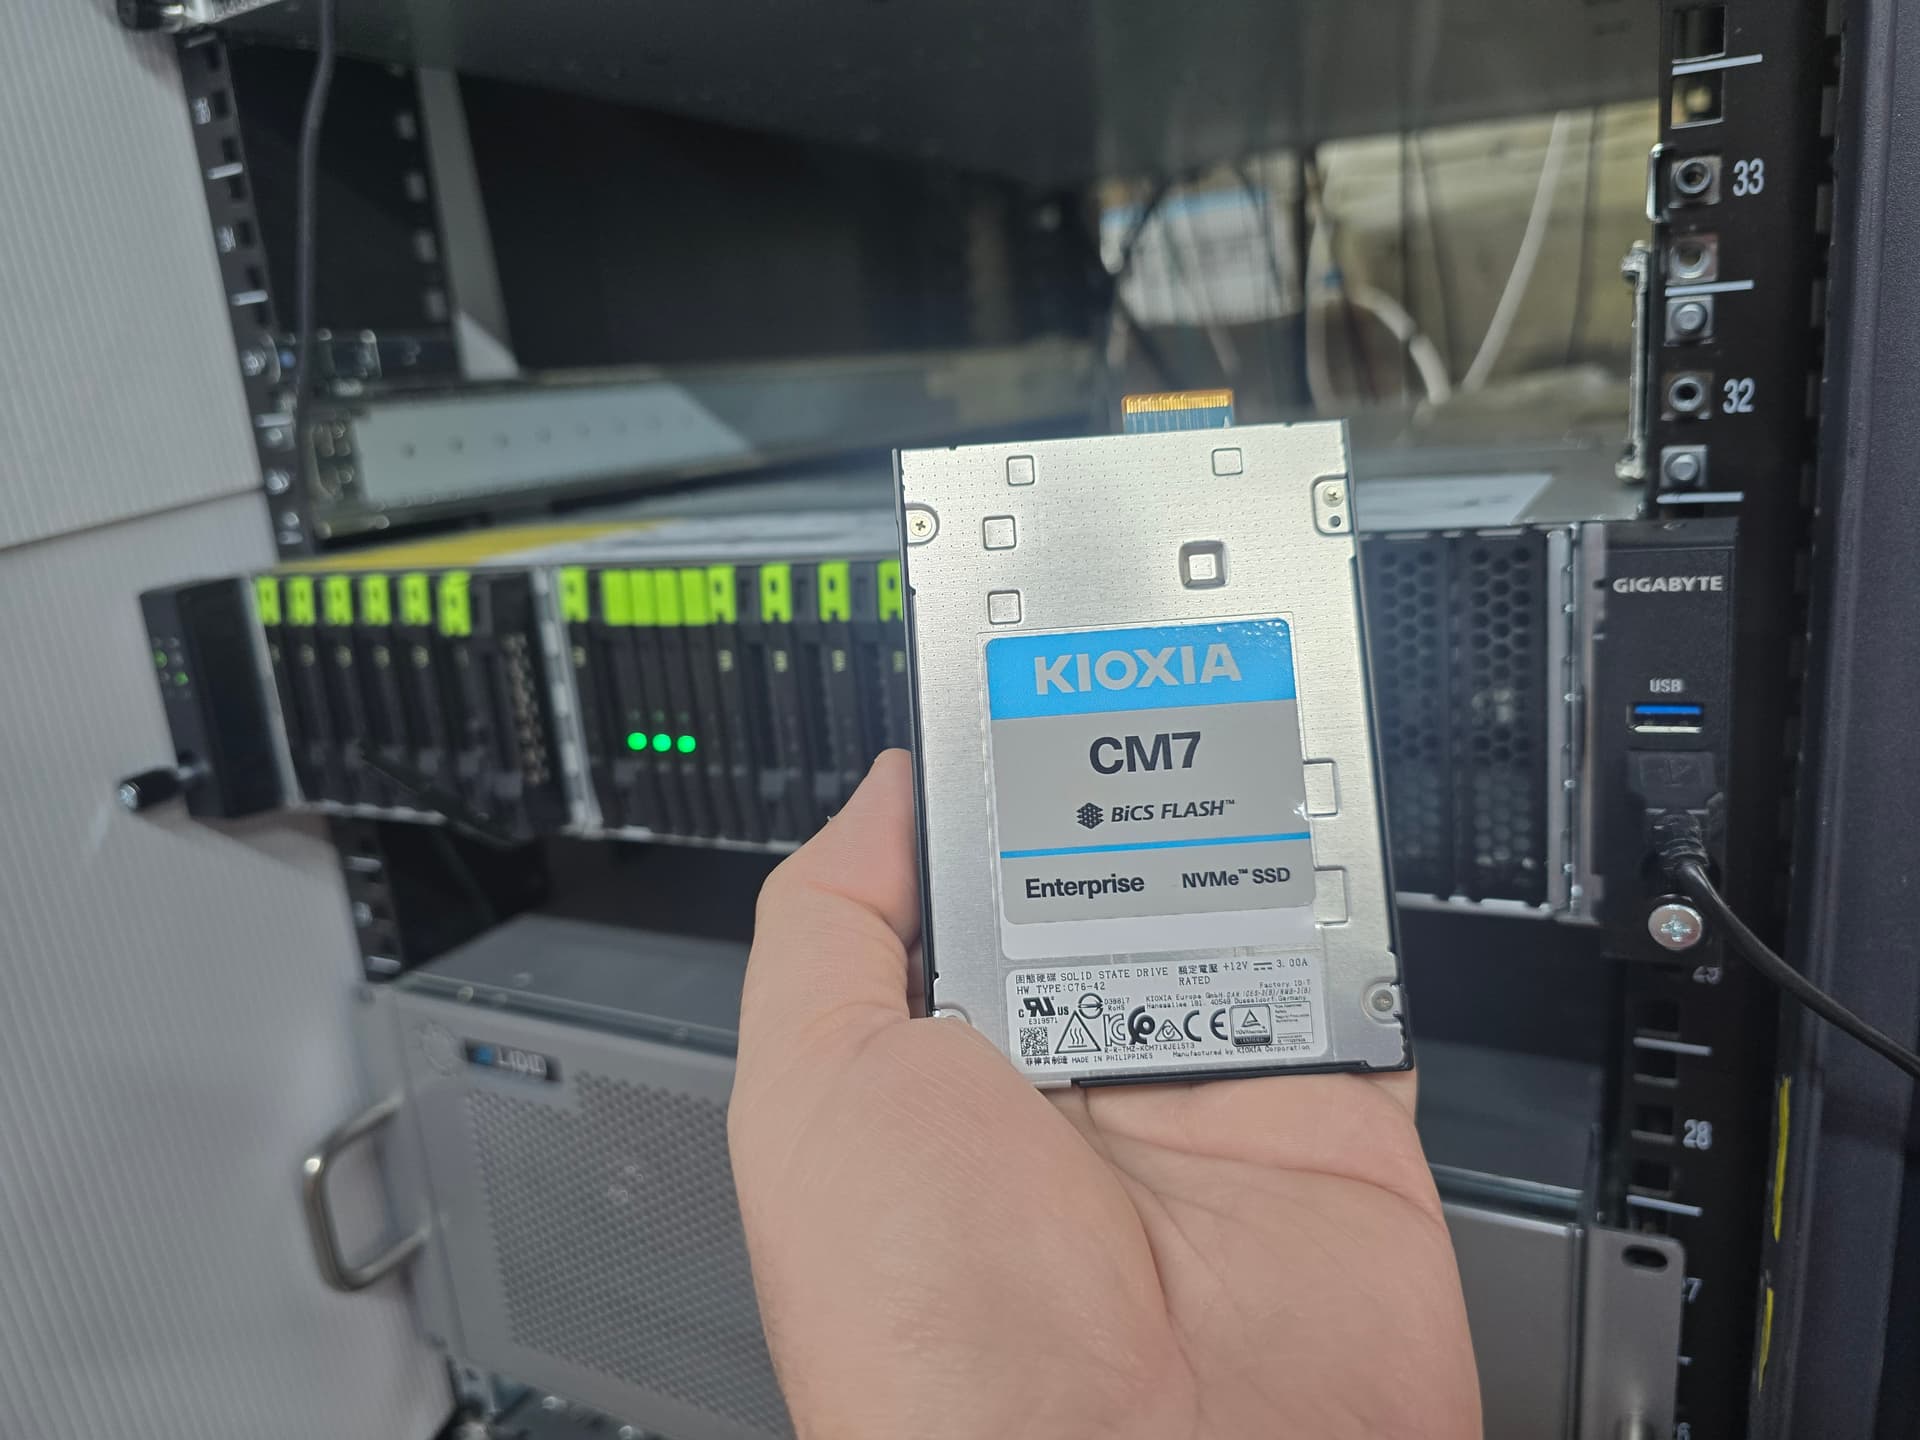
I did most of the testing on a AMD Ryzen Threadripper PRO 7965WX 24-Core with 8x32GB DDR5 Kingston KF560R32-32 DIMMs for a total of 256GB RAM. It also has 4x Crucial CT4000T705SSD3 4TB PCIe Gen 5 NVMe drives configured with mdadm into a striped RAID0 array for maximum read performance.
Baseline Benchmarks
I used some publicly available benchmarking tools to get a feel for performance of the various hardware components.
RAM
Grab intel’s memory latency checker (mlc) for basically a Linux version of AIDA64 more or less.
This test shows about 225-250GB/s aggregate RAM i/o bandwidth and ~95ns latency.
$ echo 4000 | sudo tee /proc/sys/vm/nr_hugepages
$ sudo ./Linux/mlc | tee -a output.log

Intel(R) Memory Latency Checker - v3.11b
Measuring idle latencies for random access (in ns)...
                Numa node
Numa node            0
       0          95.3

Measuring Peak Injection Memory Bandwidths for the system
Bandwidths are in MB/sec (1 MB/sec = 1,000,000 Bytes/sec)
Using all the threads from each core if Hyper-threading is enabled
Using traffic with the following read-write ratios
ALL Reads        :      224438.0
3:1 Reads-Writes :      254061.5
2:1 Reads-Writes :      248663.7
1:1 Reads-Writes :      227839.2
Stream-triad like:      250344.9

Measuring Memory Bandwidths between nodes within system
Bandwidths are in MB/sec (1 MB/sec = 1,000,000 Bytes/sec)
Using all the threads from each core if Hyper-threading is enabled
Using Read-only traffic type
                Numa node
Numa node            0
       0        221419.9

Measuring Loaded Latencies for the system
Using all the threads from each core if Hyper-threading is enabled
Using Read-only traffic type
Inject  Latency Bandwidth
Delay   (ns)    MB/sec
==========================
 00000  412.79   222680.1
 00002  417.48   222670.9
 00008  429.14   222643.9
 00015  429.00   222613.8
 00050  430.61   222542.4
 00100  426.57   222426.4
 00200  113.76   138084.6
 00300  111.73    92931.0
 00400  110.78    68318.5
 00500  110.33    55330.5
 00700  109.71    39991.5
 01000  109.29    28329.2
 01300  105.82    22024.3
 01700  104.64    17036.3
 02500  104.34    11811.4
 03500  104.20     8626.4
 05000  104.12     6229.8
 09000  103.99     3739.3
 20000  103.91     2023.0

Measuring cache-to-cache transfer latency (in ns)...
Local Socket L2->L2 HIT  latency        18.3
Local Socket L2->L2 HITM latency        18.3
Next I grabbed google multichase and compiled it for another look at RAM latency suggesting about 90ns.
$ ./multichase -m 1g -n 20
89.694
NVMe RAID0 Array
Here is how I setup the RAID0 array and did some basic fio tests to get a feel for out of the box unoptimized performance on normal ext4 filesystem.
There may be some limited gains to be had using other file systems, changing chunk size, and tuning other knobs. But without an O_DIRECT unbuffered llama.cpp implementation the tons of page faults incurred for running an LLM too big to fit into RAM will still be the bottleneck. This is why for now, get more RAM not more SSDs…
$ mdadm --version
mdadm - v4.3 - 2024-02-15 - Ubuntu 4.3-1ubuntu2.1

# Good reference guide
# https://www.jeffgeerling.com/blog/2021/htgwa-create-raid-array-linux-mdadm

$ sudo wipefs --all --force /dev/nvme0n1
$ sudo wipefs --all --force /dev/nvme1n1
$ sudo wipefs --all --force /dev/nvme2n1
$ sudo wipefs --all --force /dev/nvme3n1

# partition_number:partition_start:partition_end
$ sudo sgdisk -n 1:0:0 /dev/nvme0n1
Creating new GPT entries in memory.
The operation has completed successfully.
$ sudo sgdisk -n 1:0:0 /dev/nvme1n1
Creating new GPT entries in memory.
The operation has completed successfully.
$ sudo sgdisk -n 1:0:0 /dev/nvme2n1
Creating new GPT entries in memory.
The operation has completed successfully.
$ sudo sgdisk -n 1:0:0 /dev/nvme3n1
Creating new GPT entries in memory.
The operation has completed successfully.

$ sudo mdadm --create --verbose /dev/md0 --level=0 --raid-devices=4 /dev/nvme0n1p1 /dev/nvme1n1p1 /dev/nvme2n1p1 /dev/nvme3n1p1
mdadm: chunk size defaults to 512K
mdadm: Defaulting to version 1.2 metadata
mdadm: array /dev/md0 started.

$ cat /proc/mdstat
Personalities : [raid0]
md0 : active raid0 nvme3n1p1[3] nvme2n1p1[2] nvme1n1p1[1] nvme0n1p1[0]
      15627540480 blocks super 1.2 512k chunks

$ sudo mdadm --detail /dev/md0
/dev/md0:
           Version : 1.2
     Creation Time : Fri Feb  7 16:13:27 2025
        Raid Level : raid0
        Array Size : 15627540480 (14.55 TiB 16.00 TB)
      Raid Devices : 4
     Total Devices : 4
       Persistence : Superblock is persistent

       Update Time : Fri Feb  7 16:13:27 2025
             State : clean
    Active Devices : 4
   Working Devices : 4
    Failed Devices : 0
     Spare Devices : 0

            Layout : original
        Chunk Size : 512K

Consistency Policy : none

              Name : wTR24:0  (local to host wTR24)
              UUID : 5416209d:671789ee:296e46b5:bfa09730
            Events : 0

    Number   Major   Minor   RaidDevice State
       0     259        8        0      active sync   /dev/nvme0n1p1
       1     259        9        1      active sync   /dev/nvme1n1p1
       2     259       10        2      active sync   /dev/nvme2n1p1
       3     259       11        3      active sync   /dev/nvme3n1p1

$ sudo mkfs.ext4 -m 0 -E lazy_itable_init=0,lazy_journal_init=0 /dev/md0
fio random read IOPS
Almost 18GB/sec
# non destructive unbuffered random read 4k IOPS benchmark
$ sudo fio \
      --filename=/dev/md0 \
      --readonly \
      --rw=randread \
      --direct=1 \
      --bs=4k \
      --ioengine=libaio \
      --runtime=60 \
      --numjobs=24 \
      --time_based=1 \
      --group_reporting \
      --name=IOPS_4k \
      --iodepth=32

IOPS_4k: (g=0): rw=randread, bs=(R) 4096B-4096B, (W) 4096B-4096B, (T) 4096B-4096B, ioengine=libaio, iodepth=32
...
fio-3.36
Starting 24 processes
Jobs: 24 (f=24): [r(24)][100.0%][r=16.7GiB/s][r=4374k IOPS][eta 00m:00s]
IOPS_4k: (groupid=0, jobs=24): err= 0: pid=559472: Sun Feb  9 18:36:39 2025
  read: IOPS=4352k, BW=16.6GiB/s (17.8GB/s)(996GiB/60001msec)
    slat (usec): min=2, max=3964, avg= 3.54, stdev= 2.95
    clat (nsec): min=580, max=4484.0k, avg=172308.91, stdev=108153.11
     lat (usec): min=10, max=4488, avg=175.85, stdev=108.20
    clat percentiles (usec):
     |  1.00th=[   21],  5.00th=[   41], 10.00th=[   59], 20.00th=[   83],
     | 30.00th=[  101], 40.00th=[  122], 50.00th=[  147], 60.00th=[  176],
     | 70.00th=[  212], 80.00th=[  262], 90.00th=[  330], 95.00th=[  375],
     | 99.00th=[  461], 99.50th=[  523], 99.90th=[  725], 99.95th=[  848],
     | 99.99th=[ 1045]
   bw (  MiB/s): min=15657, max=17387, per=100.00%, avg=17025.63, stdev= 8.68, samples=2856
   iops        : min=4008240, max=4451242, avg=4358560.48, stdev=2220.89, samples=2856
  lat (nsec)   : 750=0.01%, 1000=0.01%
  lat (usec)   : 2=0.01%, 4=0.01%, 10=0.01%, 20=0.85%, 50=6.81%
  lat (usec)   : 100=21.64%, 250=48.59%, 500=21.47%, 750=0.54%, 1000=0.08%
  lat (msec)   : 2=0.01%, 4=0.01%, 10=0.01%
  cpu          : usr=18.33%, sys=74.16%, ctx=16667145, majf=0, minf=1075
  IO depths    : 1=0.1%, 2=0.1%, 4=0.1%, 8=0.1%, 16=0.1%, 32=100.0%, >=64=0.0%
     submit    : 0=0.0%, 4=100.0%, 8=0.0%, 16=0.0%, 32=0.0%, 64=0.0%, >=64=0.0%
     complete  : 0=0.0%, 4=100.0%, 8=0.0%, 16=0.0%, 32=0.1%, 64=0.0%, >=64=0.0%
     issued rwts: total=261127526,0,0,0 short=0,0,0,0 dropped=0,0,0,0
     latency   : target=0, window=0, percentile=100.00%, depth=32

Run status group 0 (all jobs):
   READ: bw=16.6GiB/s (17.8GB/s), 16.6GiB/s-16.6GiB/s (17.8GB/s-17.8GB/s), io=996GiB (1070GB), run=60001-60001msec

Disk stats (read/write):
    md0: ios=261123443/0, sectors=2088987544/0, merge=0/0, ticks=39912514/0, in_queue=39912514, util=99.40%, aggrios=65281881/20, aggsectors=522255054/0, aggrmerge=0/0, aggrticks=9920376/11, aggrin_queue=9920399, aggrutil=90.17%
  nvme3n1: ios=65290024/20, sectors=522320192/0, merge=0/0, ticks=10342006/11, in_queue=10342028, util=89.91%
  nvme0n1: ios=65278033/20, sectors=522224264/0, merge=0/0, ticks=8944765/12, in_queue=8944789, util=89.17%
  nvme1n1: ios=65275278/20, sectors=522202224/0, merge=0/0, ticks=9868045/12, in_queue=9868068, util=90.17%
  nvme2n1: ios=65284192/20, sectors=522273536/0, merge=0/0, ticks=10526690/11, in_queue=10526713, util=89.80%
fio sequential read
Over 40GB/s
# non destructive unbuffered sequential read 1M block size benchmark
$ sudo fio \
      --filename=/dev/md0 \
      --readonly \
      --rw=read \
      --direct=1 \
      --bs=1M \
      --ioengine=libaio \
      --runtime=60 \
      --numjobs=24 \
      --time_based=1 \
      --group_reporting \
      --name=SEQREAD_1M \
      --iodepth=32

SEQREAD_1M: (g=0): rw=read, bs=(R) 1024KiB-1024KiB, (W) 1024KiB-1024KiB, (T) 1024KiB-1024KiB, ioengine=libaio, iodepth=32
...
fio-3.36
Starting 24 processes
Jobs: 24 (f=24): [R(24)][100.0%][r=36.2GiB/s][r=37.1k IOPS][eta 00m:00s]
SEQREAD_1M: (groupid=0, jobs=24): err= 0: pid=573183: Sun Feb  9 19:02:22 2025
  read: IOPS=38.7k, BW=37.8GiB/s (40.6GB/s)(2268GiB/60036msec)
    slat (usec): min=56, max=4832, avg=67.55, stdev=18.88
    clat (usec): min=115, max=150892, avg=19779.55, stdev=16087.13
     lat (usec): min=178, max=150957, avg=19847.10, stdev=16087.35
    clat percentiles (usec):
     |  1.00th=[   676],  5.00th=[  1532], 10.00th=[  1991], 20.00th=[  3359],
     | 30.00th=[  6456], 40.00th=[ 11207], 50.00th=[ 16581], 60.00th=[ 22414],
     | 70.00th=[ 30016], 80.00th=[ 35914], 90.00th=[ 40633], 95.00th=[ 45351],
     | 99.00th=[ 62653], 99.50th=[ 72877], 99.90th=[ 93848], 99.95th=[100140],
     | 99.99th=[122160]
   bw (  MiB/s): min=27217, max=48975, per=100.00%, avg=38728.43, stdev=161.84, samples=2856
   iops        : min=27215, max=48975, avg=38727.16, stdev=161.86, samples=2856
  lat (usec)   : 250=0.05%, 500=0.45%, 750=0.69%, 1000=0.77%
  lat (msec)   : 2=8.10%, 4=12.60%, 10=14.89%, 20=18.32%, 50=41.29%
  lat (msec)   : 100=2.80%, 250=0.05%
  cpu          : usr=0.16%, sys=12.75%, ctx=2147099, majf=0, minf=196995
  IO depths    : 1=0.1%, 2=0.1%, 4=0.1%, 8=0.1%, 16=0.1%, 32=100.0%, >=64=0.0%
     submit    : 0=0.0%, 4=100.0%, 8=0.0%, 16=0.0%, 32=0.0%, 64=0.0%, >=64=0.0%
     complete  : 0=0.0%, 4=100.0%, 8=0.0%, 16=0.0%, 32=0.1%, 64=0.0%, >=64=0.0%
     issued rwts: total=2321962,0,0,0 short=0,0,0,0 dropped=0,0,0,0
     latency   : target=0, window=0, percentile=100.00%, depth=32

Run status group 0 (all jobs):
   READ: bw=37.8GiB/s (40.6GB/s), 37.8GiB/s-37.8GiB/s (40.6GB/s-40.6GB/s), io=2268GiB (2435GB), run=60036-60036msec

Disk stats (read/write):
    md0: ios=18531889/0, sectors=4744163584/0, merge=0/0, ticks=256192726/0, in_queue=256192726, util=100.00%, aggrios=4643924/2, aggsectors=1188844546/0, aggrmerge=0/0, aggrticks=64180507/2, aggrin_queue=64180511, aggrutil=72.41%
  nvme3n1: ios=4643904/2, sectors=1188839424/0, merge=0/0, ticks=134953567/2, in_queue=134953572, util=70.58%
  nvme0n1: ios=4643945/2, sectors=1188849672/0, merge=0/0, ticks=25059323/2, in_queue=25059327, util=72.41%
  nvme1n1: ios=4643944/2, sectors=1188849664/0, merge=0/0, ticks=27630208/2, in_queue=27630212, util=71.25%
  nvme2n1: ios=4643904/2, sectors=1188839424/0, merge=0/0, ticks=69078931/2, in_queue=69078936, util=70.02%
fio buffered llama.cpp mmap() simulation
About 1.5GB/s
This benchmarks simulates running llama.cpp when the model is too big to fit into your RAM + VRAM. The magic of mmap() makes it even possible to do this by juggling data through the Linux Kernel Page Cache.
This buffered i/o bottleneck is why for now you want to keep as much of the model in RAM + VRAM.
I chose 64k to somewhat simulate actual block sizes measured during llama.cpp inferencing. Actual llama.cpp is a little better than this given it isn’t 100% random.
Notes on how I measured that further down the rabbit hole…
$ sudo fio \
      --filename=/dev/md0 \
      --readonly \
      --rw=randread \
      --direct=0 \
      --bs=64k \
      --ioengine=mmap \
      --runtime=60 \
      --numjobs=24 \
      --time_based=1 \
      --group_reporting \
      --name=IOPS_64k_BUFFERED_MMAP \
      --iodepth=1
IOPS_64k_BUFFERED_MMAP: (g=0): rw=randread, bs=(R) 64.0KiB-64.0KiB, (W) 64.0KiB-64.0KiB, (T) 64.0KiB-64.0KiB, ioengine=mmap, iodepth=1
...
fio-3.36
Starting 24 processes
Jobs: 24 (f=24): [r(24)][100.0%][r=1461MiB/s][r=23.4k IOPS][eta 00m:00s]
IOPS_64k_BUFFERED_MMAP: (groupid=0, jobs=24): err= 0: pid=624772: Thu Feb 13 12:37:01 2025
  read: IOPS=21.5k, BW=1346MiB/s (1411MB/s)(78.9GiB/60001msec)
    clat (usec): min=7, max=166280, avg=1113.75, stdev=1271.13
     lat (usec): min=7, max=166280, avg=1113.78, stdev=1271.13
    clat percentiles (usec):
     |  1.00th=[  285],  5.00th=[  306], 10.00th=[  318], 20.00th=[  334],
     | 30.00th=[  375], 40.00th=[  570], 50.00th=[  783], 60.00th=[  979],
     | 70.00th=[ 1254], 80.00th=[ 1663], 90.00th=[ 2409], 95.00th=[ 3195],
     | 99.00th=[ 5080], 99.50th=[ 5735], 99.90th=[ 7046], 99.95th=[ 7898],
     | 99.99th=[30278]
   bw (  MiB/s): min=  619, max= 3834, per=100.00%, avg=1346.99, stdev=22.40, samples=2856
   iops        : min= 9914, max=61352, avg=21551.55, stdev=358.47, samples=2856
  lat (usec)   : 10=0.01%, 20=0.11%, 50=0.01%, 100=0.01%, 250=0.01%
  lat (usec)   : 500=36.44%, 750=11.93%, 1000=12.21%
  lat (msec)   : 2=24.91%, 4=11.76%, 10=2.60%, 20=0.01%, 50=0.01%
  lat (msec)   : 100=0.01%, 250=0.01%
  cpu          : usr=0.86%, sys=80.94%, ctx=20656649, majf=20647760, minf=4009
  IO depths    : 1=100.0%, 2=0.0%, 4=0.0%, 8=0.0%, 16=0.0%, 32=0.0%, >=64=0.0%
     submit    : 0=0.0%, 4=100.0%, 8=0.0%, 16=0.0%, 32=0.0%, 64=0.0%, >=64=0.0%
     complete  : 0=0.0%, 4=100.0%, 8=0.0%, 16=0.0%, 32=0.0%, 64=0.0%, >=64=0.0%
     issued rwts: total=1292171,0,0,0 short=0,0,0,0 dropped=0,0,0,0
     latency   : target=0, window=0, percentile=100.00%, depth=1

Run status group 0 (all jobs):
   READ: bw=1346MiB/s (1411MB/s), 1346MiB/s-1346MiB/s (1411MB/s-1411MB/s), io=78.9GiB (84.7GB), run=60001-60001msec

Disk stats (read/write):
    md0: ios=20593564/0, sectors=164748512/0, merge=0/0, ticks=311541/0, in_queue=311541, util=74.42%, aggrios=5161940/24, aggsectors=41295522/0, aggrmerge=0/0, aggrticks=67192/23, aggrin_queue=67239, aggrutil=28.65%
  nvme3n1: ios=5165040/24, sectors=41320320/0, merge=0/0, ticks=64937/24, in_queue=64985, util=27.60%
  nvme0n1: ios=5160824/24, sectors=41286592/0, merge=0/0, ticks=74396/23, in_queue=74442, util=28.65%
  nvme1n1: ios=5155084/24, sectors=41240672/0, merge=0/0, ticks=64624/23, in_queue=64669, util=27.54%
  nvme2n1: ios=5166813/24, sectors=41334504/0, merge=0/0, ticks=64814/24, in_queue=64862, util=27.52%
sar
Linux System Activity Report tool sar is a powerful tool for BBS sysops  . You can use
 sar not only to print out useful stats, but capture logs to a data file. Then you can use sadf to conver the data file into an interactive .svg image with charts and graphs!
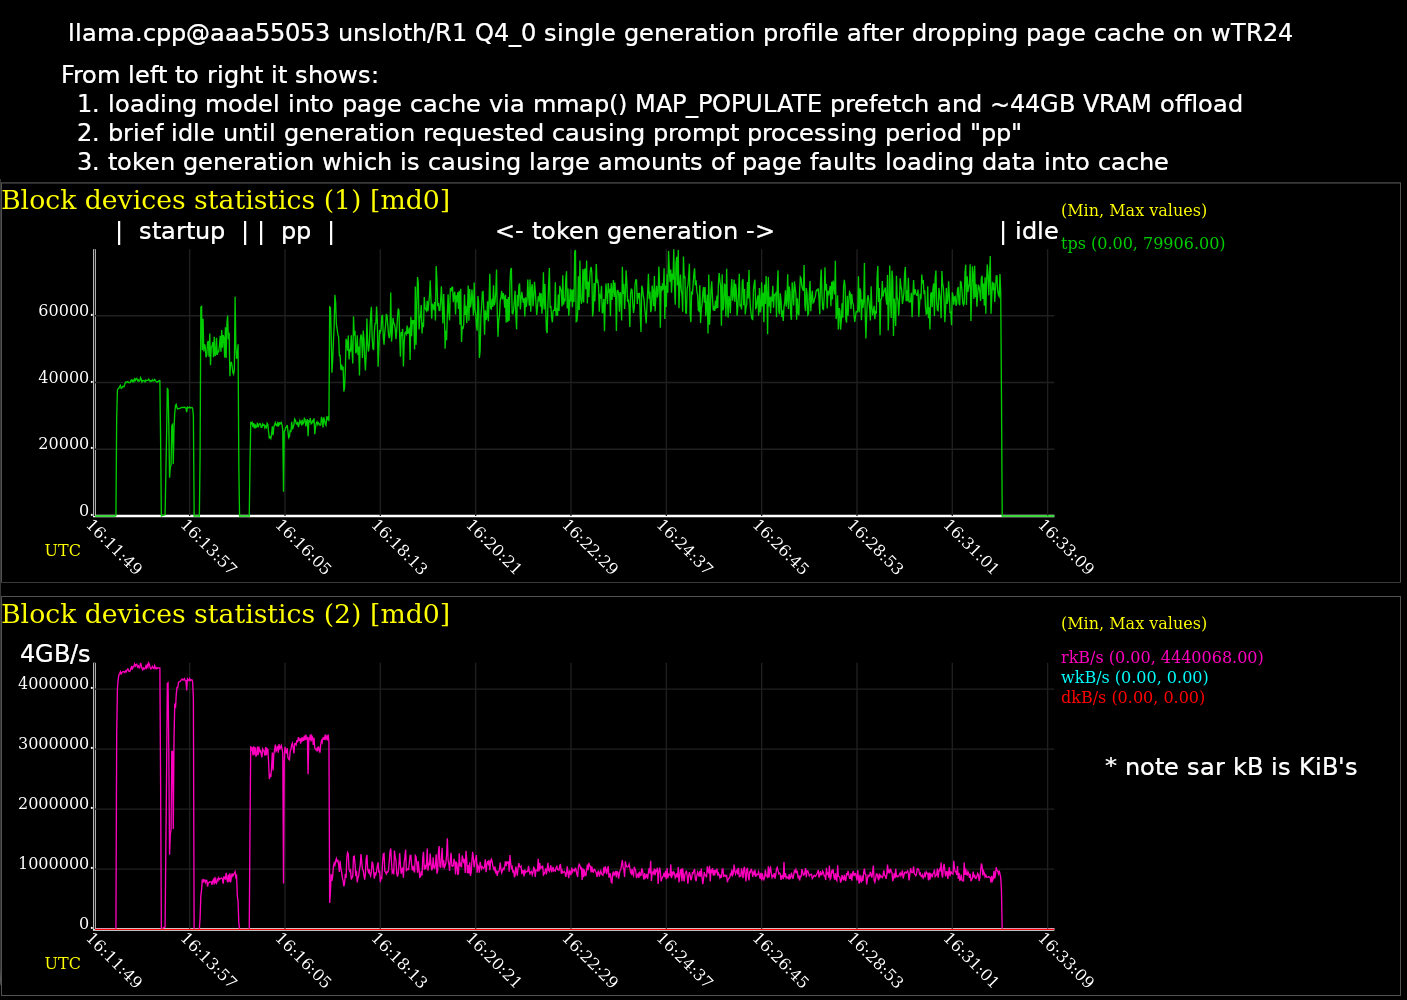
This graph is a time series chart. On the left is the beginning where llama.cpp starts up. As time goes on I’ve labeled the time periods for loading the model, prompt processing, and token generation until it stops.
This test uses a larger Q4_K_M quant weighing in at 377GiB which is too big to fit into the 256GB system RAM. So this test was designed to stress the buffered disk reads and figure out the bottle neck on performance there.
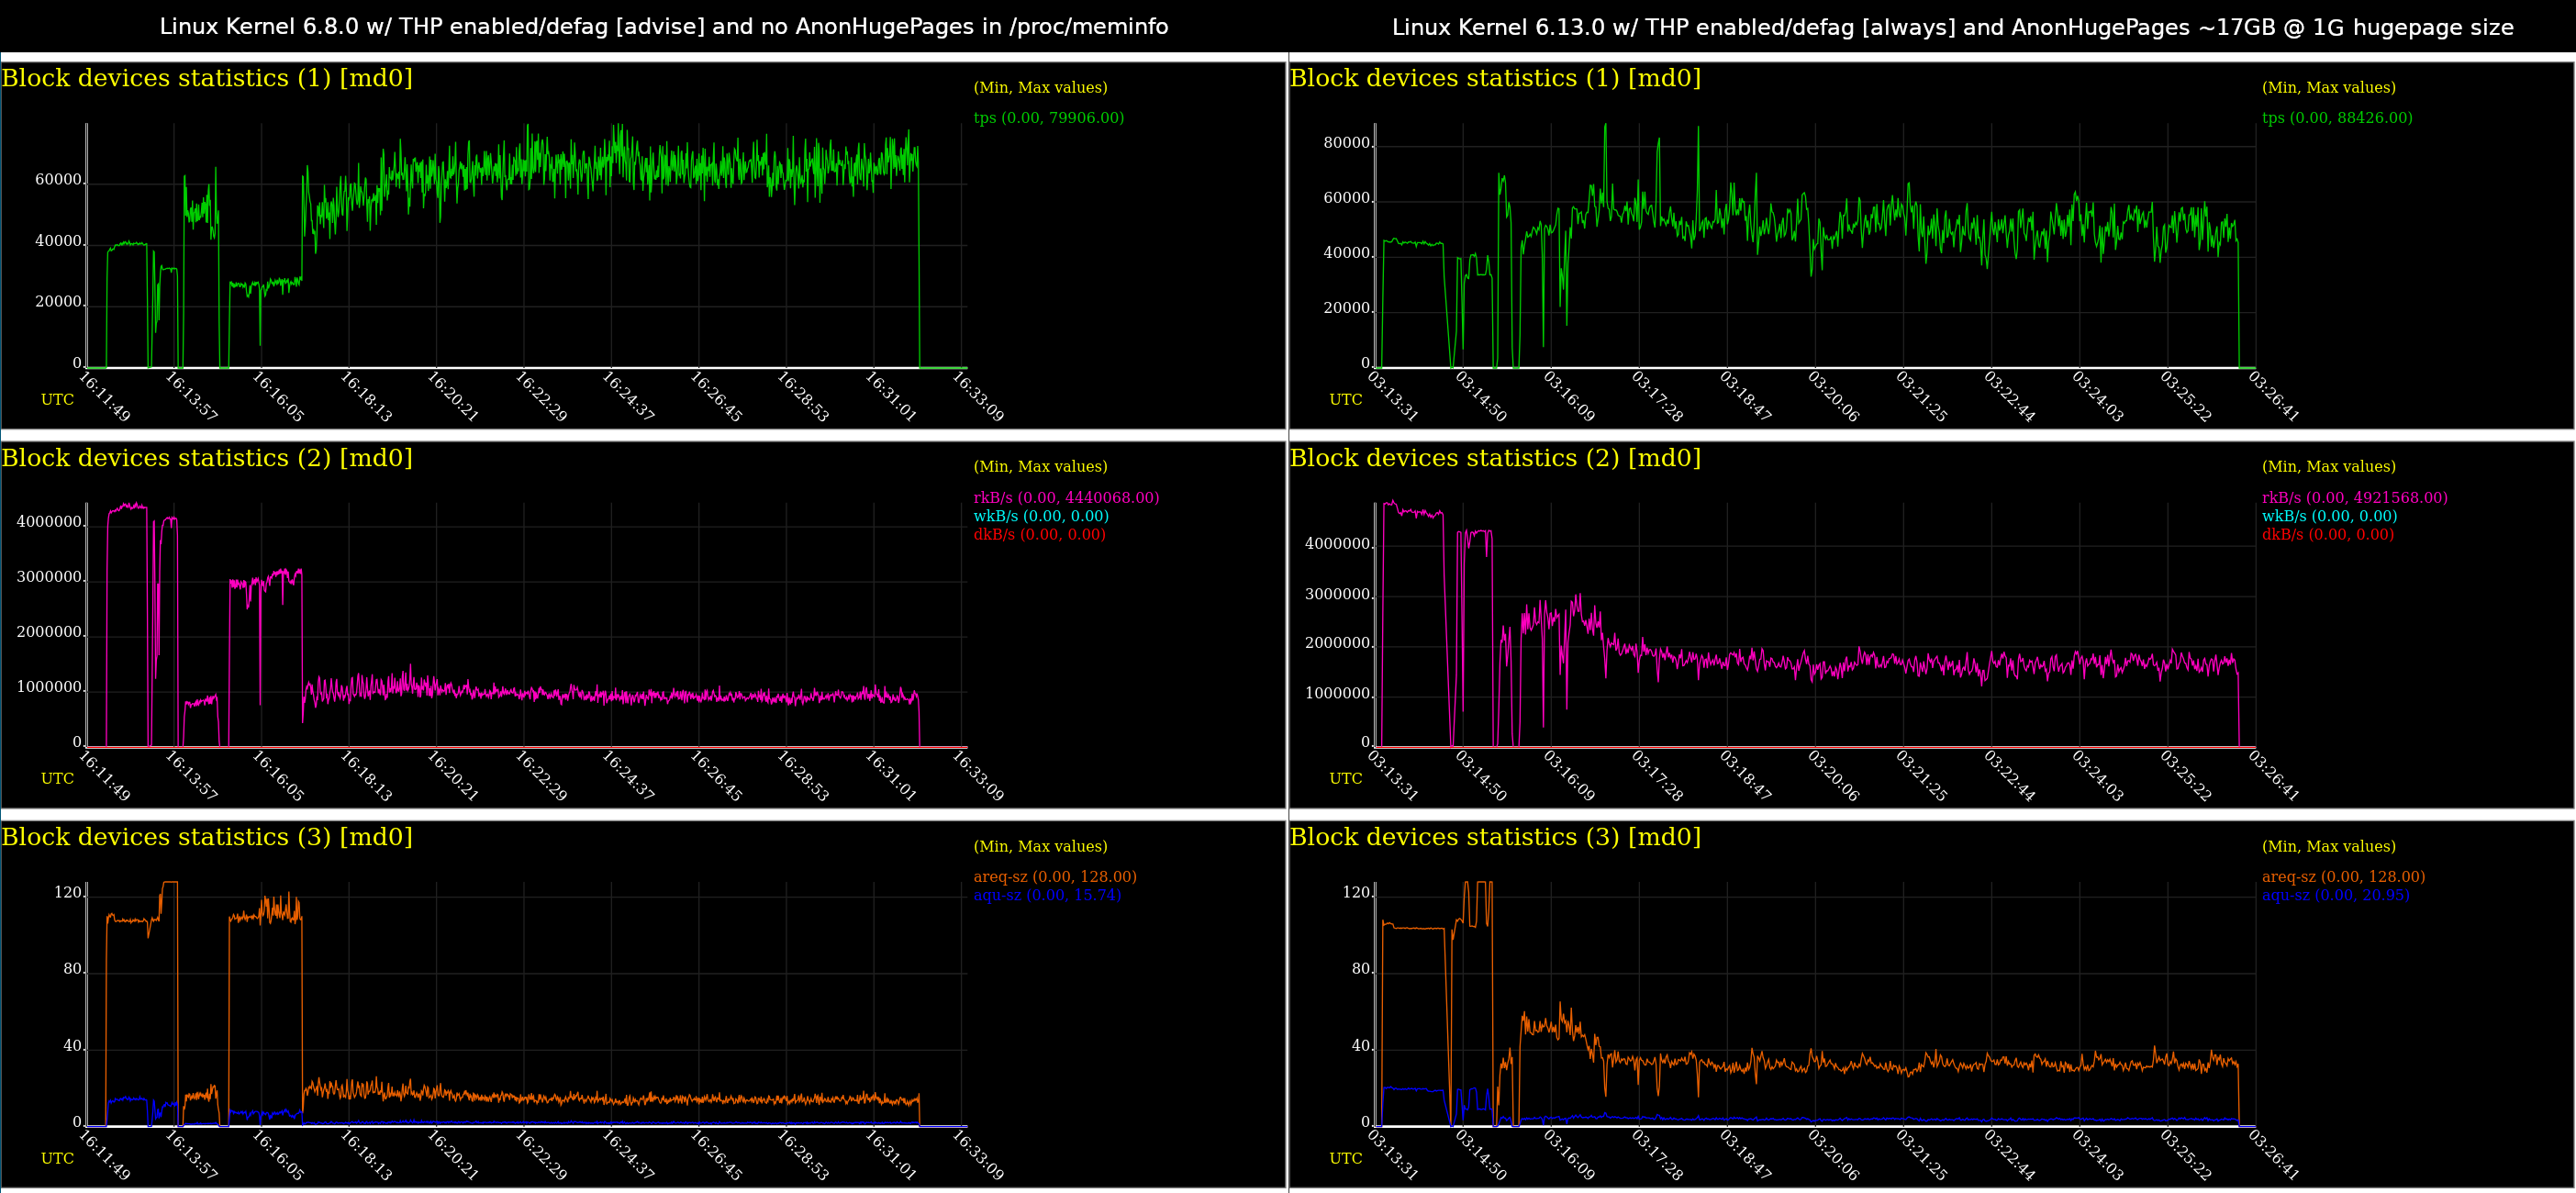
After updating the Linux kernel from 6.8.0 to a fresh 6.13.0 and enabling transparent huge pages, performance improved a bit as shown in this side by side. Left side is same chart as above on 6.8.0, and right side is newer 6.13.0. While slightly better, it isn’t a significant improvement for actual token generation.
There are two .svg files as well if you want more metrics:
Here is how you could generate graphs like this for your own tests:
# install needed packages
$ sudo apt-get install sysstat || pacman -Sy extra/sysstat

# drop linux kernel page cache, cached entries, and inodes
# might take a minute if you have a lot of RAM and stuff cached
sync && echo 3 | sudo tee /proc/sys/vm/drop_caches

# begin capturing
$ sar -d --dev=md0,nvme0n1,nvme1n1,nvme2n1,nvme3n1 -B -q ALL 1 -o sarlog.dat

# do whatever test in another terminal e.g. a llama-server inference test
# hit <cntrl>+c stop stop capturing when done

# generate svg file using same arguments as sar above
$ sadf -g sarlog.dat -O showtoc -- -d --dev=md0,nvme0n1,nvme1n1,nvme2n1,nvme3n1 -B -q ALL > output.svg
You don’t have to use sadf and generate a .svg as the sar will print some useful stuff to the console while it is logging. The next section has some examples.
BPF Performance Tools
One of my sysadmin role models is Brendan Gregg who popularized perf Flame Graphs as well as advanced eBPF Linux Kernel Probe tools. He has a couple fat books available and a useful website as well. The tools are a bit confusing to install, but can be a great way to observe how a user land application interacts with the Linux Kernel systems.
You can measure things like block i/o size, disk latency, sequential vs random i/o, Off-CPU Analysis, cache stats, etc. The advantage of using BPF probes over normal perf is they often have less overhead.
The rest of this mega post is a bunch of these tools measuring various things during llama-bench for both prompt processing as well as token
generation. You can see that each phase of inferencing has a somewhat different profile.
All these measurements were taken with Linux 6.13.0 on the 24 core Threadripper Pro running llama-bench on the Q4_K_M to focus on that buffered read i/o bottleneck.
./build/bin/llama-bench \
    --model /mnt/raid/models/unsloth/DeepSeek-R1-GGUF/DeepSeek-R1-Q4_K_M/DeepSeek-R1-Q4_K_M-00001-of-00009.gguf \
    --cache-type-k q4_0 \
    --cache-type-v f16 \
    --threads 24
| model |
size |
params |
backend |
threads |
type_k |
test |
t/s |
| deepseek2 671B Q4_K - Medium |
376.65 GiB |
671.03 B |
CPU |
24 |
q4_0 |
pp512 |
2.32 ± 0.20 |
| deepseek2 671B Q4_K - Medium |
376.65 GiB |
671.03 B |
CPU |
24 |
q4_0 |
tg128 |
1.12 ± 0.16 |
build: 90e4dba4 (4689)
Install libbpf-tools
# The package situation on Ubuntu is confusing
# https://github.com/iovisor/bcc/blob/master/INSTALL.md#ubuntu---binary
# https://github.com/iovisor/bcc/pull/4940#issuecomment-2645861929
sudo apt-get install libbpf-tools

# i'm using the /usr/sbin/biosnoop ones for example
$ apt-file search /usr/sbin/biosnoop
bpfcc-tools: /usr/sbin/biosnoop-bpfcc
bpftrace: /usr/sbin/biosnoop.bt
libbpf-tools: /usr/sbin/biosnoop
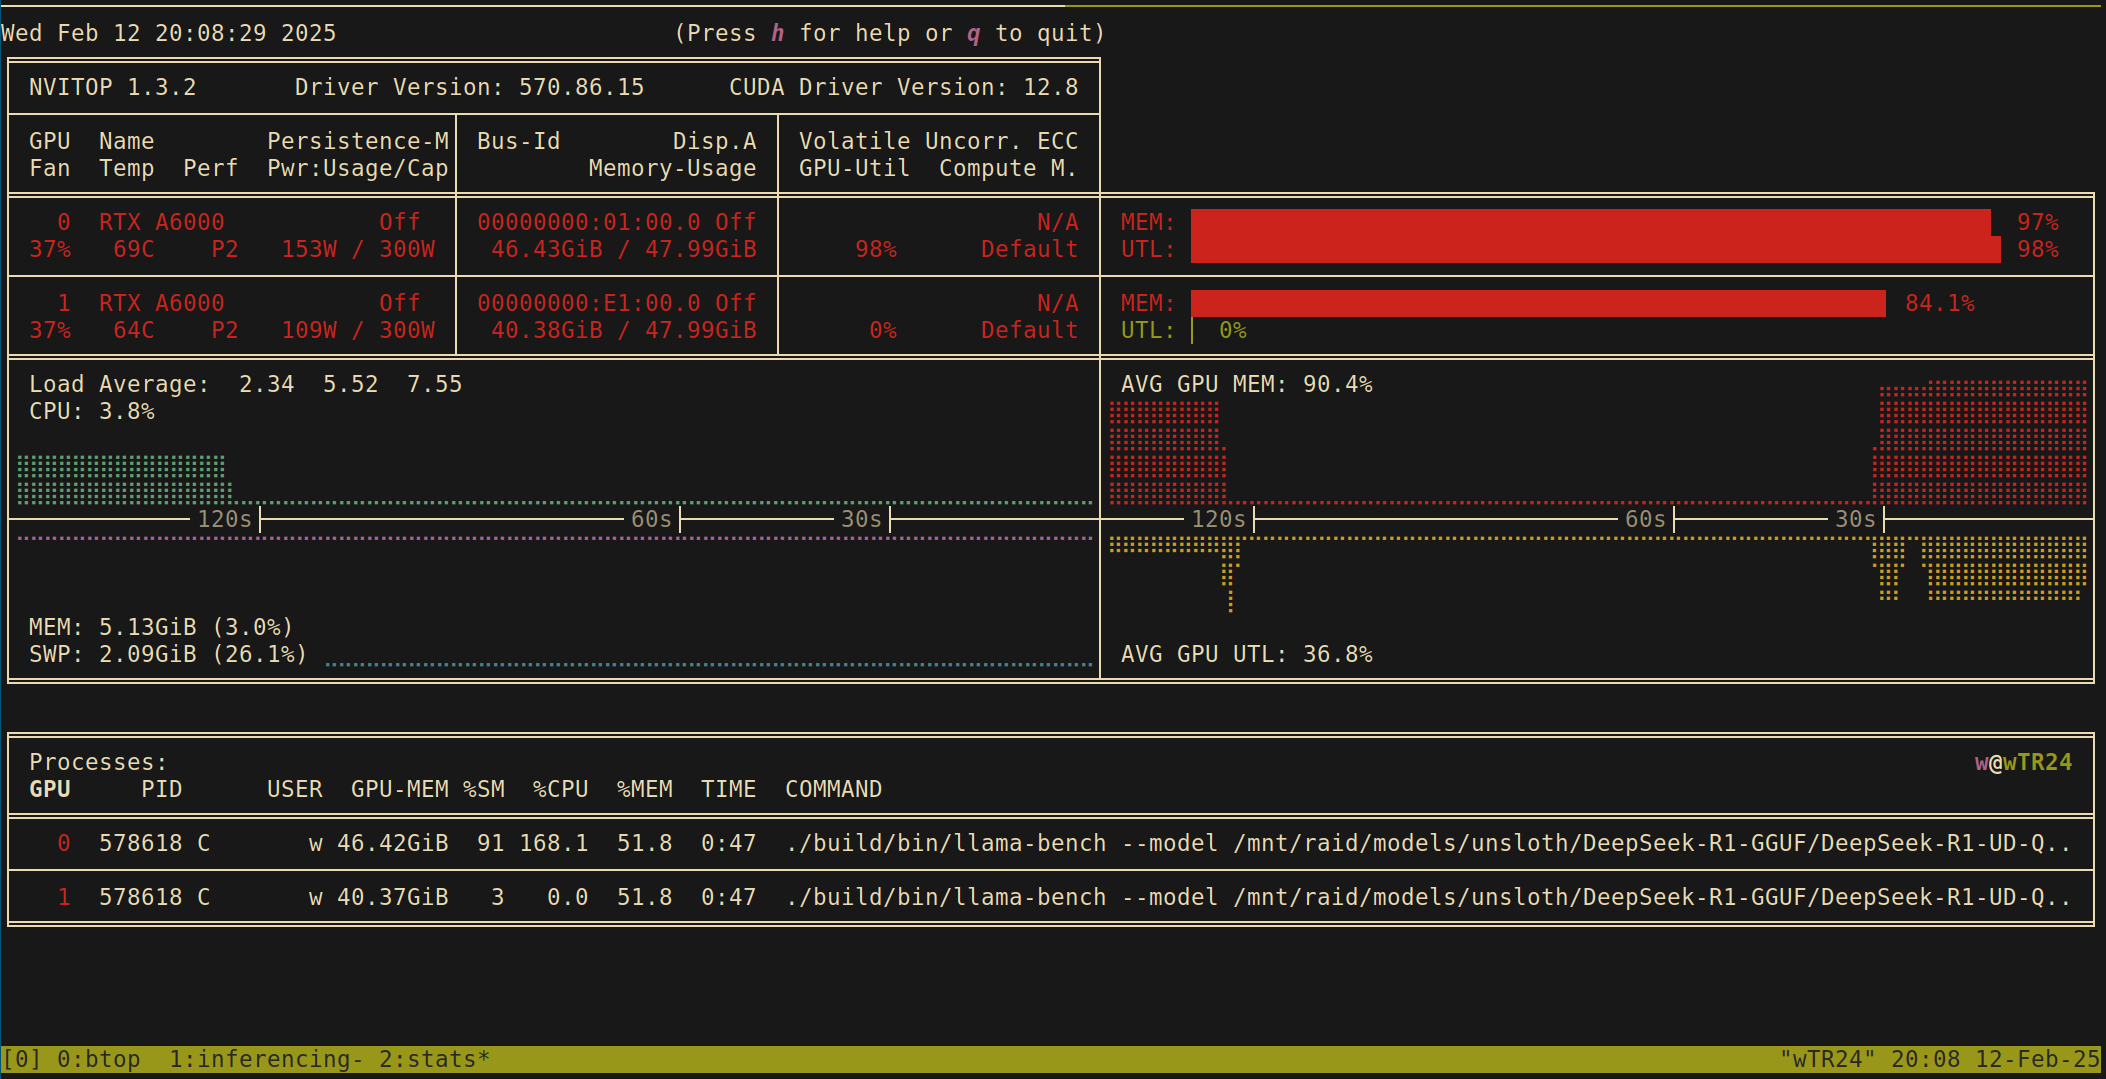
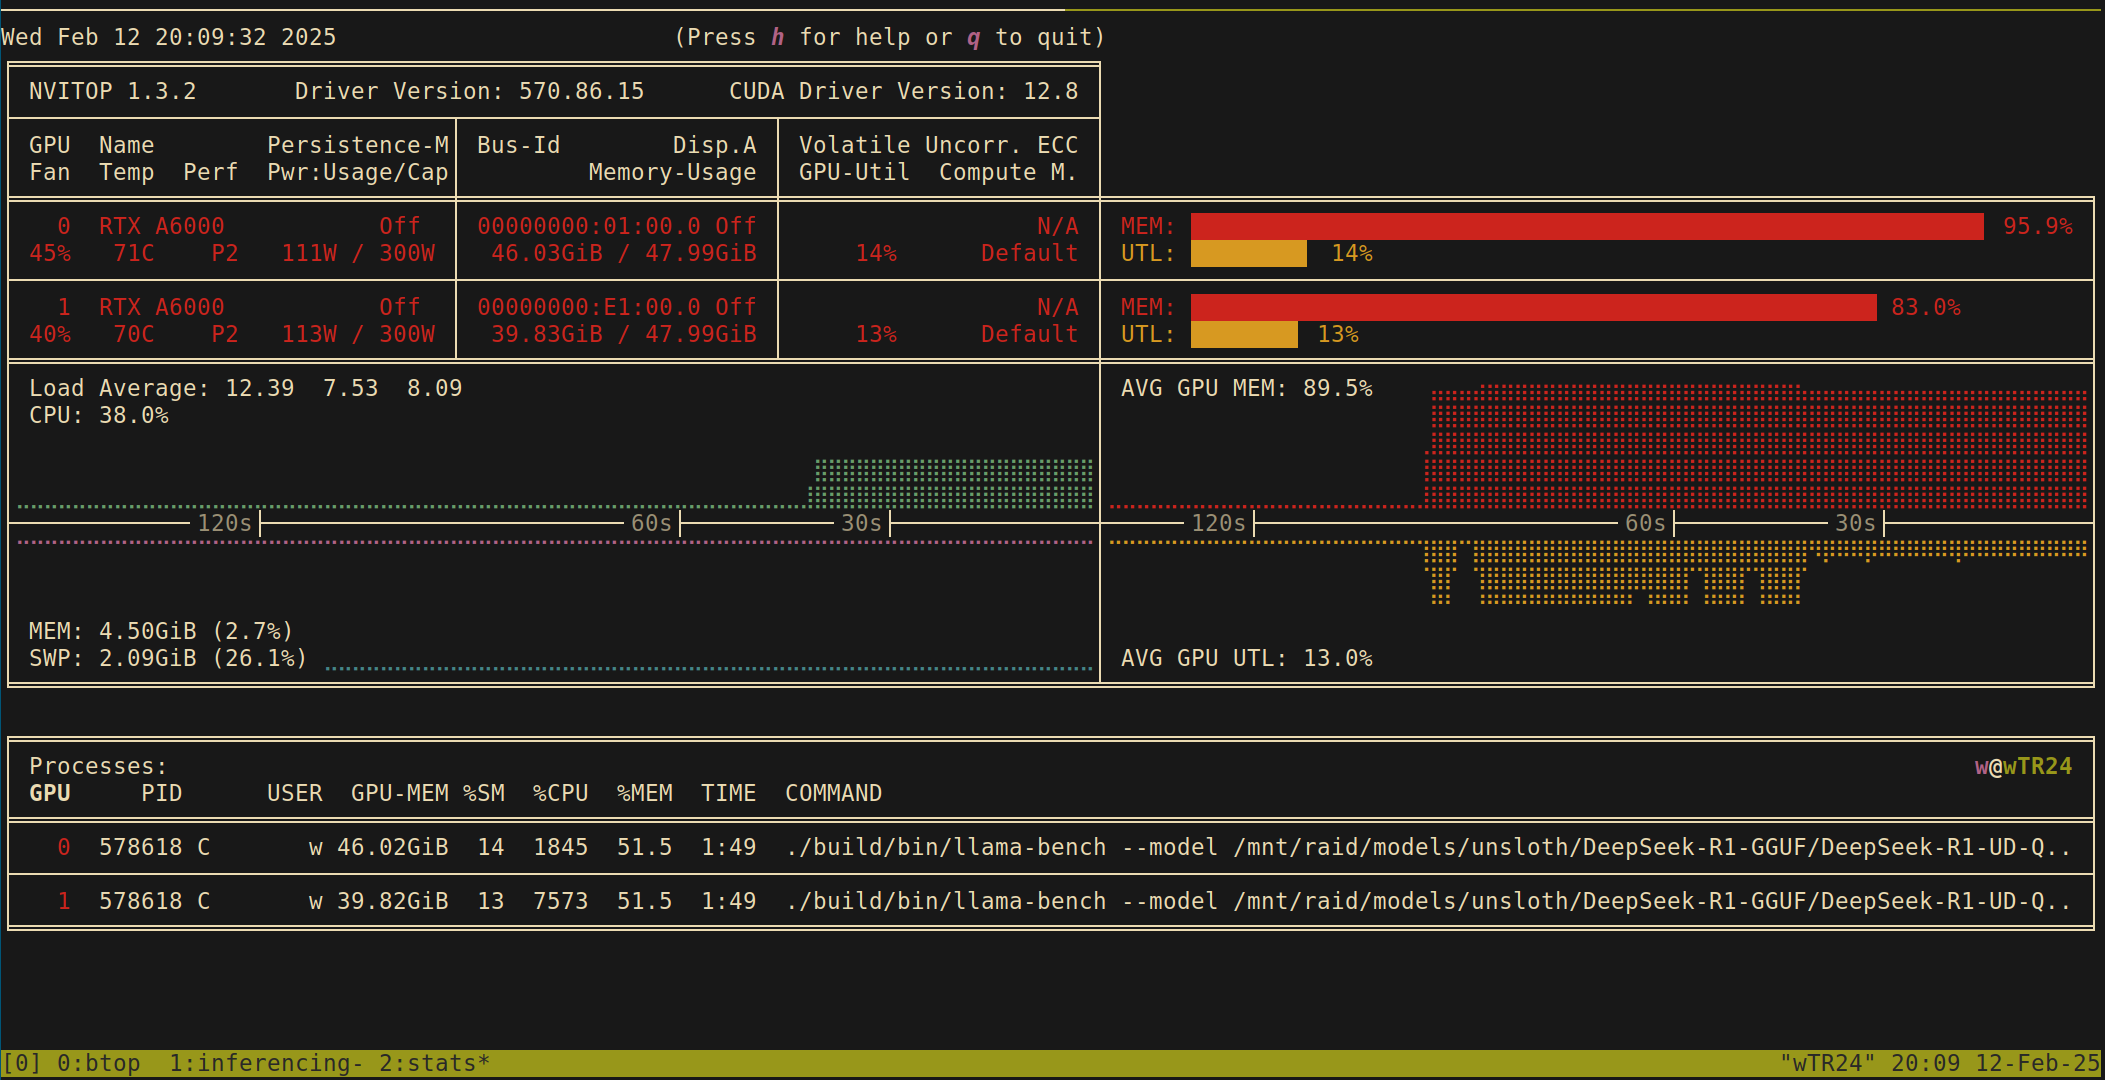
Methodology
Wait for the disk cache to fill up and everything to settle down, then
run the tests twice, once during prompt processing and again for token
generation. Confirm that CPU usage is around 50% with btop or similar.
Then take each measurement and log it.
Repeat as necessary to collect all of the data.
Baseline
Get baseline disk i/o and page cache stats using a more common tool like sar.
Prompt Processing
# sample the disks/raid backing the model for 180 seconds 1 time
$ sar -d --dev=md0,nvme0n1,nvme1n1,nvme2n1,nvme3n1 -B -q ALL 180 1

Linux 6.13.0-061300-generic (wTR24)     02/12/2025      _x86_64_        (48 CPU)

01:43:56 PM  pgpgin/s pgpgout/s   fault/s  majflt/s  pgfree/s pgscank/s pgscand/s pgsteal/s    %vmeff
01:46:56 PM 1336677.96   3894.84  21891.61   2635.86 2371208.87 367155.06  22370.98 667337.86    171.32

01:43:56 PM   runq-sz  plist-sz   ldavg-1   ldavg-5  ldavg-15   blocked
01:46:56 PM        24      1835     24.72     17.01     11.06         0

01:43:56 PM       DEV       tps     rkB/s     wkB/s     dkB/s   areq-sz    aqu-sz     await     %util
01:46:56 PM   nvme5n1    283.17   4181.93   3894.84      0.00     28.52      2.31      8.15      2.05
01:46:56 PM   nvme1n1  19100.67 333147.36      0.00      0.00     17.44      0.72      0.04     14.20
01:46:56 PM   nvme0n1  18782.46 333234.49      0.00      0.00     17.74      0.99      0.05     14.97
01:46:56 PM   nvme2n1  19364.39 332987.67      0.00      0.00     17.20      0.74      0.04     14.07
01:46:56 PM   nvme3n1  19495.42 332798.36      0.00      0.00     17.07      0.75      0.04     13.96
01:46:56 PM       md0  76849.94 1332167.78      0.00      0.00     17.33      3.05      0.04     73.67

01:43:56 PM  %scpu-10  %scpu-60 %scpu-300     %scpu
01:46:56 PM      0.00      0.00      0.00      0.02

01:43:56 PM   %sio-10   %sio-60  %sio-300      %sio   %fio-10   %fio-60  %fio-300      %fio
01:46:56 PM      0.00      0.17      0.12      0.65      0.00      0.14      0.10      0.64

01:43:56 PM  %smem-10  %smem-60 %smem-300     %smem  %fmem-10  %fmem-60 %fmem-300     %fmem
01:46:56 PM      1.79      2.57      4.34      3.29      1.79      2.57      4.34      3.29
Token Generation
$ sar -d --dev=md0,nvme0n1,nvme1n1,nvme2n1,nvme3n1 -B -q ALL 180 1

Linux 6.13.0-061300-generic (wTR24)     02/12/2025      _x86_64_        (48 CPU)

03:13:58 PM  pgpgin/s pgpgout/s   fault/s  majflt/s  pgfree/s pgscank/s pgscand/s pgsteal/s    %vmeff
03:16:58 PM 1595231.85    188.96  24359.67   5846.29 1818449.61 412689.57  39633.53 798180.86    176.46

03:13:58 PM   runq-sz  plist-sz   ldavg-1   ldavg-5  ldavg-15   blocked
03:16:58 PM         1      1837     24.42     24.44     23.35        19

03:13:58 PM       DEV       tps     rkB/s     wkB/s     dkB/s   areq-sz    aqu-sz     await     %util
03:16:58 PM   nvme1n1  22941.29 398430.58      0.00      0.00     17.37      1.06      0.05     13.77
03:16:58 PM   nvme0n1  22536.70 398376.89      0.00      0.00     17.68      1.56      0.07     15.28
03:16:58 PM   nvme2n1  22890.26 398587.04      0.00      0.00     17.41      1.06      0.05     13.76
03:16:58 PM   nvme3n1  22838.09 398251.42      0.00      0.00     17.44      1.06      0.05     13.79
03:16:58 PM       md0  91373.23 1593645.27      0.00      0.00     17.44      4.50      0.05     65.69

03:13:58 PM  %scpu-10  %scpu-60 %scpu-300     %scpu
03:16:58 PM      0.00      0.00      0.00      0.05

03:13:58 PM   %sio-10   %sio-60  %sio-300      %sio   %fio-10   %fio-60  %fio-300      %fio
03:16:58 PM      0.00      0.17      0.54      0.90      0.00      0.17      0.54      0.89

03:13:58 PM  %smem-10  %smem-60 %smem-300     %smem  %fmem-10  %fmem-60 %fmem-300     %fmem
03:16:58 PM      4.69      3.63      3.45      4.79      4.69      3.63      3.45      4.79
Block i/o size
Summarize block device I/O size as a histogram.
Prompt Processing
$ sudo bitesize -c llama-bench 180 1

Process Name = llama-bench
     Kbytes              : count    distribution
         0 -> 1          : 0        |                                        |
         2 -> 3          : 0        |                                        |
         4 -> 7          : 6019517  |****************************************|
         8 -> 15         : 3953364  |**************************              |
        16 -> 31         : 1914791  |************                            |
        32 -> 63         : 1011460  |******                                  |
        64 -> 127        : 604708   |****                                    |
       128 -> 255        : 378287   |**                                      |
Token Generation
$ sudo bitesize -c llama-bench 180 1

Process Name = llama-bench
     Kbytes              : count    distribution
         0 -> 1          : 0        |                                        |
         2 -> 3          : 0        |                                        |
         4 -> 7          : 7742863  |****************************************|
         8 -> 15         : 4567127  |***********************                 |
        16 -> 31         : 1938310  |**********                              |
        32 -> 63         : 869145   |****                                    |
        64 -> 127        : 639664   |***                                     |
       128 -> 255        : 626360   |***                                     |
Block i/o latency
Summarize block device I/O latency as a histogram.
Prompt Processing
$ sudo biolatency -T -D 180 1

disk = nvme0n1
     usecs               : count    distribution
         0 -> 1          : 0        |                                        |
         2 -> 3          : 0        |                                        |
         4 -> 7          : 870744   |***************************             |
         8 -> 15         : 1250919  |****************************************|
        16 -> 31         : 192358   |******                                  |
        32 -> 63         : 144834   |****                                    |
        64 -> 127        : 527912   |****************                        |
       128 -> 255        : 328101   |**********                              |
       256 -> 511        : 77128    |**                                      |
       512 -> 1023       : 4002     |                                        |
      1024 -> 2047       : 14       |                                        |
      2048 -> 4095       : 5        |                                        |

disk = nvme1n1
     usecs               : count    distribution
         0 -> 1          : 0        |                                        |
         2 -> 3          : 0        |                                        |
         4 -> 7          : 909798   |***************************             |
         8 -> 15         : 1340334  |****************************************|
        16 -> 31         : 212264   |******                                  |
        32 -> 63         : 337110   |**********                              |
        64 -> 127        : 475752   |**************                          |
       128 -> 255        : 146569   |****                                    |
       256 -> 511        : 27103    |                                        |
       512 -> 1023       : 708      |                                        |
      1024 -> 2047       : 3        |                                        |
      2048 -> 4095       : 4        |                                        |

disk = nvme2n1
     usecs               : count    distribution
         0 -> 1          : 0        |                                        |
         2 -> 3          : 0        |                                        |
         4 -> 7          : 923536   |***************************             |
         8 -> 15         : 1366403  |****************************************|
        16 -> 31         : 214847   |******                                  |
        32 -> 63         : 349386   |**********                              |
        64 -> 127        : 481452   |**************                          |
       128 -> 255        : 147123   |****                                    |
       256 -> 511        : 27168    |                                        |
       512 -> 1023       : 591      |                                        |
      1024 -> 2047       : 9        |                                        |
      2048 -> 4095       : 1        |                                        |

disk = nvme3n1
     usecs               : count    distribution
         0 -> 1          : 0        |                                        |
         2 -> 3          : 0        |                                        |
         4 -> 7          : 920670   |***************************             |
         8 -> 15         : 1361679  |****************************************|
        16 -> 31         : 217317   |******                                  |
        32 -> 63         : 356585   |**********                              |
        64 -> 127        : 488626   |**************                          |
       128 -> 255        : 149823   |****                                    |
       256 -> 511        : 27308    |                                        |
       512 -> 1023       : 694      |                                        |
      1024 -> 2047       : 5        |                                        |
      2048 -> 4095       : 1        |                                        |
Token Generation
$ sudo biolatency -T -D 180 1

disk = nvme0n1
     usecs               : count    distribution
         0 -> 1          : 0        |                                        |
         2 -> 3          : 0        |                                        |
         4 -> 7          : 1770055  |****************************************|
         8 -> 15         : 588660   |*************                           |
        16 -> 31         : 107722   |**                                      |
        32 -> 63         : 173490   |***                                     |
        64 -> 127        : 550676   |************                            |
       128 -> 255        : 488273   |***********                             |
       256 -> 511        : 156297   |***                                     |
       512 -> 1023       : 11933    |                                        |
      1024 -> 2047       : 161      |                                        |
      2048 -> 4095       : 39       |                                        |
      4096 -> 8191       : 49       |                                        |

disk = nvme1n1
     usecs               : count    distribution
         0 -> 1          : 0        |                                        |
         2 -> 3          : 0        |                                        |
         4 -> 7          : 1918463  |****************************************|
         8 -> 15         : 668260   |*************                           |
        16 -> 31         : 121909   |**                                      |
        32 -> 63         : 358798   |*******                                 |
        64 -> 127        : 494699   |**********                              |
       128 -> 255        : 246599   |*****                                   |
       256 -> 511        : 55995    |*                                       |
       512 -> 1023       : 1480     |                                        |
      1024 -> 2047       : 160      |                                        |
      2048 -> 4095       : 60       |                                        |
      4096 -> 8191       : 19       |                                        |

disk = nvme2n1
     usecs               : count    distribution
         0 -> 1          : 0        |                                        |
         2 -> 3          : 0        |                                        |
         4 -> 7          : 1920661  |****************************************|
         8 -> 15         : 669311   |*************                           |
        16 -> 31         : 122003   |**                                      |
        32 -> 63         : 356457   |*******                                 |
        64 -> 127        : 492837   |**********                              |
       128 -> 255        : 246685   |*****                                   |
       256 -> 511        : 54411    |*                                       |
       512 -> 1023       : 1674     |                                        |
      1024 -> 2047       : 175      |                                        |
      2048 -> 4095       : 47       |                                        |
      4096 -> 8191       : 47       |                                        |

disk = nvme3n1
     usecs               : count    distribution
         0 -> 1          : 0        |                                        |
         2 -> 3          : 0        |                                        |
         4 -> 7          : 1910195  |****************************************|
         8 -> 15         : 673350   |**************                          |
        16 -> 31         : 122117   |**                                      |
        32 -> 63         : 355674   |*******                                 |
        64 -> 127        : 496290   |**********                              |
       128 -> 255        : 247926   |*****                                   |
       256 -> 511        : 55412    |*                                       |
       512 -> 1023       : 1825     |                                        |
      1024 -> 2047       : 115      |                                        |
      2048 -> 4095       : 58       |                                        |
      4096 -> 8191       : 24       |                                        |
Block i/o Top
Trace file reads/writes by process.
Prompt Processing
$ sudo biotop --pid=$(pidof llama-bench) 180 1

PID     COMM             D MAJ MIN DISK       I/O  Kbytes  AVGms
463986  llama-bench      R 259 6   nvme0n1  3323356 61527016   0.05
463986  llama-bench      R 259 4   nvme1n1  3390545 61579280   0.03
463986  llama-bench      R 259 7   nvme2n1  3446108 61477652   0.03
463986  llama-bench      R 259 10  nvme3n1  3464197 61390536   0.03
Token Generation
$ sudo biotop --pid=$(pidof llama-bench) 180 1

PID     COMM             D MAJ MIN DISK       I/O  Kbytes  AVGms
483569  llama-bench      R 259 6   nvme0n1  3828846 64984816   0.06
483569  llama-bench      R 259 4   nvme1n1  3849134 64995000   0.04
483569  llama-bench      R 259 7   nvme2n1  3846462 64923580   0.04
483569  llama-bench      R 259 10  nvme3n1  3846248 64986828   0.04
Block i/o Pattern
Show block device I/O pattern.
Prompt Processing
$ sudo biopattern -T 180 1

TIME      DISK     %RND  %SEQ    COUNT     KBYTES
14:01:53  nvme0n1    35    64  3345173   62683820
14:01:53  nvme1n1    32    67  3404623   62661548
14:01:53  nvme2n1    33    66  3470880   62643204
14:01:53  nvme3n1    33    66  3496122   62571880
Token Generation
$ sudo biopattern -T 180 1

Tracing block device I/O requested seeks... Hit Ctrl-C to end.
TIME      DISK     %RND  %SEQ    COUNT     KBYTES
15:53:13  nvme0n1    58    41  4297223   55141108
15:53:13  nvme1n1    54    45  4393544   55156308
15:53:13  nvme2n1    54    45  4382473   55182708
15:53:13  nvme3n1    54    45  4385386   55126844
Block i/o Snoop
Trace block I/O.
Prompt Processing
# do this a few times to get a feel for exact size reads and latencies
$ sudo biosnoop | head
TIME(s)     COMM           PID     DISK    T    SECTOR     BYTES   LAT(ms)
0.000000    llama-b        472645  nvme1n1 RA   171795752  4096      0.056
0.000751    llama-b        472645  nvme2n1 RA   171796208  65536     0.044
0.000756    llama-b        472645  nvme2n1 RA   171796376  20480     0.030
0.000769    llama-b        472645  nvme2n1 RA   171796440  20480     0.010
0.001025    llama-b        472645  nvme3n1 RA   171795456  16384     0.268
0.001027    llama-b        472645  nvme3n1 RA   171795584  8192      0.253
0.001028    llama-b        472645  nvme3n1 RA   171795664  36864     0.220
0.001341    llama-b        472645  nvme0n1 RA   171796488  8192      0.131
0.002048    llama-b        472645  nvme1n1 RA   171796520  8192      0.122
Token Generation
$ sudo biosnoop 1 | head
TIME(s)     COMM           PID     DISK    T    SECTOR     BYTES   LAT(ms)
0.000000    llama-b        483569  nvme1n1 RA   262911728  32768     0.064
0.000091    llama-b        483569  nvme1n1 RA   262911912  4096      0.042
0.000141    llama-b        483569  nvme1n1 RA   262911792  61440     0.088
0.000166    llama-b        483569  nvme1n1 RA   262911920  16384     0.079
0.000216    llama-b        483569  nvme2n1 RA   262911000  4096      0.047
0.000230    llama-b        483569  nvme1n1 RA   262911952  24576     0.056
0.000250    llama-b        483569  nvme2n1 RA   262911008  12288     0.062
0.000259    llama-b        483569  nvme2n1 RA   262910976  12288     0.088
0.000272    llama-b        483569  nvme2n1 RA   262911032  4096      0.071
CPU Cache Stats
Summarize cache references and misses by PID.
Prompt Processing
# sort by cpu (the processes likely bounce between cores/threads)
sudo llcstat 180 | grep -P '(llama-bench|Total|PID)' | sort -V -k 3,3

PID      NAME             CPU     REFERENCE         MISS    HIT%
472645   llama-bench      0       260084200    105109100  59.59%
472645   llama-bench      1       271595900    107856300  60.29%
472645   llama-bench      2       122634100     48118400  60.76%
472645   llama-bench      3       103657900     38727000  62.64%
472645   llama-bench      4       152044500     59005700  61.19%
472645   llama-bench      5       155044000     58195700  62.47%
472645   llama-bench      6       292201400    117024400  59.95%
472645   llama-bench      7       174555900     67375600  61.40%
472645   llama-bench      8       348132500    140949600  59.51%
472645   llama-bench      9       261152300    102766400  60.65%
472645   llama-bench      10      408874400    163455700  60.02%
472645   llama-bench      11      451004300    179642900  60.17%
472645   llama-bench      12      387897500    158195400  59.22%
472645   llama-bench      13      502233700    207044400  58.78%
472645   llama-bench      14      186695700     70750300  62.10%
472645   llama-bench      15      406424500    160824600  60.43%
472645   llama-bench      16      346197800    134519400  61.14%
472645   llama-bench      17      204177200     85408700  58.17%
472645   llama-bench      18      165621000     66280800  59.98%
472645   llama-bench      19      326486500    135545100  58.48%
472645   llama-bench      20      368738300    139175500  62.26%
472645   llama-bench      21      261058700    102228400  60.84%
472645   llama-bench      22      424314500    166226400  60.82%
472645   llama-bench      23      252195500    102542900  59.34%
472645   llama-bench      24     1189916100    498972700  58.07%
472645   llama-bench      25     1160928000    478048200  58.82%
472645   llama-bench      26     1314916900    535932500  59.24%
472645   llama-bench      27     1342106800    549897700  59.03%
472645   llama-bench      28     1278900000    521841200  59.20%
472645   llama-bench      29     1290325600    527823400  59.09%
472645   llama-bench      30     1060096500    428899700  59.54%
472645   llama-bench      31     1280229000    524769100  59.01%
472645   llama-bench      32     1052018800    428794900  59.24%
472645   llama-bench      33      976827500    394650300  59.60%
472645   llama-bench      34     1025104000    419006300  59.13%
472645   llama-bench      35      815274000    336547500  58.72%
472645   llama-bench      36     1054887300    428246800  59.40%
472645   llama-bench      37      917551200    373496700  59.29%
472645   llama-bench      38     1247426700    513614100  58.83%
472645   llama-bench      39     1023180200    424158000  58.55%
472645   llama-bench      40     1087901900    448935100  58.73%
472645   llama-bench      41     1222746800    499064500  59.18%
472645   llama-bench      42     1290558800    526509700  59.20%
472645   llama-bench      43     1064135400    431187300  59.48%
472645   llama-bench      44      809287700    340242200  57.96%
472645   llama-bench      45     1191512400    491595900  58.74%
472645   llama-bench      46     1006870000    416382800  58.65%
472645   llama-bench      47     1191455700    490035800  58.87%
Total References: 35036149900 Total Misses: 14365309500 Hit Rate: 59.00%
Token Generation
sudo llcstat 180 | grep -P '(llama-bench|Total|PID)' | sort -V -k 3,3

PID      NAME             CPU     REFERENCE         MISS    HIT%
493469   llama-bench      0       178739900     92973100  47.98%
493469   llama-bench      1       143521000     71367200  50.27%
493469   llama-bench      2       102070400     49472700  51.53%
493469   llama-bench      3        93535400     45344500  51.52%
493469   llama-bench      4       122853300     63089400  48.65%
493469   llama-bench      5       100126500     50860700  49.20%
493469   llama-bench      6       135180700     68212700  49.54%
493469   llama-bench      7       221127800    114417400  48.26%
493469   llama-bench      8       353029000    192503900  45.47%
493469   llama-bench      9       201506200    107204200  46.80%
493469   llama-bench      10      213137400    111369200  47.75%
493469   llama-bench      11      211342600    107674700  49.05%
493469   llama-bench      12      171033500     92188700  46.10%
493469   llama-bench      13      165303900     87134700  47.29%
493469   llama-bench      14      265153200    138694800  47.69%
493469   llama-bench      15      172611600     84571800  51.00%
493469   llama-bench      16      255942900    131531100  48.61%
493469   llama-bench      17      151376500     75140300  50.36%
493469   llama-bench      18      248108600    130249100  47.50%
493469   llama-bench      19      268105300    140291000  47.67%
493469   llama-bench      20      155939500     81268600  47.88%
493469   llama-bench      21      125014800     66195500  47.05%
493469   llama-bench      22      196849600    103162900  47.59%
493469   llama-bench      23      217617100    104683100  51.90%
493469   llama-bench      24     1010395500    536548800  46.90%
493469   llama-bench      25     1037633200    546470200  47.33%
493469   llama-bench      26      945782800    485664500  48.65%
493469   llama-bench      27     1060634700    554281500  47.74%
493469   llama-bench      28      992441000    524587200  47.14%
493469   llama-bench      29     1041995900    550117700  47.21%
493469   llama-bench      30     1011749000    538214700  46.80%
493469   llama-bench      31      962790100    517939200  46.20%
493469   llama-bench      32      839163500    438704700  47.72%
493469   llama-bench      33      960316800    507777500  47.12%
493469   llama-bench      34      957871700    508651900  46.90%
493469   llama-bench      35      927833600    492939700  46.87%
493469   llama-bench      36      871497400    453762300  47.93%
493469   llama-bench      37      910214300    480818400  47.18%
493469   llama-bench      38      842718900    442357800  47.51%
493469   llama-bench      39     1007880700    536754700  46.74%
493469   llama-bench      40      899776500    473773500  47.35%
493469   llama-bench      41      909038300    477876200  47.43%
493469   llama-bench      42      920419100    485129300  47.29%
493469   llama-bench      43      885914700    468553600  47.11%
493469   llama-bench      44      960370900    510075500  46.89%
493469   llama-bench      45      907635400    484657100  46.60%
493469   llama-bench      46      850517900    453385200  46.69%
493469   llama-bench      47      909464200    491268200  45.98%
Total References: 29114831100 Total Misses: 15202374500 Hit Rate: 47.78%
Cache Stat
Count cache kernel function calls.
Prompt Processing
$ sudo cachestat -T 180 1
TIME         HITS   MISSES  DIRTIES HITRATIO   BUFFERS_MB  CACHED_MB
14:25:46        0        0     4848    0.00%           14     249539
Token Generation
$ sudo cachestat -T 180 1

TIME         HITS   MISSES  DIRTIES HITRATIO   BUFFERS_MB  CACHED_MB
15:58:00        0        0     4865    0.00%           13     250911
Scheduler Run Queue Latency
Summarize run queue (scheduler) latency as a histogram.
Prompt Processing
$ sudo runqlat -p $(pidof llama-bench) 180 1

     usecs               : count    distribution
         0 -> 1          : 82496    |****************************************|
         2 -> 3          : 49371    |***********************                 |
         4 -> 7          : 14323    |******                                  |
         8 -> 15         : 3843     |*                                       |
        16 -> 31         : 978      |                                        |
        32 -> 63         : 189      |                                        |
        64 -> 127        : 208      |                                        |
       128 -> 255        : 39       |                                        |
       256 -> 511        : 30       |                                        |
       512 -> 1023       : 43       |                                        |
      1024 -> 2047       : 41       |                                        |
      2048 -> 4095       : 45       |                                        |
Token Generation
$ sudo runqlat -p $(pidof llama-bench) 180 1

     usecs               : count    distribution
         0 -> 1          : 90843    |****************************************|
         2 -> 3          : 79882    |***********************************     |
         4 -> 7          : 39149    |*****************                       |
         8 -> 15         : 5292     |**                                      |
        16 -> 31         : 1515     |                                        |
        32 -> 63         : 282      |                                        |
        64 -> 127        : 183      |                                        |
       128 -> 255        : 16       |                                        |
       256 -> 511        : 17       |                                        |
       512 -> 1023       : 42       |                                        |
      1024 -> 2047       : 55       |                                        |
      2048 -> 4095       : 34       |                                        |
On-CPU Time
Summarize on-CPU time per task as a histogram.
Prompt Processing
$ sudo cpudist -p $(pidof llama-bench) 180 1

     usecs               : count    distribution
         0 -> 1          : 0        |                                        |
         2 -> 3          : 0        |                                        |
         4 -> 7          : 5        |                                        |
         8 -> 15         : 17       |                                        |
        16 -> 31         : 49       |                                        |
        32 -> 63         : 58       |                                        |
        64 -> 127        : 56       |                                        |
       128 -> 255        : 100      |                                        |
       256 -> 511        : 147      |*                                       |
       512 -> 1023       : 598      |*****                                   |
      1024 -> 2047       : 291      |**                                      |
      2048 -> 4095       : 619      |******                                  |
      4096 -> 8191       : 1425     |**************                          |
      8192 -> 16383      : 1931     |*******************                     |
     16384 -> 32767      : 2872     |****************************            |
     32768 -> 65535      : 4011     |****************************************|
     65536 -> 131071     : 3888     |**************************************  |
    131072 -> 262143     : 2650     |**************************              |
    262144 -> 524287     : 893      |********                                |
    524288 -> 1048575    : 76       |                                        |
Token Generation
$ sudo cpudist -p $(pidof llama-bench) 180 1

     usecs               : count    distribution
         0 -> 1          : 0        |                                        |
         2 -> 3          : 1        |                                        |
         4 -> 7          : 8        |                                        |
         8 -> 15         : 11       |                                        |
        16 -> 31         : 27       |                                        |
        32 -> 63         : 69       |                                        |
        64 -> 127        : 84       |                                        |
       128 -> 255        : 132      |*                                       |
       256 -> 511        : 282      |**                                      |
       512 -> 1023       : 846      |********                                |
      1024 -> 2047       : 535      |*****                                   |
      2048 -> 4095       : 1060     |**********                              |
      4096 -> 8191       : 2314     |***********************                 |
      8192 -> 16383      : 2792     |****************************            |
     16384 -> 32767      : 3419     |***********************************     |
     32768 -> 65535      : 3878     |****************************************|
     65536 -> 131071     : 2915     |******************************          |
    131072 -> 262143     : 1850     |*******************                     |
    262144 -> 524287     : 519      |*****                                   |
    524288 -> 1048575    : 44       |                                        |
Off-CPU Time
Summarize off-CPU time per task as a histogram.
Prompt Processing
$ sudo cpudist --offcpu -p $(pidof llama-bench) 180 1

     usecs               : count    distribution
         0 -> 1          : 1        |                                        |
         2 -> 3          : 10007    |************                            |
         4 -> 7          : 30993    |****************************************|
         8 -> 15         : 17615    |**********************                  |
        16 -> 31         : 21114    |***************************             |
        32 -> 63         : 13342    |*****************                       |
        64 -> 127        : 13039    |****************                        |
       128 -> 255        : 11525    |**************                          |
       256 -> 511        : 8151     |**********                              |
       512 -> 1023       : 5882     |*******                                 |
      1024 -> 2047       : 5374     |******                                  |
      2048 -> 4095       : 3981     |*****                                   |
      4096 -> 8191       : 1264     |*                                       |
      8192 -> 16383      : 104      |                                        |
     16384 -> 32767      : 1        |                                        |
     32768 -> 65535      : 0        |                                        |
     65536 -> 131071     : 6        |                                        |
    131072 -> 262143     : 0        |                                        |
    262144 -> 524287     : 23       |                                        |
Token Generation
$ sudo cpudist --offcpu -p $(pidof llama-bench) 180 1

     usecs               : count    distribution
         0 -> 1          : 5        |                                        |
         2 -> 3          : 5250     |*********                               |
         4 -> 7          : 17459    |******************************          |
         8 -> 15         : 14778    |*************************               |
        16 -> 31         : 14864    |*************************               |
        32 -> 63         : 20889    |************************************    |
        64 -> 127        : 18418    |*******************************         |
       128 -> 255        : 17902    |******************************          |
       256 -> 511        : 15147    |**************************              |
       512 -> 1023       : 21717    |*************************************   |
      1024 -> 2047       : 23123    |****************************************|
      2048 -> 4095       : 21891    |*************************************   |
      4096 -> 8191       : 8738     |***************                         |
      8192 -> 16383      : 1500     |**                                      |
     16384 -> 32767      : 303      |                                        |
     32768 -> 65535      : 90       |                                        |
     65536 -> 131071     : 71       |                                        |
    131072 -> 262143     : 5        |                                        |
Off-CPU Time Stack Traces
Summarize off-CPU time by stack trace.
Prompt Processing
# run a few times to see what is happening
$ sudo offcputime -p $(pidof llama-bench) 1

    bpf_prog_721f6802fa0b7ba5_sched_switch
    bpf_prog_721f6802fa0b7ba5_sched_switch
    bpf_trace_run4
    __bpf_trace_sched_switch
    __schedule
    schedule
    io_schedule
    folio_wait_bit_common
    filemap_fault
    __do_fault
    do_read_fault
    do_fault
    handle_pte_fault
    __handle_mm_fault
    handle_mm_fault
    do_user_addr_fault
    exc_page_fault
    asm_exc_page_fault
    ggml_vec_dot_q4_K_q8_K
    ggml_compute_forward_mul_mat_id
    -                llama-bench (473106)
        4645
Token Generation
$ sudo offcputime -p $(pidof llama-bench) 1

    bpf_prog_721f6802fa0b7ba5_sched_switch
    bpf_prog_721f6802fa0b7ba5_sched_switch
    bpf_trace_run4
    __bpf_trace_sched_switch
    __traceiter_sched_switch
    __schedule
    schedule
    io_schedule
    folio_wait_bit_common
    filemap_fault
    __do_fault
    do_read_fault
    do_fault
    handle_pte_fault
    __handle_mm_fault
    handle_mm_fault
    do_user_addr_fault
    exc_page_fault
    asm_exc_page_fault
    ggml_vec_dot_q4_K_q8_K
    ggml_compute_forward_mul_mat_id
    -                llama-bench (473122)
        167

