My Equipment:
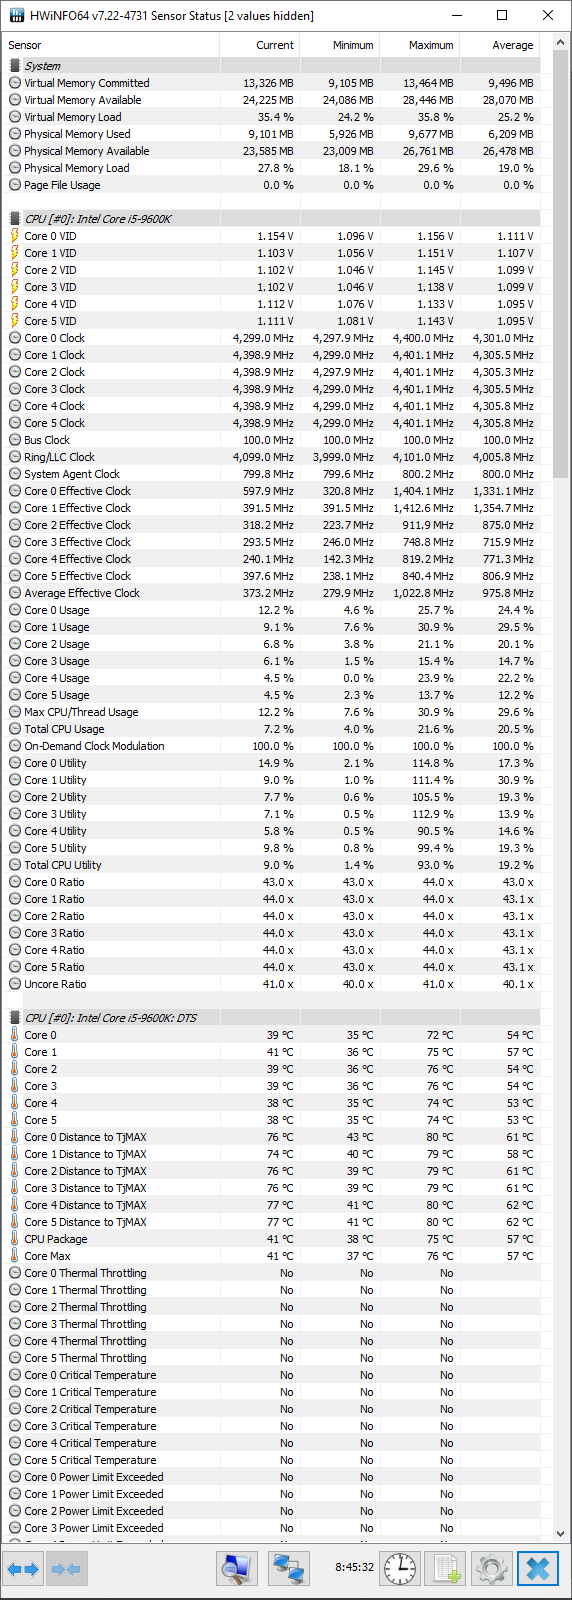
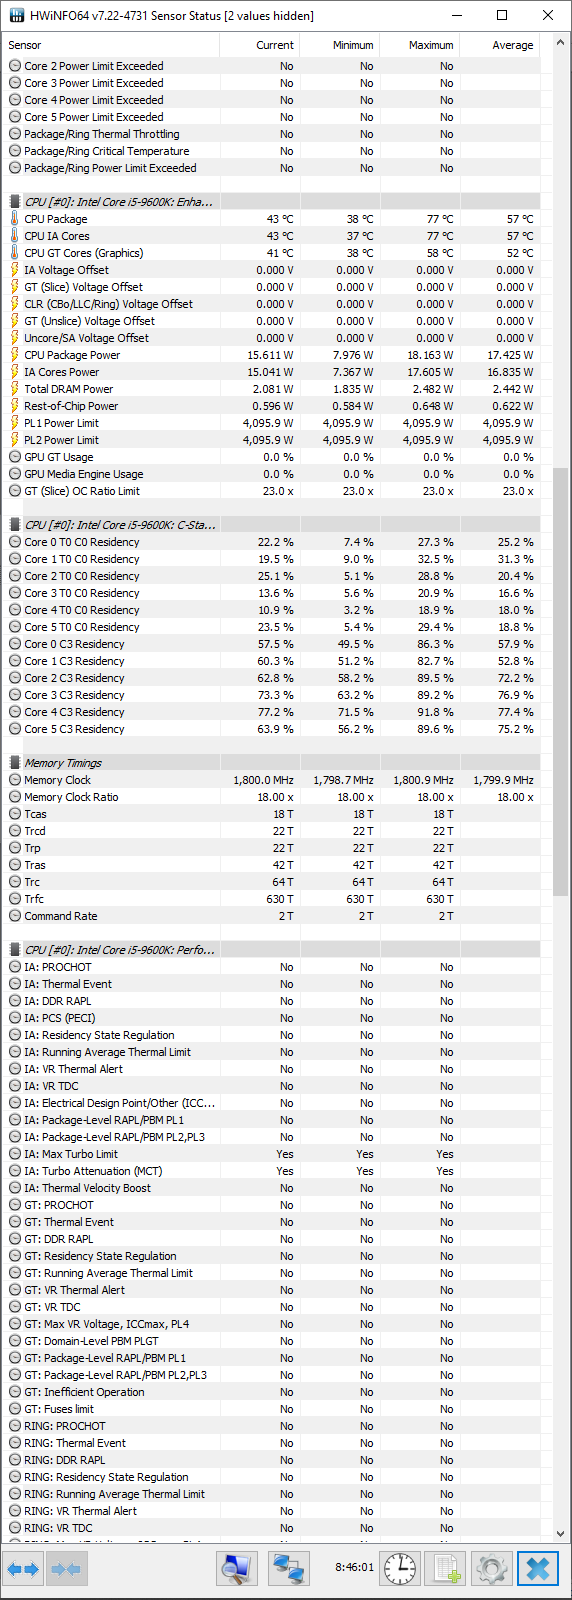
- Intel Core i5 9600k
- ASRock Z390 Pro4
- 32 GB DDR4 (XMP 2.0)
-
- DDR4-2132 G.Skill
-
- DDR4-2132 G.Skill
-
- DDR4-2401 Team Group Inc.
-
- DDR4-2401 Team Group Inc.
-
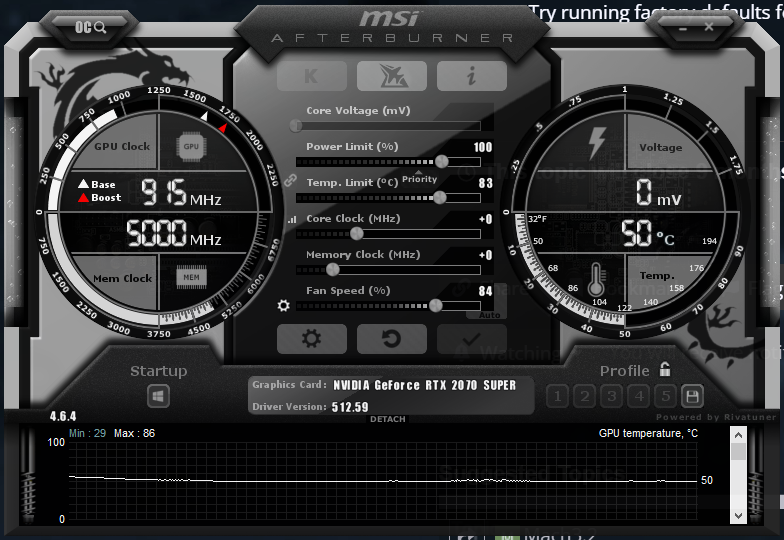
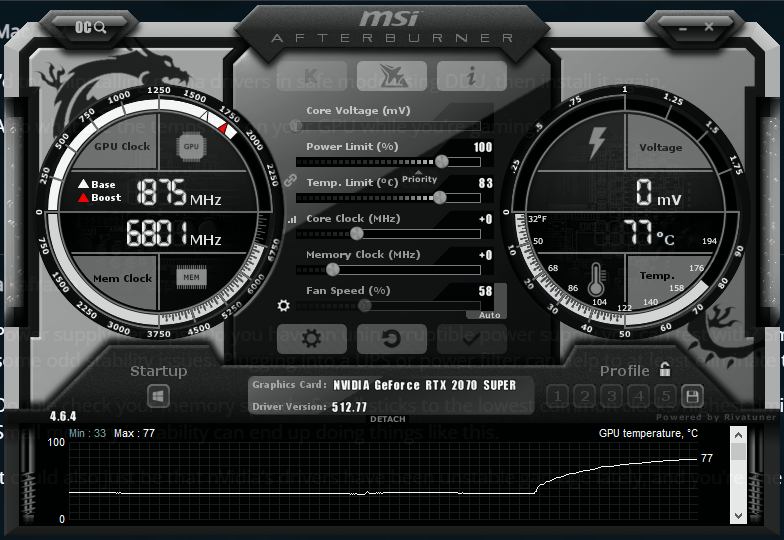
- NVidia GeForce RTX 2070 Super
I notice this most often when I’m watching videos as it usually results in a prolonged or stuttering noise that accompanies the freeze. When it freezes, my mouse and keyboard also freezes. It can occur as often as once per hour but usually more rarely. My graphics card was recently upgraded from 1070ti and it occurred then also so I think that the GPU isn’t the issue. Also, I recently updated my GPU driver. After the freeze, everything seems to continue as normal however in some cases, I get kicked out of CP2077 or Path of Exile.
I tend to keep many tabs open in my browser of things that I intend to get to eventually and Chrome often is the highest consumer of cycles and memory, but I don’t seem to have issues with concurrently running other things. So, I guess the paging and/or swapping is ok.
I am running Private Internet Access which definitely adds noticeable latency but doesn’t seem to affect overall throughput.
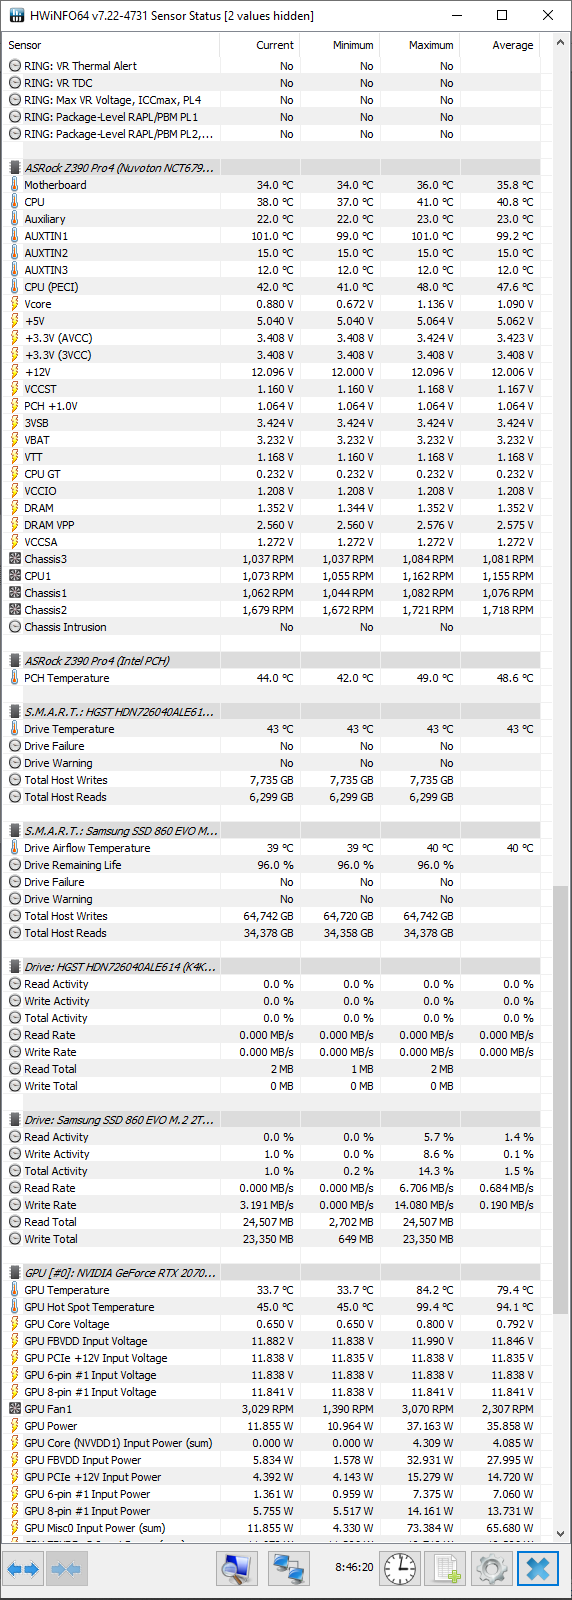
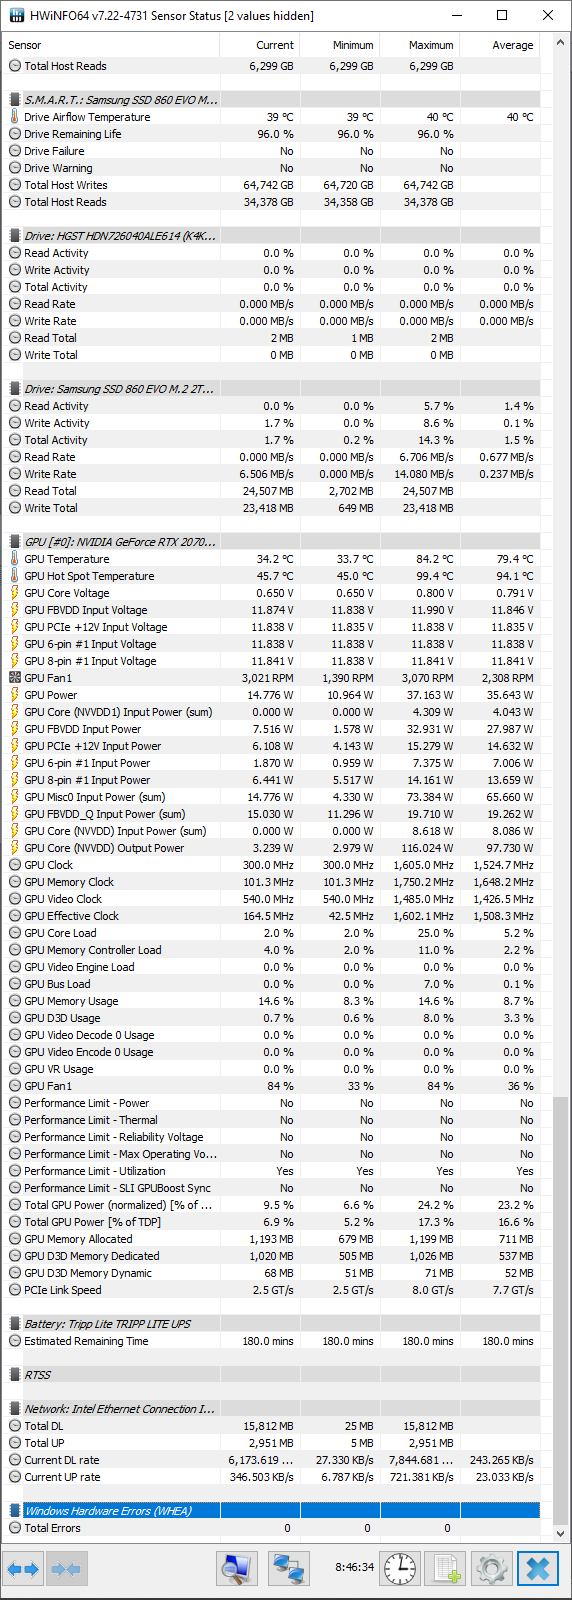
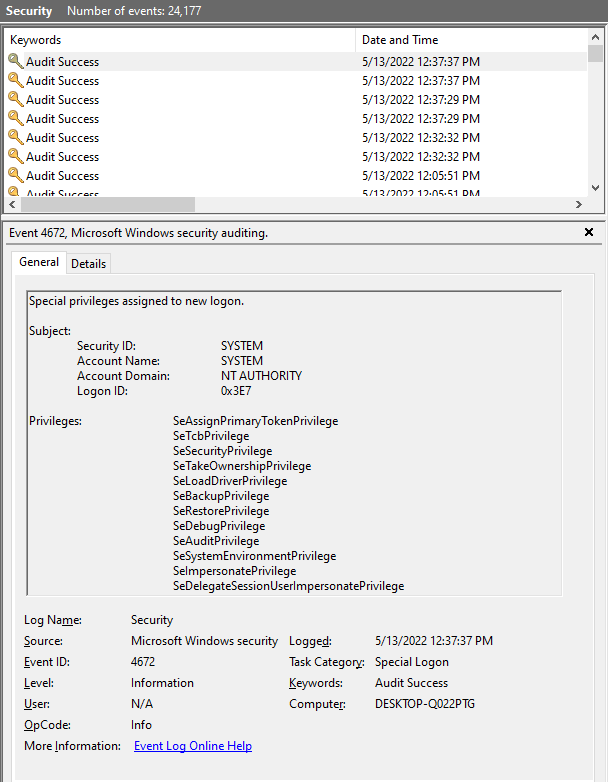
I’m not skilled with the event viewer or sysmon, so I’m unsure how to investigate after a freeze. I use HWInfo64 to monitor temps and those seem to be reasonably steady and mid-lo.
Can anyone detect issues in this report and/or offer tracking/investigation techniques?
Thank you,
Brian