I installed Ubuntu 18.10 (kernel Linux 4.18.0-13-generic) together with lm-sensors (version 1:3.4.0-4). When I ran sensors-detect I said Y to everything. First time I ran it I said Y to everything except the last one and it said I had no sensors.
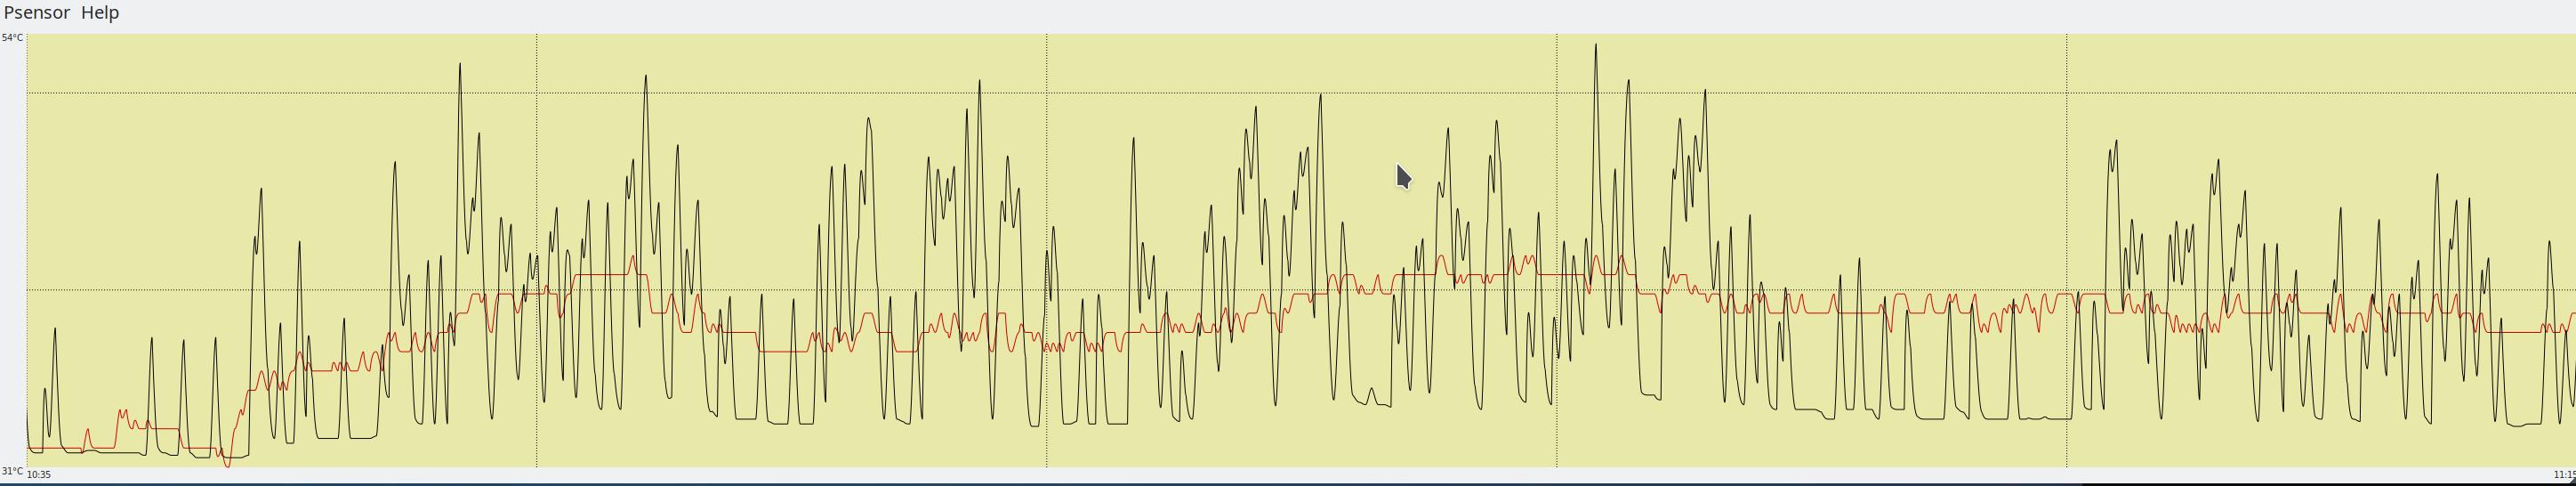
Now I have the k10temp-pci-00c3 sensor loaded (together with the amdgpu-pci-1c00). However, I believe that the reading that the k10temp sensor gives is bogus. Firstly, Tdie and Tctl are the same at all points in time (have seen other users report a 10 degree Celsius difference between the two). Secondly, Tdie sits at 33 degree Celsius on idle (which seems to be in line with what other users reported in terms of idle temperature being about 10 degrees more than room temperature but also with the 31 or so degrees the bios reports for the CPU). However, when I minimize a window, or for that matter as I type this post, the temperature shoots up (almost in a step function way) to 43 degrees Celsius. I added a graph recorded using psensors to illustrate these temperature jumps (black is Tdie and red is GPU temp). I find this rather unphysical, and that is why I think this is bogus.
So, is this correct? Do I need to install something?
Thank you,
Sam
Hardware:
MOBO: MSI B450M Mortar
CPU: AMD Ryzen 5 2600
CPU COOLER: Dark Rock 4
GPU: Asus Strix ROG RX 570 4GB
RAM: 16 GB Corsair @ 3000 MHz
PSU: Corsair RM-750X
CASE: Fractal Design Meshify mini c
FANS: 2 intake at the front (one from the case, one silent wings 3), 1 exhaust at the back (from the case)
Looks fairly normal to me in the sense that the cooler can’t dissipate immediatly the spike of voltage required by the processor to operate at an higher clock and do what you asked it to do. That’s what a constant doing short operations looks like.
To be sure that everything’s good you should take similar measurement with the additional voltage graph. That should concide almost exactly with the temperature spikes you’re seeing.
That is similar to the results I see, although my temps are a little higher, since I use the stock cooler that came with the 2600, and I am running a modest all core overclock of 450Mhz.
That does make sense. However, k10temp does not give me any voltage measurements. Do you maybe have any idea how I could obtain that (and also some fan rpm measurements)?
There is a tool out there to read per core and package power (rapl) counters.
However it does not (yet) work for reading voltages, I might figure that out at some point - but it’s tricky due to NDA documentation.
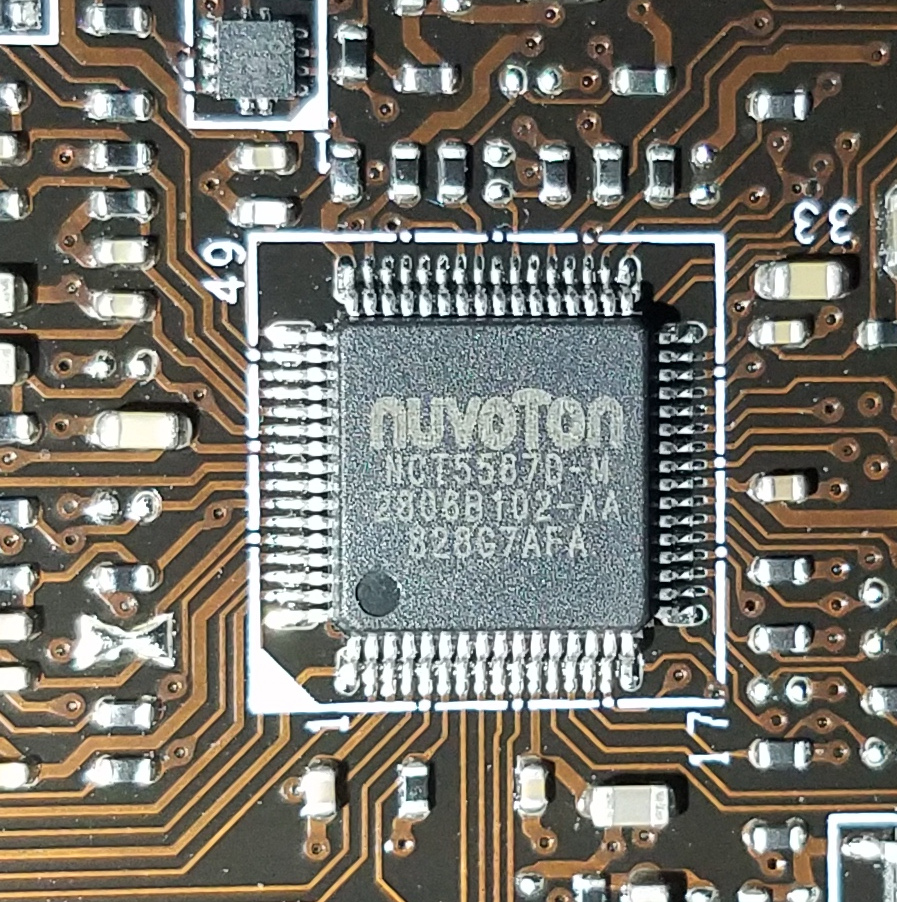
I have looked into it, but at least on my motherboard, as far as I can tell my sensor chip isn’t supported. While I don’t know I wouldn’t be surprised if your MBO uses the same chip as mine, being similar class boards by MSI. Mine uses a Nuvoton NCT5567D-M
On my board it was located between the PCI-E slots and the CMOS battery as a QFP (Surface mount Quad flat pack) chip .
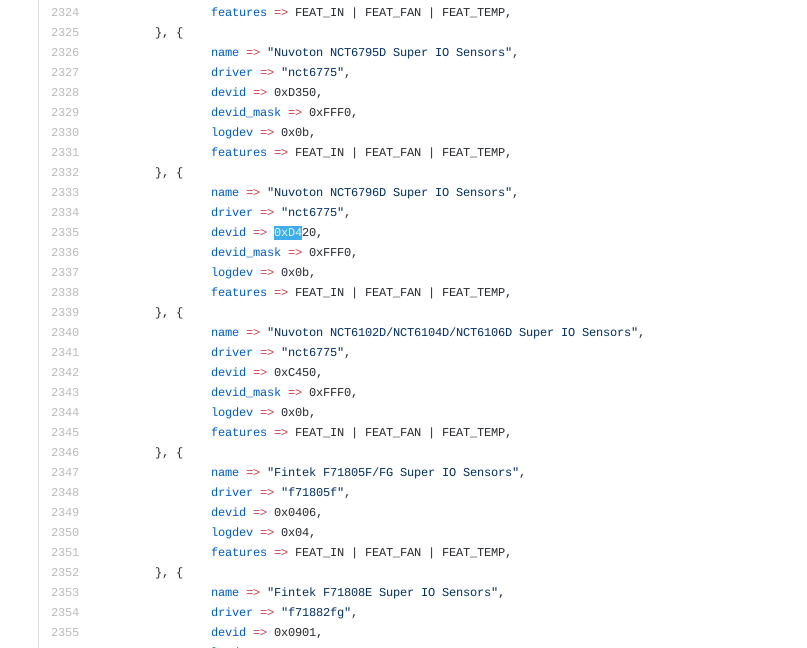
I looked where you suggested and indeed I found a Nuvoton chip. However, the chip on this motherboard is the NCT6797D-M version. Also looked it up in the motherboard user guide and it checks out.
After some searching I found this git repository: https://github.com/torvalds/linux/blob/master/drivers/hwmon/nct6775.c, where there seems to be a driver for this chip. However, I couldn’t really find a readme file in there. So then the question is, do you have a clue as to how I can use this driver?
I believe that one is in the kernel already. You should be able to use the following command to see if it loaded.
lsmod | grep nct6775
If you get nothing it’s not loaded, if it is showing up it might not be pointing to the right area. That chip should be able to provide a lot of the other sensor details, such as fan rpms, motherboard temp sensors and possibly voltages.
What version of linux are you on? I know on Mint 19 I had to update the sensors-detect script because the one included in my distro was out of date.
If you’ve got an NCT6775 or NCT6797/6779
Just run sudo sensors-detect --auto from the lm-sensors package.
Then use the sensors command to read the values, but keep in mind the volatages you will see are external CPU voltages (VRM) and don’t represent the internal core voltages of the Ryzen CPU (It does a lot of internal VCore adjustments)
This is not going to give you per core voltage readings as reported by the CPU itself, just various VRM and board voltages, socket temps and Fan RPM’s.
Chances are though that on the first try you will get a lot of undecipherable names from the sensors output.
You can find configs for some boards documented here
If yours isn’t yet on there, message me or post here:
Also attached just for an example, the sensors output on my system: (R7 1700X OC + Asus X470 C7H WiFi)
sensors
asus-isa-0000
Adapter: ISA adapter
cpu_fan:        0 RPM

it8665-isa-0290
Adapter: ISA adapter
VCore:          +1.29 V  (min =  +0.40 V, max =  +1.45 V)
DRAM:           +1.33 V  (min =  +1.10 V, max =  +1.50 V)
+12V:          +12.16 V  (min = +11.39 V, max = +12.59 V)
+5V:            +4.99 V  (min =  +4.74 V, max =  +5.26 V)
VDDSOC:         +1.13 V  (min =  +0.80 V, max =  +1.20 V)
VDDP?:          +0.52 V  (min =  +2.19 V, max =  +2.78 V)
1.8V PLL:       +1.83 V  (min =  +1.77 V, max =  +1.83 V)
3VSB:           +3.36 V  (min =  +3.25 V, max =  +5.49 V)
VBat:           +3.23 V
AVCC3:          +3.36 V
fan1:          2343 RPM  (min =   10 RPM) == IS AIO PUMP RPM actualy
fan5:             0 RPM  (min =   -1 RPM)  ALARM
CPU:            +36.0°C  (low  = -19.0°C, high = +55.0°C)
Motherboard:    +28.0°C  (low  = -27.0°C, high = +127.0°C)  sensor = thermistor
cpu (Socket):   +37.0°C  (low  =  -1.0°C, high = +63.0°C)  sensor = thermistor
Temperature 4:  +37.0°C  (low  = +59.0°C, high = -43.0°C)  sensor = thermistor
Temperature 5:  +37.0°C  (low  = -58.0°C, high = -101.0°C)  sensor = thermistor
Temperature 6:  +37.0°C  (low  = -65.0°C, high =  -5.0°C)  sensor = thermistor
intrusion0:    ALARM

amdgpu-pci-0a00
Adapter: PCI adapter
vddgfx:       +0.95 V
fan1:        1144 RPM  (min =    0 RPM, max = 3700 RPM)
temp1:        +44.0°C  (crit = +94.0°C, hyst = -273.1°C)
power1:       34.23 W  (cap = 145.00 W)

k10temp-pci-00c3
Adapter: PCI adapter
Tdie:         +36.2°C  (high = +70.0°C)
Tctl:         +56.2°C

amdgpu-pci-0b00
Adapter: PCI adapter
vddgfx:       +0.72 V
fan1:         814 RPM  (min =    0 RPM, max = 3700 RPM)
temp1:        +38.0°C  (crit = +94.0°C, hyst = -273.1°C)
power1:       28.16 W  (cap = 145.00 W)
If I may ask, what sampling rate where you using for this?
It’s actually possible for k10temp to give very rapid, ms by ms temp readouts, but these don’t truly reflect the thermal state of the entire chip, and honestly k10temp presents quite noisy data.
It may be that the implementation of this kernel module is not quite right, but it does overall reflect a ‘true-enough’ temperature. Particularly when you put the system under load.
If you’re wondering, my R7 1700X does the same, and it’s pretty much normal, particularly since Ryzen CPU’s can boost their internal core voltage and clocks in very fast bursts.
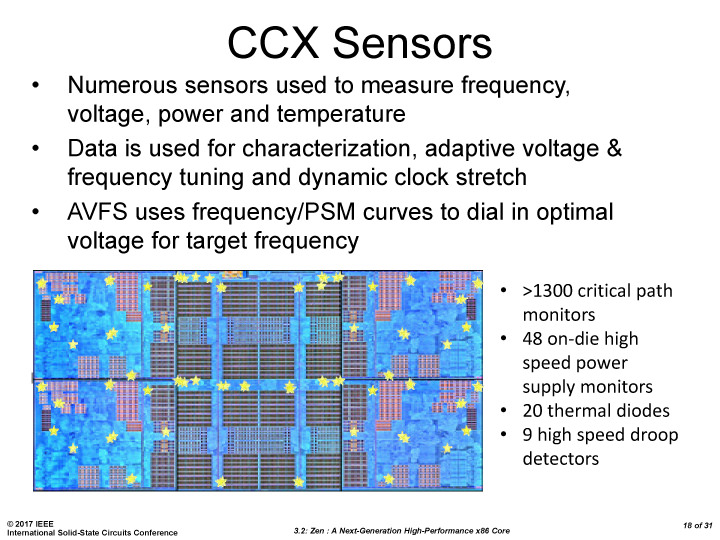
K10-temp doesn’t read a board thermistor, it reads data from a thermal subsystem inside the Ryzen SoC which aggregates a number of thermistor measurements (There’s a lot of sensors on a Zen die)
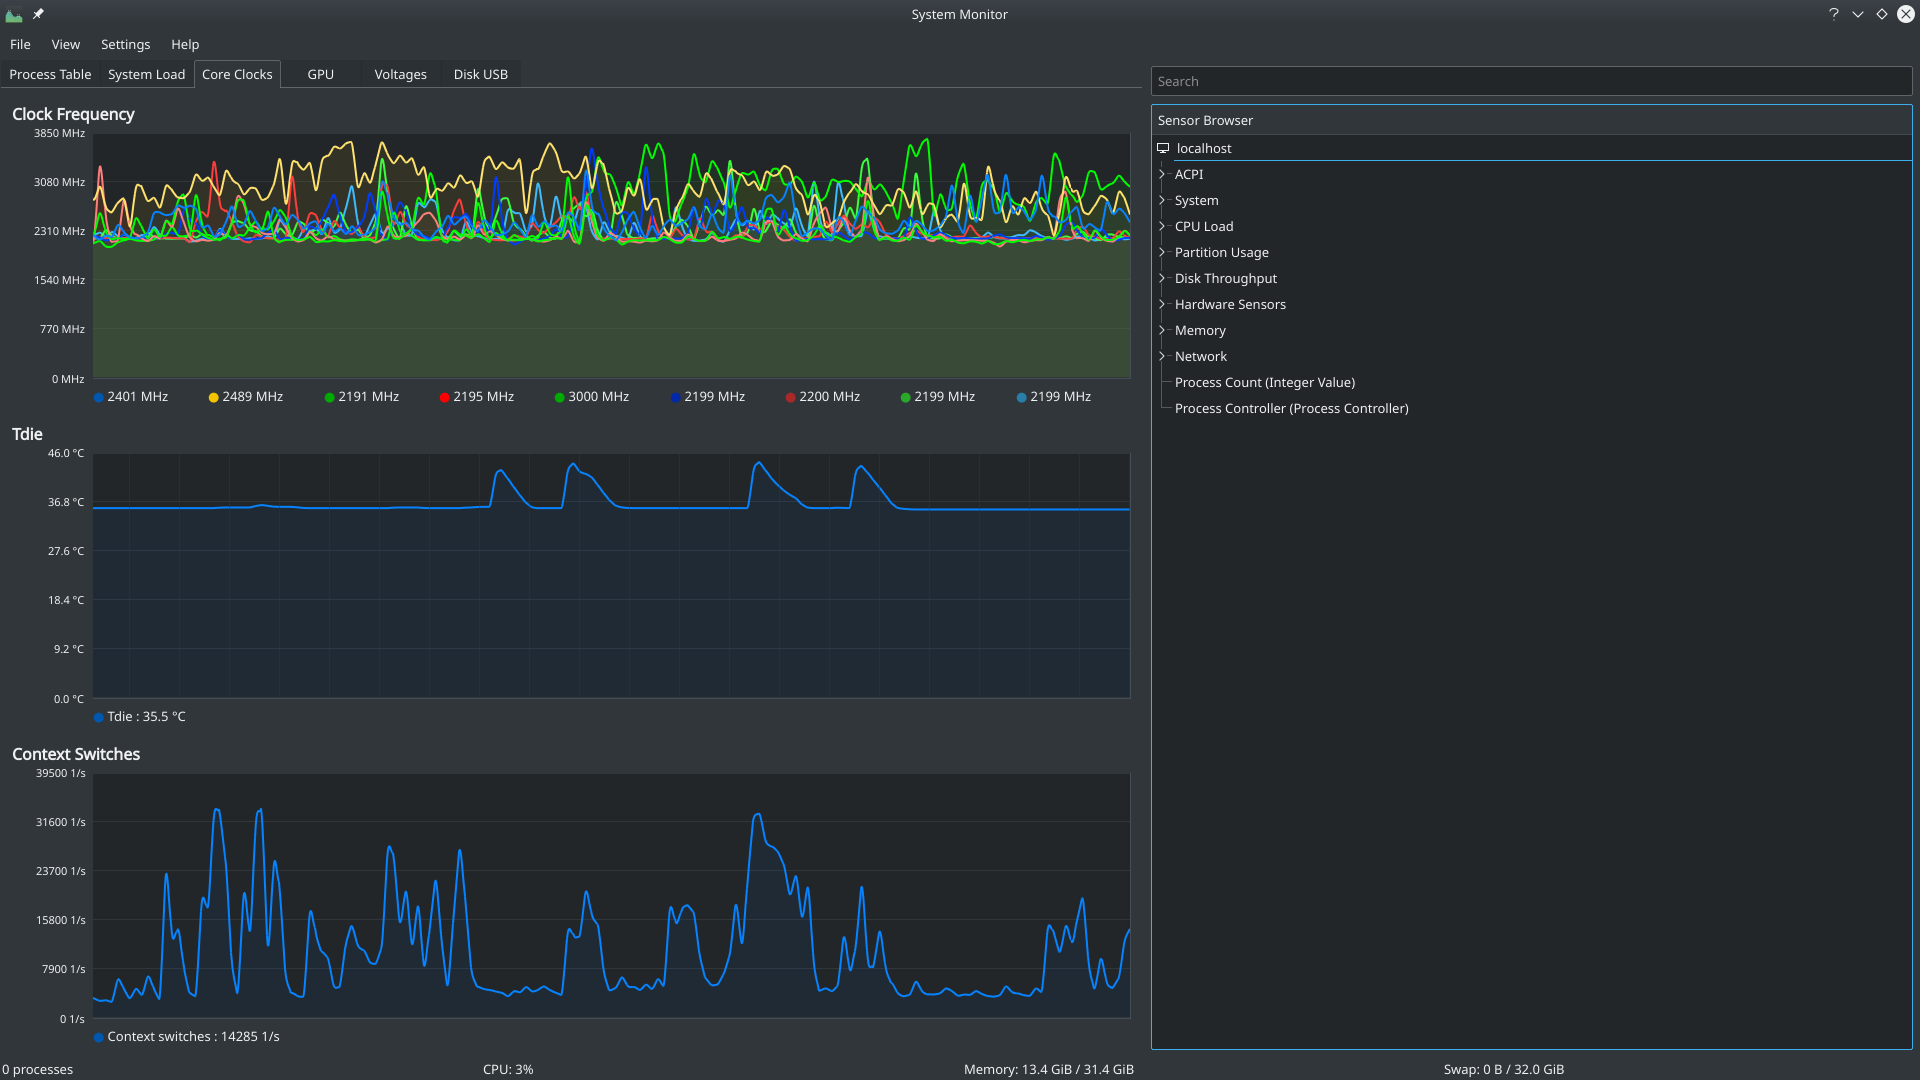
Below screenshot of mostly idle activity - with a couple of application launches and containers tasks performed.
Also - I’m probably not running the most standard/ideal example setup with this PC since right now.
I’ve done lots of somewhat experimental BIOS VRM tweaks recently to figure out some things with SoC, and RAM voltages and PWM clocks.
When I ran the command you suggested this is the output that I get:
# sensors-detect revision 6284 (2015-05-31 14:00:33 +0200)
# System: Micro-Star International Co., Ltd. MS-7B89 [1.0]
# Board: Micro-Star International Co., Ltd. B450M MORTAR (MS-7B89)
# Kernel: 4.18.0-13-generic x86_64
# Processor: AMD Ryzen 5 2600 Six-Core Processor (23/8/2)

Running in automatic mode, default answers to all questions
are assumed.

Some south bridges, CPUs or memory controllers contain embedded sensors.
Do you want to scan for them? This is totally safe. (YES/no):
Module cpuid loaded successfully.
Silicon Integrated Systems SIS5595...                       No
VIA VT82C686 Integrated Sensors...                          No
VIA VT8231 Integrated Sensors...                            No
AMD K8 thermal sensors...                                   No
AMD Family 10h thermal sensors...                           No
AMD Family 11h thermal sensors...                           No
AMD Family 12h and 14h thermal sensors...                   No
AMD Family 15h thermal sensors...                           No
AMD Family 16h thermal sensors...                           No
AMD Family 15h power sensors...                             No
AMD Family 16h power sensors...                             No
Intel digital thermal sensor...                             No
Intel AMB FB-DIMM thermal sensor...                         No
Intel 5500/5520/X58 thermal sensor...                       No
VIA C7 thermal sensor...                                    No
VIA Nano thermal sensor...                                  No

Some Super I/O chips contain embedded sensors. We have to write to
standard I/O ports to probe them. This is usually safe.
Do you want to scan for Super I/O sensors? (YES/no):
Probing for Super-I/O at 0x2e/0x2f
Trying family `National Semiconductor/ITE'...               No
Trying family `SMSC'...                                     No
Trying family `VIA/Winbond/Nuvoton/Fintek'...               No
Trying family `ITE'...                                      No
Probing for Super-I/O at 0x4e/0x4f
Trying family `National Semiconductor/ITE'...               No
Trying family `SMSC'...                                     No
Trying family `VIA/Winbond/Nuvoton/Fintek'...               Yes
Found unknown chip with ID 0xd451

Some systems (mainly servers) implement IPMI, a set of common interfaces
through which system health data may be retrieved, amongst other things.
We first try to get the information from SMBIOS. If we don't find it
there, we have to read from arbitrary I/O ports to probe for such
interfaces. This is normally safe. Do you want to scan for IPMI
interfaces? (YES/no):
Probing for `IPMI BMC KCS' at 0xca0...                      No
Probing for `IPMI BMC SMIC' at 0xca8...                     No

Some hardware monitoring chips are accessible through the ISA I/O ports.
We have to write to arbitrary I/O ports to probe them. This is usually
safe though. Yes, you do have ISA I/O ports even if you do not have any
ISA slots! Do you want to scan the ISA I/O ports? (YES/no):
Probing for `National Semiconductor LM78' at 0x290...       No
Probing for `National Semiconductor LM79' at 0x290...       No
Probing for `Winbond W83781D' at 0x290...                   No
Probing for `Winbond W83782D' at 0x290...                   No

Lastly, we can probe the I2C/SMBus adapters for connected hardware
monitoring devices. This is the most risky part, and while it works
reasonably well on most systems, it has been reported to cause trouble
on some systems.
Do you want to probe the I2C/SMBus adapters now? (YES/no):
Found unknown SMBus adapter 1022:790b at 0000:00:14.0.
Sorry, no supported PCI bus adapters found.

Next adapter: SMBus PIIX4 adapter port 0 at 0b00 (i2c-0)
Do you want to scan it? (YES/no/selectively):
Client found at address 0x4a
Probing for `National Semiconductor LM75'...                No
Probing for `National Semiconductor LM75A'...               No
Probing for `Dallas Semiconductor DS75'...                  No
Probing for `National Semiconductor LM77'...                No
Probing for `Analog Devices ADT7410/ADT7420'...             No
Probing for `Analog Devices ADT7411'...                     No
Probing for `Maxim MAX6642'...                              No
Probing for `Texas Instruments TMP435'...                   No
Probing for `National Semiconductor LM73'...                No
Probing for `National Semiconductor LM92'...                No
Probing for `National Semiconductor LM76'...                No
Probing for `Maxim MAX6633/MAX6634/MAX6635'...              No
Probing for `NXP/Philips SA56004'...                        No
Client found at address 0x52
Probing for `Analog Devices ADM1033'...                     No
Probing for `Analog Devices ADM1034'...                     No
Probing for `SPD EEPROM'...                                 No
Client found at address 0x53
Probing for `Analog Devices ADM1033'...                     No
Probing for `Analog Devices ADM1034'...                     No
Probing for `SPD EEPROM'...                                 No

Next adapter: SMBus PIIX4 adapter port 2 at 0b00 (i2c-1)
Do you want to scan it? (YES/no/selectively):

Next adapter: SMBus PIIX4 adapter port 3 at 0b00 (i2c-2)
Do you want to scan it? (YES/no/selectively):

Next adapter: SMBus PIIX4 adapter port 4 at 0b00 (i2c-3)
Do you want to scan it? (YES/no/selectively):

Next adapter: AMDGPU DM i2c hw bus 0 (i2c-4)
Do you want to scan it? (yes/NO/selectively):

Next adapter: dmdc (i2c-5)
Do you want to scan it? (yes/NO/selectively):

Next adapter: AMDGPU DM i2c hw bus 1 (i2c-6)
Do you want to scan it? (yes/NO/selectively):

Next adapter: AMDGPU DM i2c hw bus 2 (i2c-7)
Do you want to scan it? (yes/NO/selectively):

Next adapter: AMDGPU DM i2c hw bus 3 (i2c-8)
Do you want to scan it? (yes/NO/selectively):

Sorry, no sensors were detected.
Either your system has no sensors, or they are not supported, or
they are connected to an I2C or SMBus adapter that is not
supported. If you find out what chips are on your board, check
http://www.lm-sensors.org/wiki/Devices for driver status.
Afterwards when I use the sensors command I do not get the nct6796 one:
I went to the GitHub package you linked, however I could not see this board (MSI B450M Mortar) there. So I’ll just post in the other thread about this motherboard.
@catsay The sampling rate was 1 Hz. That would indeed make sense. I also observed that:
The fluctuations are larger when the CPU is in an idle state as compared to when the CPU is under load. Makes sense in the framework that the CPU changes the voltage in fast bursts, since it would happen less under load.
The transitions from high temperature states to low temperature states are not step function like.
The distribution is Kubuntu 18.10. When I run sudo apt-cache policy lm-sensors I get:
Just try modprobe without force_id, it should even auto detect.
Regarding the version, the repo maintainers are also partly responsible, a release hasn’t been made in a while. Also seems like debian/ubuntu packagers haven’t gotten wind of a new release.


 The distribution is Kubuntu 18.10. When I run