I am just making some notes about some ZFS experiments I am running on a 45 Drives Q30 chassis running Rocky Linux 8.9 and ZFS 2.1
Possibly for a future video because “I Have 12 Disks And I Want The Best ZFS Performance” comes up quite a bit. And it’s juuust on the edge where folks burst in and start recommended dRaid… (I tend to think draid is good when you have… a lot… of disks. maybe.)
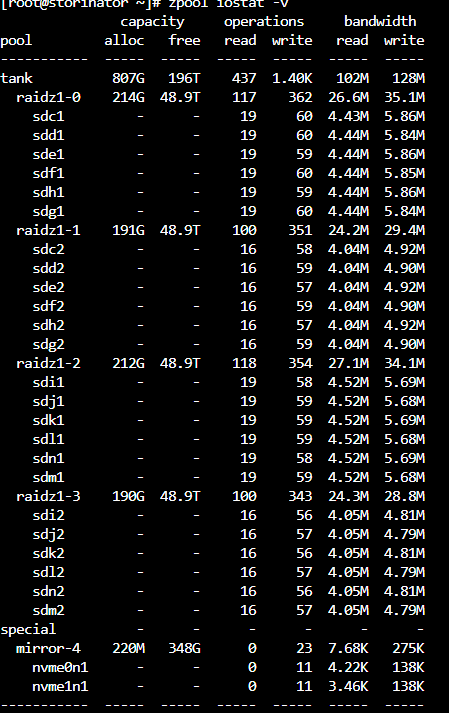
[root@storinator ~]# zpool status
  pool: tank
 state: ONLINE
  scan: scrub repaired 0B in 00:01:36 with 0 errors on Sat Feb 10 10:57:49 2024
config:

        NAME         STATE     READ WRITE CKSUM
        tank         ONLINE       0     0     0
          raidz1-0   ONLINE       0     0     0
            sdc1     ONLINE       0     0     0
            sdd1     ONLINE       0     0     0
            sde1     ONLINE       0     0     0
            sdf1     ONLINE       0     0     0
            sdh1     ONLINE       0     0     0
            sdg1     ONLINE       0     0     0
          raidz1-1   ONLINE       0     0     0
            sdc2     ONLINE       0     0     0
            sdd2     ONLINE       0     0     0
            sde2     ONLINE       0     0     0
            sdf2     ONLINE       0     0     0
            sdh2     ONLINE       0     0     0
            sdg2     ONLINE       0     0     0
          raidz1-2   ONLINE       0     0     0
            sdi1     ONLINE       0     0     0
            sdj1     ONLINE       0     0     0
            sdk1     ONLINE       0     0     0
            sdl1     ONLINE       0     0     0
            sdn1     ONLINE       0     0     0
            sdm1     ONLINE       0     0     0
          raidz1-3   ONLINE       0     0     0
            sdi2     ONLINE       0     0     0
            sdj2     ONLINE       0     0     0
            sdk2     ONLINE       0     0     0
            sdl2     ONLINE       0     0     0
            sdn2     ONLINE       0     0     0
            sdm2     ONLINE       0     0     0
        special
          mirror-4   ONLINE       0     0     0
            nvme0n1  ONLINE       0     0     0
            nvme1n1  ONLINE       0     0     0

errors: No known data errors
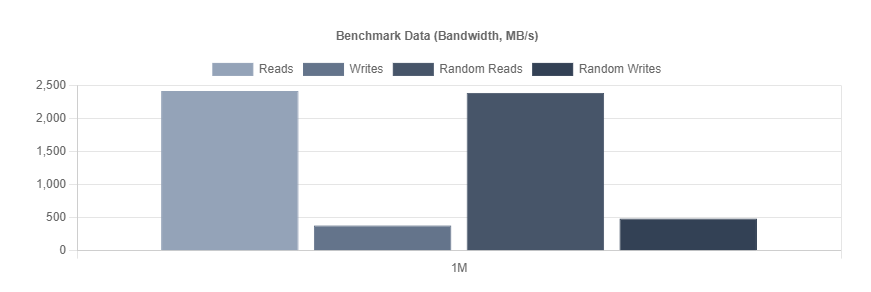
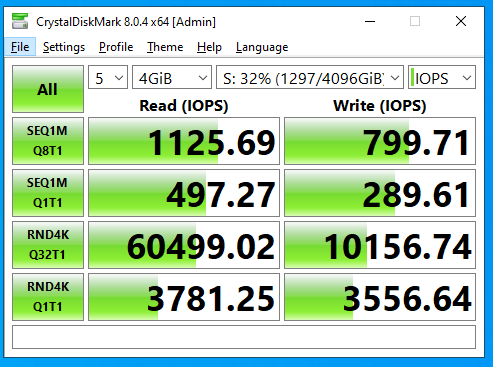
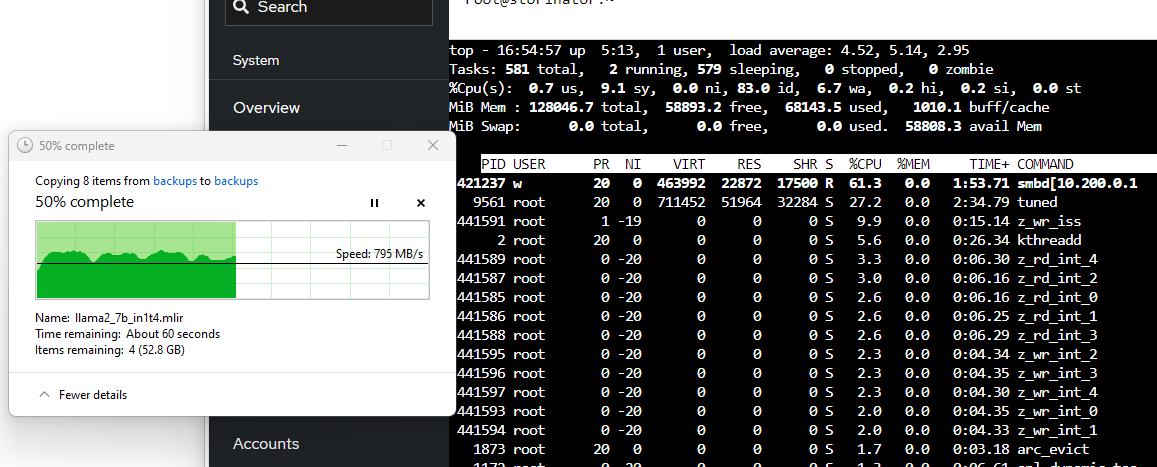
With Recordsize=1M
and
(notice the speed and load average here vs 128k record size)
and
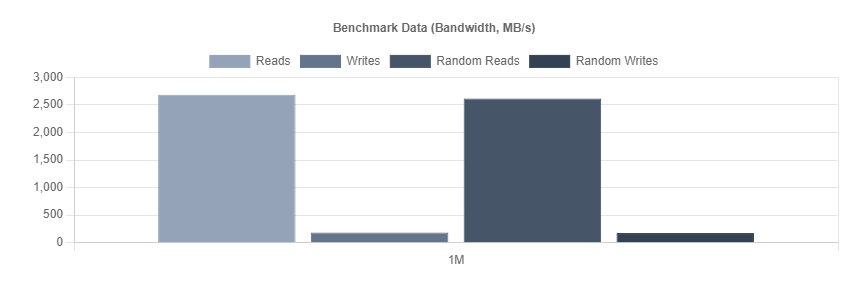
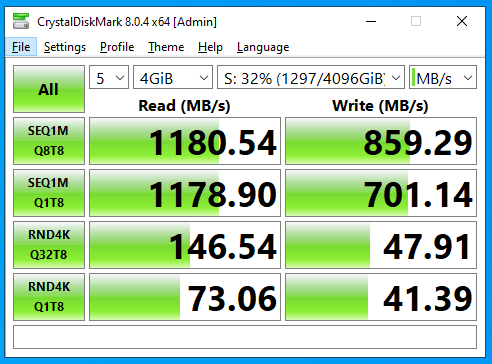
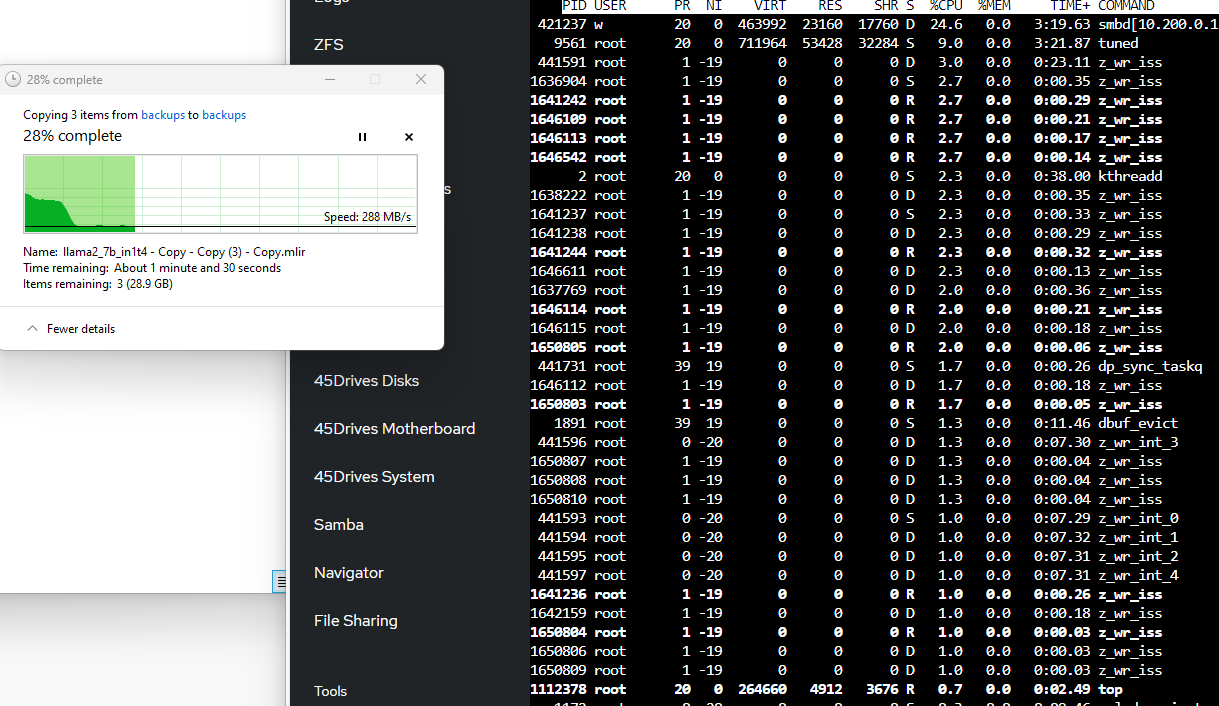
With Recordsize=128k
and
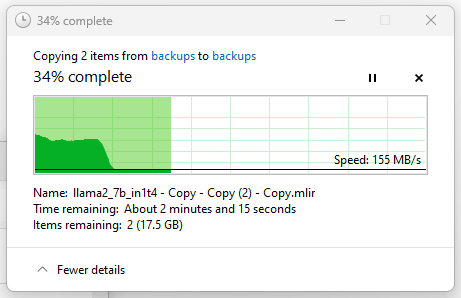
(my gut is this is lower than expected! Given the write speed of individual devices in the vdevs are higher than this. Possibly the clue to why is in the load average. )
and
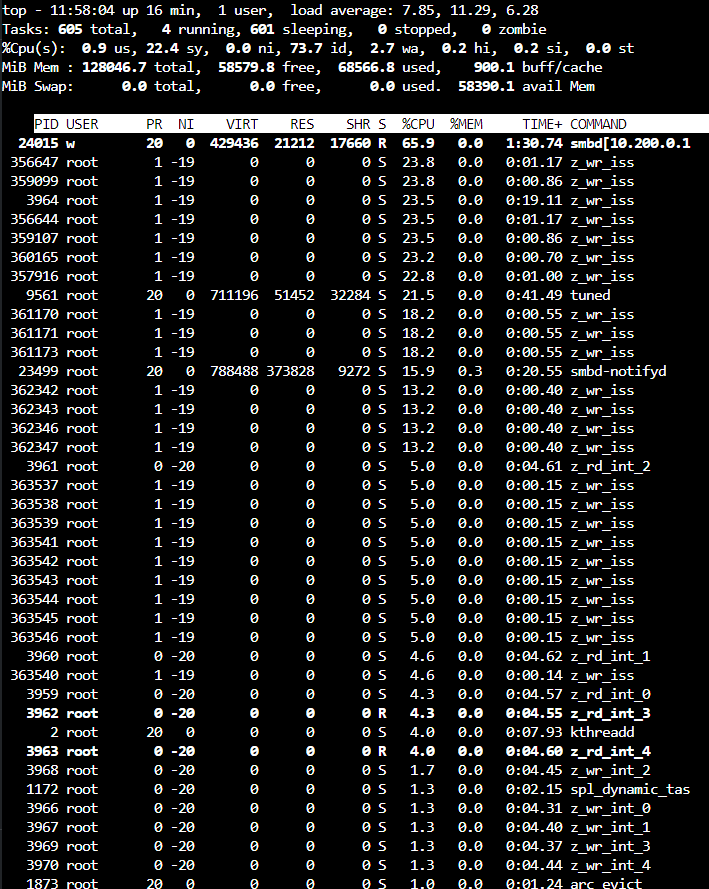
Writing
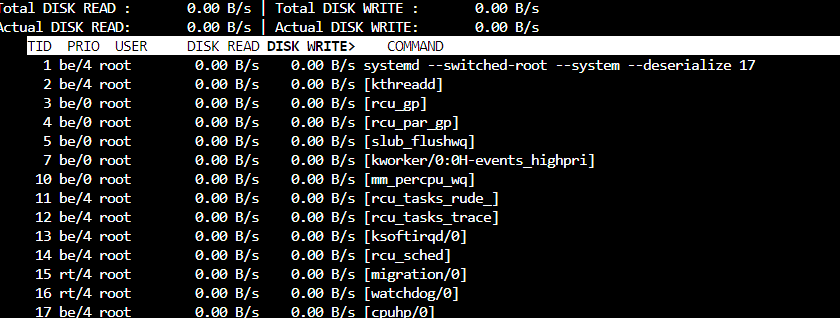
Since this is a fresh pool, iostats show background write hum even when the pool is idle. Consider I/O top:
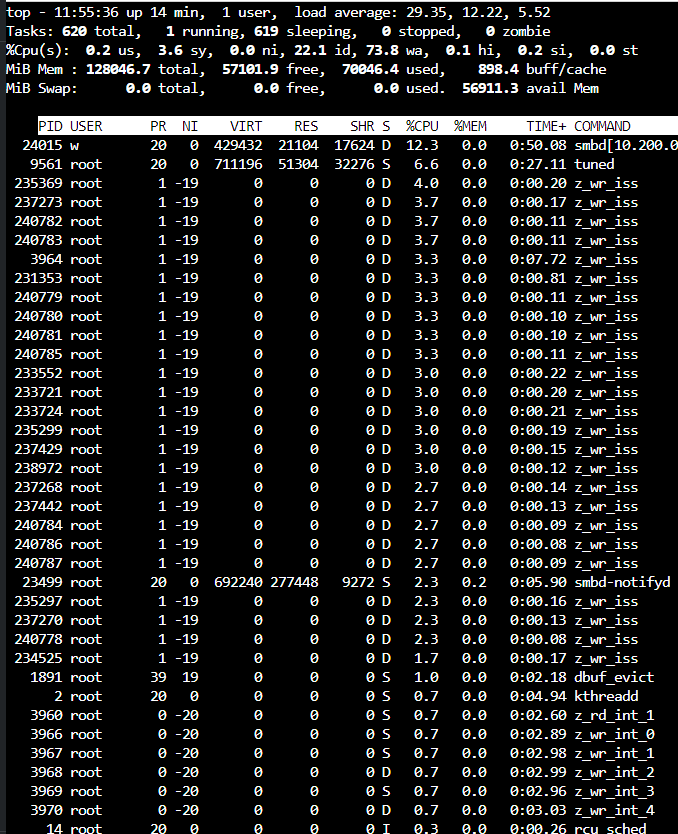
vs
The pool is empty except for one dataset which has a dnode size of “Auto” . Dedupe and other exotic options are off. txg_sync is changed from 5 to 60 seconds.
It might be Saturday morning brain fog but I don’t remember new zfs pools having this much “idle” write bandwidth, but I do have a vague recollection of this and forgot what I knew then. I have only copied test data into this pool with different record sizes, and I’ve done one scrub which is now finished.
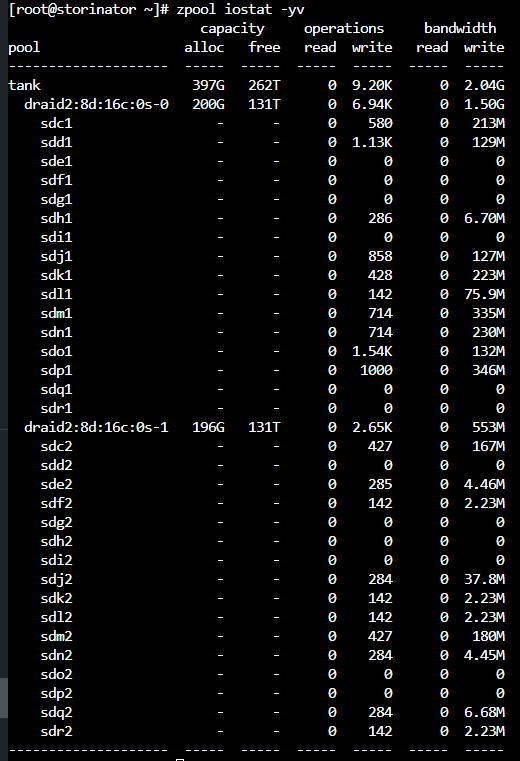
dRAID
I decided to try dRAID even though I kinda don’t think this is enough disks. I added 4 more matching disks and re-created the array.
[root@storinator ~]# zpool status
  pool: tank
 state: ONLINE
config:

        NAME                  STATE     READ WRITE CKSUM
        tank                  ONLINE       0     0     0
          draid2:8d:16c:0s-0  ONLINE       0     0     0
            sdc1              ONLINE       0     0     0
            sdd1              ONLINE       0     0     0
            sde1              ONLINE       0     0     0
            sdf1              ONLINE       0     0     0
            sdg1              ONLINE       0     0     0
            sdh1              ONLINE       0     0     0
            sdi1              ONLINE       0     0     0
            sdj1              ONLINE       0     0     0
            sdk1              ONLINE       0     0     0
            sdl1              ONLINE       0     0     0
            sdm1              ONLINE       0     0     0
            sdn1              ONLINE       0     0     0
            sdo1              ONLINE       0     0     0
            sdp1              ONLINE       0     0     0
            sdq1              ONLINE       0     0     0
            sdr1              ONLINE       0     0     0
          draid2:8d:16c:0s-1  ONLINE       0     0     0
            sdc2              ONLINE       0     0     0
            sdd2              ONLINE       0     0     0
            sde2              ONLINE       0     0     0
            sdf2              ONLINE       0     0     0
            sdg2              ONLINE       0     0     0
            sdh2              ONLINE       0     0     0
            sdi2              ONLINE       0     0     0
            sdj2              ONLINE       0     0     0
            sdk2              ONLINE       0     0     0
            sdl2              ONLINE       0     0     0
            sdm2              ONLINE       0     0     0
            sdn2              ONLINE       0     0     0
            sdo2              ONLINE       0     0     0
            sdp2              ONLINE       0     0     0
            sdq2              ONLINE       0     0     0
            sdr2              ONLINE       0     0     0
Even with the added drives we only added a little bit more capacity.
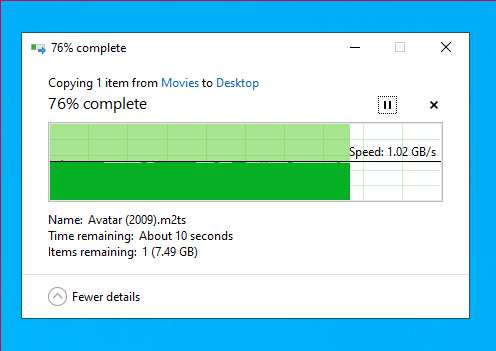
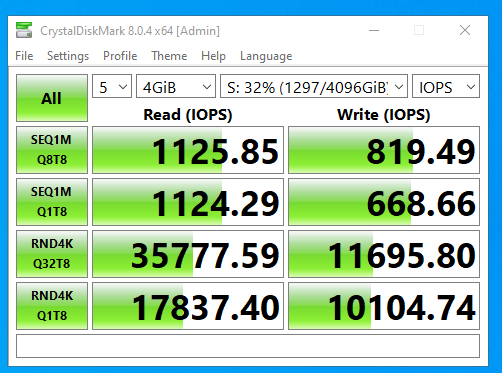
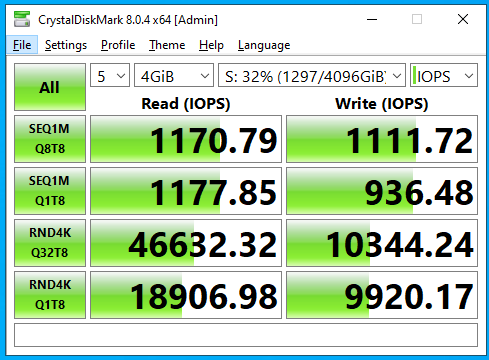
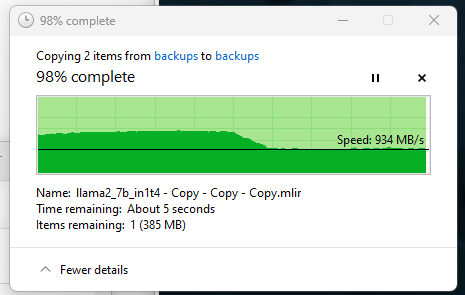
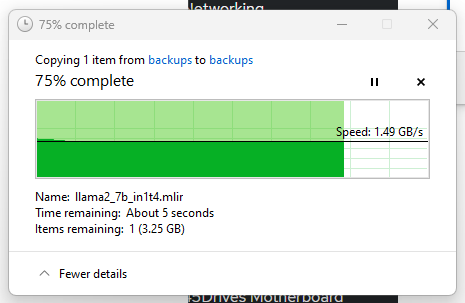
At 64k record size, with a simple samba file copy, the performance is about the same as raidz1:
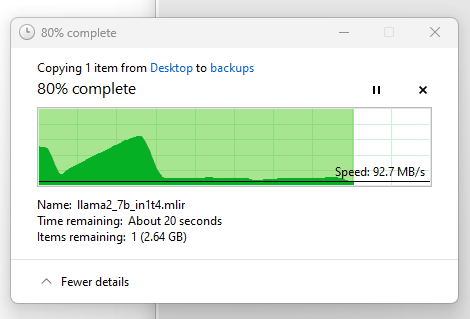
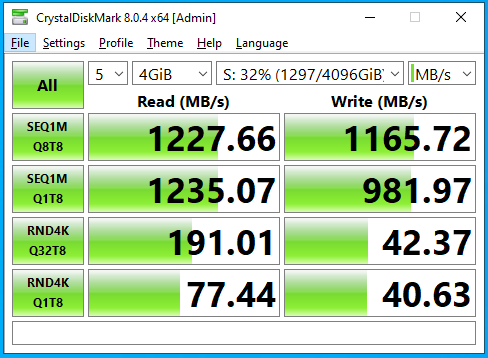
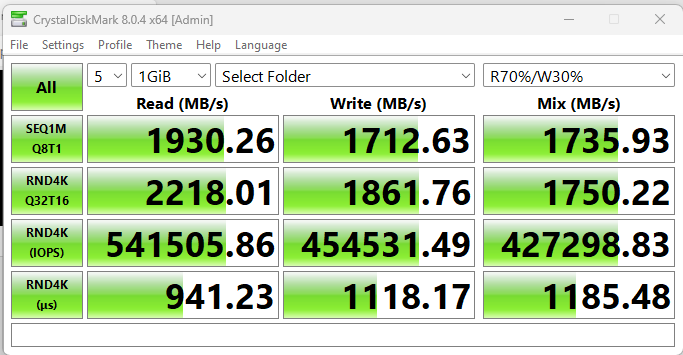
1mb record size however is nicer:
… perhaps with the lowest cpu utilization I’ve seen yet? though I think that is a bit unexpected, and this is sustained writes for more than a minute
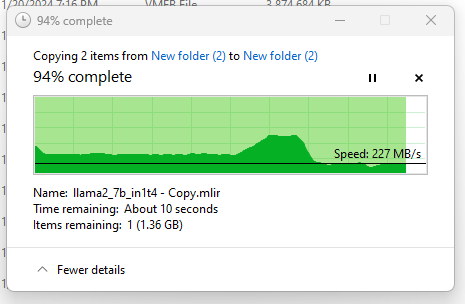
… smaller record size (128k), lot more cpu intensity when you have a LOT of small records to write:
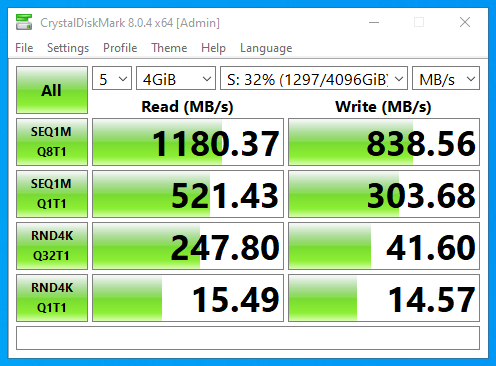
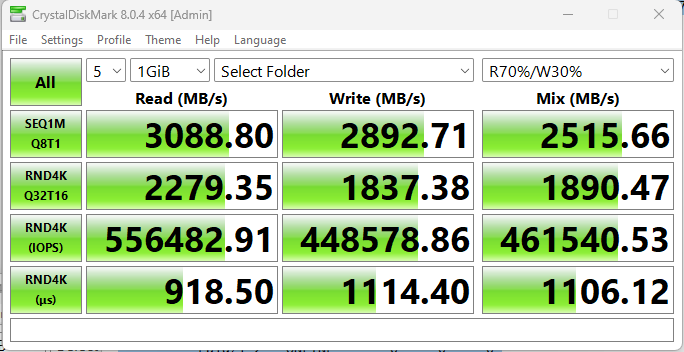
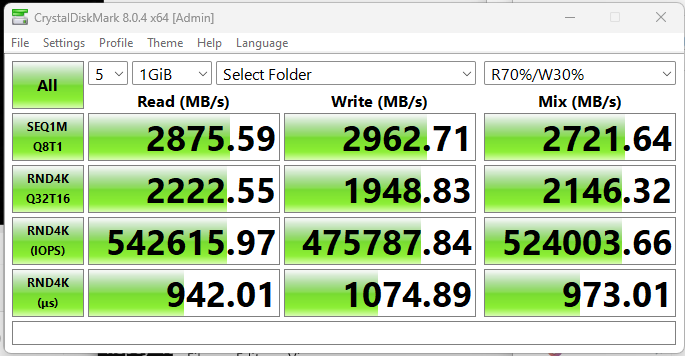
cdm performance at 64k is pretty good though with draid
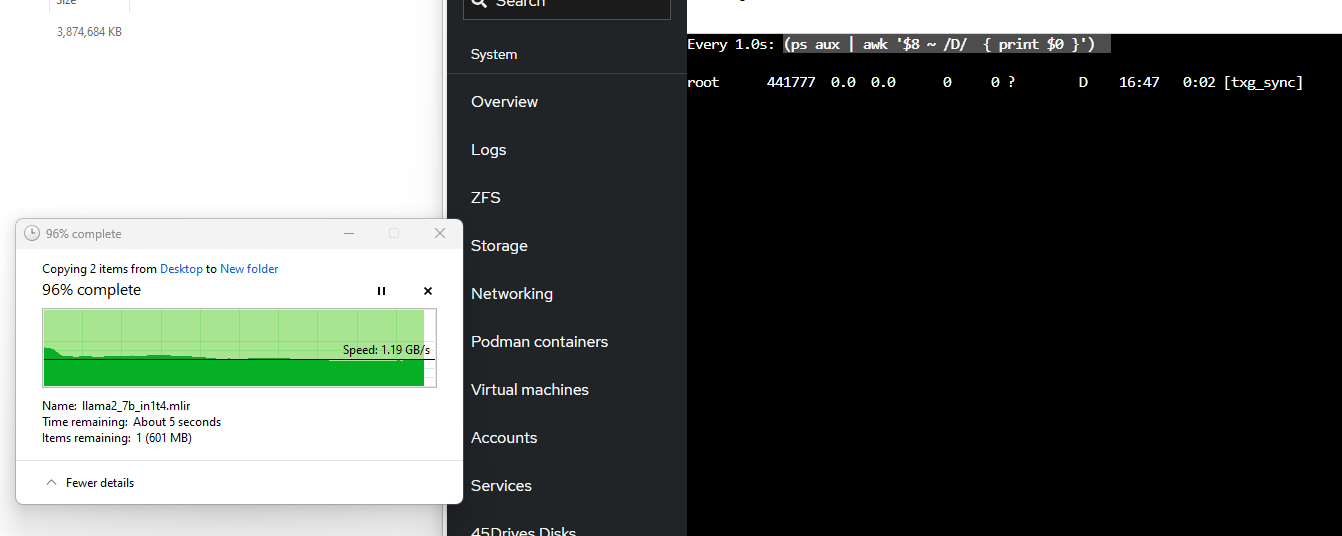
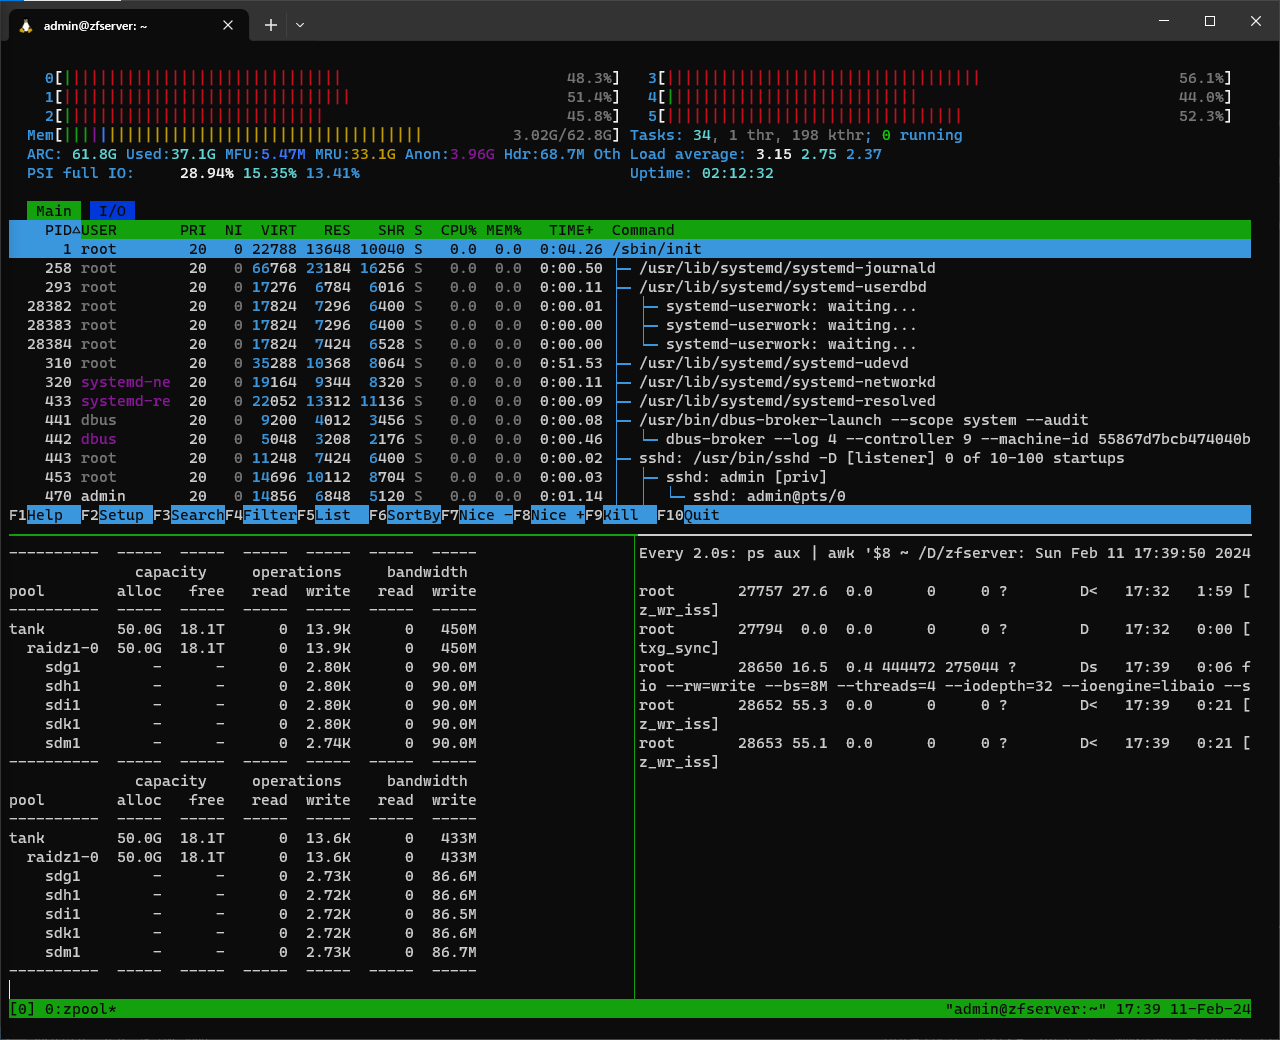
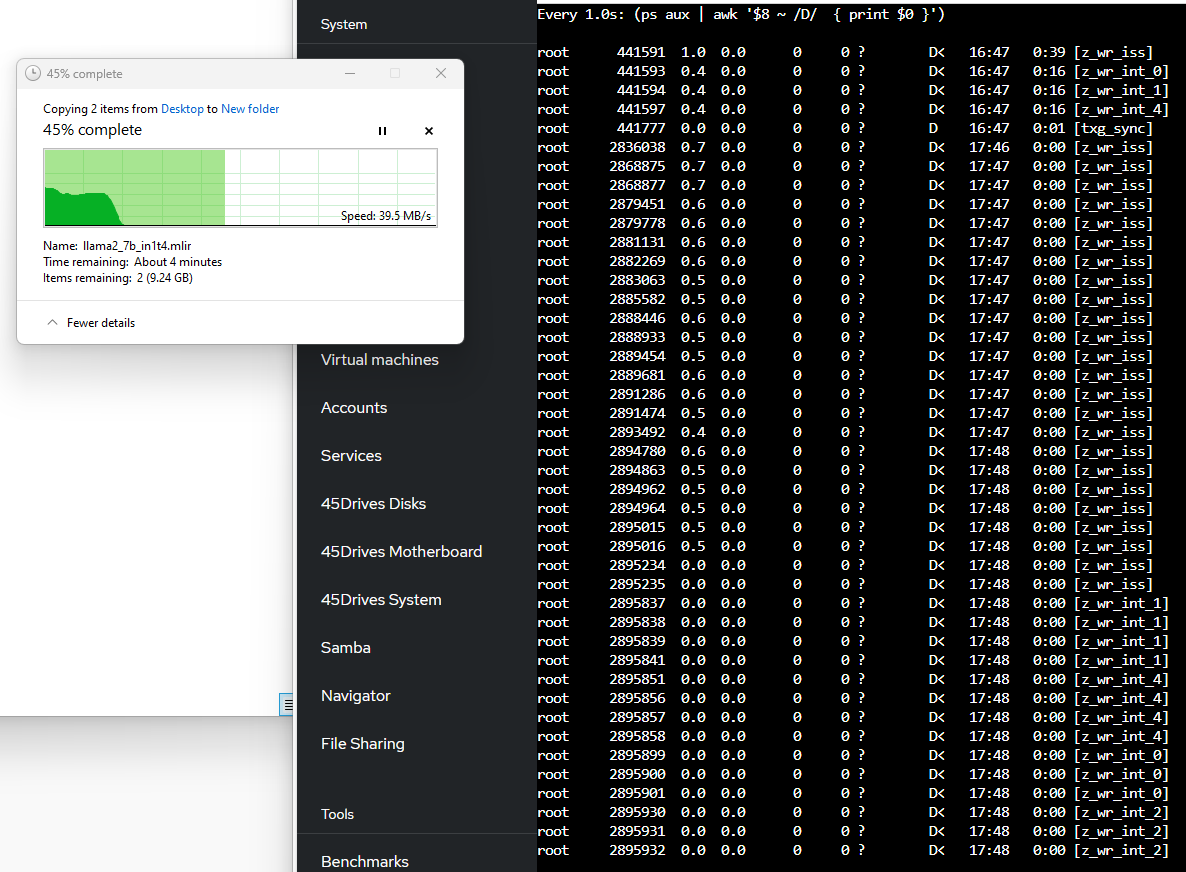
One thing I like to do to check to see what processes are actually waiting on disk I/O. iostat doesn’t really help you with this, that I’m aware of
(ps aux | awk '$8 ~ /D/ { print $0 }')
fortunately PS can tell us
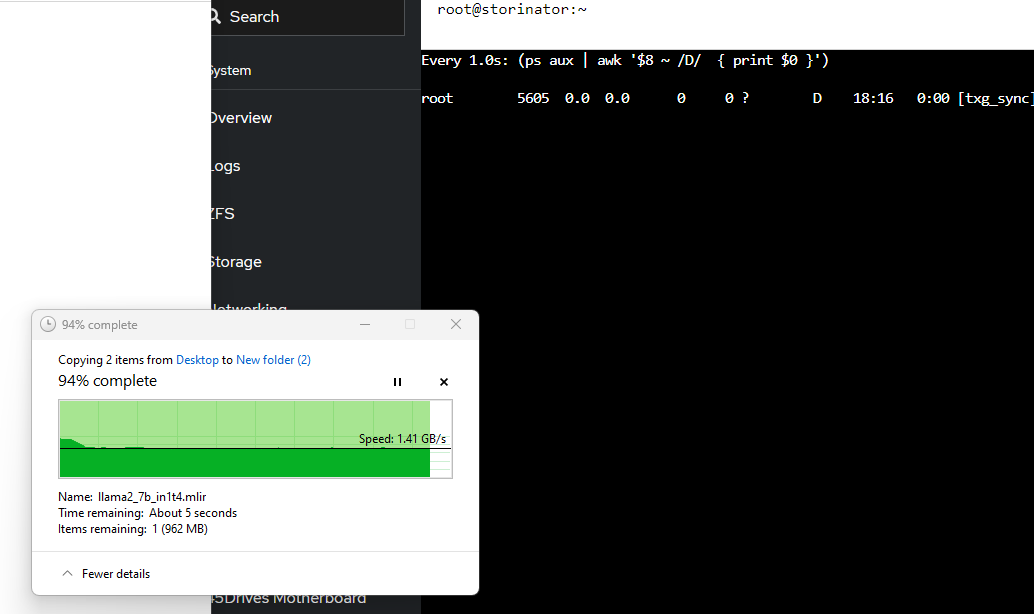
This is what it looks like with a small record size:
… and with a large record size: