[WIP testing{Update: it's not just Alder Lake, it goes back to Nehalem}] GCC 50+% performance regressions vs Clang and intel compilers in specific workloads (across all opt settings)

TLDR; GCC might have architectural problems that bork performance on Alder lake/ Golden Cove cores for certain operations.

Hi Ladies and Gents,

I’ve been continuing in my adventures with Alder lake performance profiling and have now started to dig down the rabbit hole of different data structures/memory allocation patterns and how the compiler deals with them.

One classical problem is Binary trees.

for the same piece of code (git repo at the bottom of this post with instructions on how to run, flags used etc.) GCC version 7-12 inclusive is showing performance 50+% slower compared to Clang 11-13 (LLVM), Intel

ICC (closed source) and Intel ICX (LLVM)

compiler_comparison_binarry_trees

The code isn’t meant to be the most complex, nor is it meant to be slow. It doesn’t make use of any non standard language features

It’s also not as if the GCC files are larger or smaller than the intel or Clang versions:
The fastest Clang is 18k , GCC is 21k, ICC is 59k and ICX is 64k

18K cpu_clang11_fast_opt
18K cpu_clang12_fast_opt
18K cpu_clang13_fast_opt
25K cpu_gcc10_fast_opt
25K cpu_gcc11_fast_opt
25K cpu_gcc12_fast_opt
29K cpu_gcc7_fast_opt
21K cpu_gcc8_fast_opt
21K cpu_gcc9_fast_opt
59K cpu_icc_fast_opt
64K cpu_icpx_unsafe_opt

Git repo is here: GitHub-FCLC-Choosing a Compiler:GCC_ICC_ICX_CLANG_HIP_NVCC/Binary-tree

If anyone else can replicate or contradict these results that would be superb.

Test platform is:
Intel core i7-12700k
DDR4 3200 CL-15 16 16 36
rx5600xt
Kernel: 5.15.5-76051505-generic
Host: Pop!_OS 21.10 with Debian SID repositories

For ICX ICC, CLANG 11 12 13 GCC 10+ CFLAGS=-O3 -march=native -mavx512f -mavx512dq -mavx512ifma -mavx512cd -mavx512bw -mavx512vl -mavx512bf16 -mavx512vbmi -mavx512vbmi2 -mavx512vnni -mavx512bitalg -mavx512vpopcntdq -mavx512vp2intersect

For GCC 8 and 9 CFLAGS=-O3 -march=native -mavx512f -mavx512dq -mavx512ifma -mavx512cd -mavx512bw -mavx512vl -mavx512vbmi -mavx512vbmi2 -mavx512vnni -mavx512bitalg -mavx512vpopcntdq

For GCC 7 CFLAGS=-O3 -march=native -mavx512f -mavx512dq -mavx512ifma -mavx512cd -mavx512bw -mavx512vl -mavx512vbmi -mavx512vpopcntdq

Note on CFLAGS: GCC 9 and lower get different flags due to lack of support for certain instructions. Instructions are specifically defined as supported to make sure that the compilers are on an even playing field in regards to the knowledge of the underlying available hardware instructions.

Technically the option CFLAGS='-O3 -march=sapphirerapids -mno-amx-tile -mno-amx-int8 -mno-amx-bf16' could be used to provide a 1% uplift in certain scenarios as seen here in my discussions around the 1M iops per core on ADL twitter thread twitter link but this would negate the goal of as even a playing field as possible for all supported instructions.

Note on GCC-12: Technically GCC-12 is not released yet. I’m running pop!_OS 21.10 with the Debian SID repositories. the specific build of GCC-12 in use as returned by gcc-12 -v gcc version 12.0.0 20211211 (experimental) [master r12-5906-g2e8067041d1] (Debian 12-20211211-1) from the official repositories.

4 Likes

Have you checked compiler explorer / compared different march settings?

I just set off the script to test with the above sapphire rapids option at tree depth 26 (same as above), and after will also explicitly do -march=alderlake instead of -march=native.

I haven’t updated/pulled any new package versions and the machine has been idle or running other tests since, so results should be comparable within margin of error (especially considering the deviation observed above).

1 Like

Will make up some pretty graphs later, but direct results as created by my script:

Note: GCC 10 does not have Sapphire Rapids or AlderLake ISA’s built in. Therefore for the next 2 tests it will use $OldCFlags like GCC 8 and 9. (not that it made a difference, the outcome was pretty much the same)

Next up is -march=alderlake+mavx512[all available] and then -march=native with no explicit instructions mandated

felix@pop-os:~/tmp/Choosing-a-compiler-performance-testing-GCC_ICC_ICPX_NVCC_CLANG_HIP/Binary_tree$ ./quick_benchmark.sh 
	Welcome to the quick and dirty compiler profiler!

	Running this script can take a long time, but can provide interesting results for your system.
	Currently this version tests the MAXIMUM optimizations levels of:
	GCC 7 8 9 10 11 12
	Clang 11 12 13
	Intel ICPX/ICPC

	This MAY take a LONG time, I suggest going to get a cup of coffee/tea etc.
cleaning up


gcc numbers 7 8 9 10 11 12
time taken is 380.052467 
time taken is 387.219329 
time taken is 379.783137 
time taken is 382.346531 
time taken is 381.889371 
time taken is 384.310839 

clang numbers 11 12 13
time taken is 248.054976 
time taken is 282.348245 
time taken is 281.762007 

intel numbers icc icx
time taken is 248.721047 
time taken is 248.135631 

Above tests were completed with Tree size of 26
You can modify this number via enviroment variable. Remember that larger trees take up more system memory
If no number is printed or you got a segfault, try setting $TREEDEPTH. A low number such as 16 is a good starting point

Also make sure you set your AVX flags correctly. To print the AVX(1, 2 or 512) instructions supported by your system, use the provided "detect_avx.sh" script
You can then use "CFLAGS=`./detect_avx.sh`" to add the flags directly. Any unsupported flags will be caught (and complained about) by your compiler
Different compilers support different levels of AVX. For the sake of convenience this script is setup to use 3 different levels of flags, deliniated at the gcc-10>=, gcc 8-9 and gcc-7<=
if set, they will now be printed:
-O3 -march=sapphirerapids -mno-amx-tile -mno-amx-int8 -mno-amx-bf16
-O3 -march=native -mavx512f -mavx512dq -mavx512ifma -mavx512cd -mavx512bw -mavx512vl -mavx512vbmi -mavx512vbmi2 -mavx512vnni -mavx512bitalg -mavx512vpopcntdq
-O3 -march=native -mavx512f -mavx512dq -mavx512ifma -mavx512cd -mavx512bw -mavx512vl -mavx512vbmi -mavx512vpopcntdq

Pattern seems to be holding so far, with the expected behaviour of the brute force addition of AVX instruction to march=alderlake performing worse than march=sapphirerapids due to a lack of cost functions in the compiler leaving some performance on the table


Welcome to the quick and dirty compiler profiler!

	Running this script can take a long time, but can provide interesting results for your system.
	Currently this version tests the MAXIMUM optimizations levels of:
	GCC 7 8 9 10 11 12
	Clang 11 12 13
	Intel ICPX/ICPC

	This MAY take a LONG time, I suggest going to get a cup of coffee/tea etc.
cleaning up


gcc numbers 7 8 9 10 11 12
time taken is 386.470181 
time taken is 392.737532 
time taken is 389.108082 
time taken is 386.170816 
time taken is 382.897062 
time taken is 387.529628 

clang numbers 11 12 13
time taken is 249.511987 
time taken is 282.076344 
time taken is 287.828877 

intel numbers icc icx
time taken is 258.130787 
time taken is 250.540465 

Above tests were completed with Tree size of 26
You can modify this number via enviroment variable. Remember that larger trees take up more system memory
If no number is printed or you got a segfault, try setting $TREEDEPTH. A low number such as 16 is a good starting point

Also make sure you set your AVX flags correctly. To print the AVX(1, 2 or 512) instructions supported by your system, use the provided "detect_avx.sh" script
You can then use "CFLAGS=`./detect_avx.sh`" to add the flags directly. Any unsupported flags will be caught (and complained about) by your compiler
Different compilers support different levels of AVX. For the sake of convenience this script is setup to use 3 different levels of flags, deliniated at the gcc-10>=, gcc 8-9 and gcc-7<=
if set, they will now be printed:
-O3 -march=alderlake -mavx512f -mavx512dq -mavx512ifma -mavx512cd -mavx512bw -mavx512vl -mavx512bf16 -mavx512vbmi -mavx512vbmi2 -mavx512vnni -mavx512bitalg -mavx512vpopcntdq -mavx512vp2intersect
-O3 -march=native -mavx512f -mavx512dq -mavx512ifma -mavx512cd -mavx512bw -mavx512vl -mavx512vbmi -mavx512vbmi2 -mavx512vnni -mavx512bitalg -mavx512vpopcntdq
-O3 -march=native -mavx512f -mavx512dq -mavx512ifma -mavx512cd -mavx512bw -mavx512vl -mavx512vbmi -mavx512vpopcntdq

and finally march=native

Welcome to the quick and dirty compiler profiler!

	Running this script can take a long time, but can provide interesting results for your system.
	Currently this version tests the MAXIMUM optimizations levels of:
	GCC 7 8 9 10 11 12
	Clang 11 12 13
	Intel ICPX/ICPC

	This MAY take a LONG time, I suggest going to get a cup of coffee/tea etc.
cleaning up


gcc numbers 7 8 9 10 11 12
time taken is 380.360024 
time taken is 388.017744 
time taken is 378.031155 
time taken is 379.901424 
time taken is 393.781361 
time taken is 383.843951 

clang numbers 11 12 13
time taken is 248.368887 
time taken is 281.682997 
time taken is 282.373693 

intel numbers icc icx
time taken is 248.077539 
time taken is 247.613163 

Above tests were completed with Tree size of 26
You can modify this number via enviroment variable. Remember that larger trees take up more system memory
If no number is printed or you got a segfault, try setting $TREEDEPTH. A low number such as 16 is a good starting point

Also make sure you set your AVX flags correctly. To print the AVX(1, 2 or 512) instructions supported by your system, use the provided "detect_avx.sh" script
You can then use "CFLAGS=`./detect_avx.sh`" to add the flags directly. Any unsupported flags will be caught (and complained about) by your compiler
Different compilers support different levels of AVX. For the sake of convenience this script is setup to use 3 different levels of flags, delineated at the gcc-10>=, gcc 8-9 and gcc-7<=
if set, they will now be printed:
-O3 -march=native
-O3 -march=native
-O3 -march=native

it’s obvious the compiler is doing something stupid since you’re running in such a big diff.

Looking at godbolt …

… I notice that the clang output is looking incredibly naive/compact compared to gcc and icc, and yet it has good performance.

Looking at the c code, this is incredibly branchy code. Maybe some of the inlining GCC is doing is doing more harm than good and messing up caches inside of the CPU.

What if you remove all the avx flags?

Btw, you should be able to cleanup the source code a little bit (e.g. replace pow(2, ... with 1<<... thus removing a dependency on math and so on).

1 Like

Agreed, that’s mostly my point in saying that GCC all the way back to GCC7 in the way it’s designed/built producing stupid results, with or without AVX512 flags (each output shows all the flags used at the bottom, post 5 was -march=native with no additional flags.)

In case it was weirdness with AVX512 being recognized on alderLake and the Ecores/graceMount cores not being present, I ran the script after enabling the ecore’s in bios (which has the effect of disabling AVX512 completely, and lowering the ring bus frequency to ~ ecore multiplier -3*BCLK instead of when ecores are disabled, being pcore multiplier -3 * BCLK)

Results with Pcores +Ecores enabled, no updated packages since previous run, same kernel, cooler etc.:

Welcome to the quick and dirty compiler profiler!

	Running this script can take a long time, but can provide interesting results for your system.
	Currently this version tests the MAXIMUM optimizations levels of:
	GCC 7 8 9 10 11 12
	Clang 11 12 13
	Intel ICPX/ICPC

	This MAY take a LONG time, I suggest going to get a cup of coffee/tea etc.
cleaning up


gcc numbers 7 8 9 10 11 12
time taken is 386.007134
time taken is 407.483826
time taken is 386.306785 
time taken is 391.859251
time taken is 396.877363
time taken is 395.557556 

clang numbers 11 12 13
time taken is 251.747729 
time taken is 287.440665
time taken is 287.342336 

intel numbers icc icx
time taken is 253.182672 
time taken is 252.640293 

Above tests were completed with Tree size of 26
You can modify this number via environment variable. Remember that larger trees take up more system memory
If no number is printed or you got a segfault, try setting $TREEDEPTH. A low number such as 16 is a good starting point

Also make sure you set your AVX flags correctly. To print the AVX(1, 2 or 512) instructions supported by your system, use the provided "detect_avx.sh" script
You can then use "CFLAGS=`./detect_avx.sh`" to add the flags directly. Any unsupported flags will be caught (and complained about) by your compiler
Different compilers support different levels of AVX. For the sake of convenience this script is setup to use 3 different levels of flags, delineated at the gcc-10>=, gcc 8-9 and gcc-7<=
if set, they will now be printed:
-O3 -march=native
-O3 -march=native
-O3 -march=native

More than happy to implement any changes in source, but the goal is also to not give the compiler too much obvious stuff to take advantage of.

I’m trying to test how, with a fairly but not completely obvious case, the compiler deals with optimizing code bases. MKL for example pre optimized per chip options that could deal with this IIRC, but since that’s already hand opt asm, it wouldn’t serve much purpose in this testing.

For example, tho I’ve been focusing on the GCC performance deficit, another concern is that clang seems to have worsened over time. Clang 13 seems to have improved over 12 in some cases, but also worsened in others, as would be expected, but both are worse than clang 11 by ~15%

As for the specific results shown by goldbolt, the results are vary interesting. Removing the filters to make sure nothing is missed:

They all us AVX1 for the main pow funtion

GCC 11.2

        mov     eax, DWORD PTR [rsp+60]
        vxorpd  xmm5, xmm5, xmm5
        sub     eax, ebx
        vcvtusi2sd      xmm1, xmm5, eax
        mov     rax, QWORD PTR .LC0[rip]
        vmovq   xmm0, rax
        call    pow

ICC

        vxorpd    xmm0, xmm0, xmm0                              #105.22
        vcvtusi2sd xmm0, xmm0, ebx                              #105.22
        call      exp2                                          #105.22
        vcvttsd2si rcx, xmm0                                    #105.22

Clang 13

        mov     eax, r12d
        sub     eax, r13d
        vcvtusi2sd      xmm0, xmm1, eax
        call    exp2@PLT
        vcvttsd2si      rbp, xmm0

Overall use of AVX1/xmm registers is where things get weird

ICC on the other hand only makes 13 avx calls of the XMM registers, and even then only ever uses XMM0

Clang makes 12 avx calls using xmm0 for the most part, but also using xmm1 a few times for some non destructive caching from the looks of it

GCC seems to be using as much AVX1 as it possibly can, with ~500 instances of the XMM registers in this relatively small piece of code :eyes: Using 8 different XMM registers, many of which seem to be used to fetch memory in more continuous chuncks(?) but also then casting down so older SIMD for other operations, moving them back and fourth within each other etc.

For example see

        vpinsrq xmm0, xmm7, r13, 1
        vmovdqu XMMWORD PTR [rax], xmm0

Unless I’m mistaken, we’re copying a single element out of an AVX register, instead of actually making use of the ability to move large amounts of data simultaneously, the point of xmm registers.

2 Likes

WARNING: May contain signs of someone SLOWLY losing it:

You may want to have this open while reading the below to compare the assembly produced by different compilers:Compiler Explorer

Now to your regularly scheduled programming :wink:

The initial exploration:

I’m now certain this is fundamental in the way GCC is detecting/producing code in general for this program type, and is not architecture dependent at all And/or I’m loosing my marbles(?) :honkler: :thonk:.

First, I ran with

-O3 -march=nehalem -mtune=native

I’m STILL getting nearly the same results as before, so it isn’t only an AVX thing, as the code didn’t generate any AVX instructions at all, as would be expected, instead generating SSE4_1 and 4_2 instructions.

Below the -march=nehalem -mtune=native I’ve posted march=nehalam only to re-confirm it isn’t related to weird tuning parameters for alder lake. See the “The Compiler results” Header for the data.

For the express reason of ridiculousness, I then tried -O3 -march=nehalem -fno-inline-small-functions -mavx512f -mavx512dq -mavx512ifma -mavx512cd -mavx512bw -mavx512vl -mavx512bf16 -mavx512vbmi -mavx512vbmi2 -mavx512vnni -mavx512bitalg -mavx512vpopcntdq -mavx512vp2intersect -mavx512fp16

This enabled in-lining, which was then disabled, limiting instructions to a max of sse4_2 and older, indicated to tune for nehalem, then allowed for usage of all of the most recent/advanced AVX512 instructions outside of those on Xeon PHI.

None of the 3 compiler families create any AVX512 code, which was slightly surprising, but I suspect may have to do with not having a cost function. I’ve never done such a weird config before, using instructions that only became available a month ago and telling the compiler to use them with a 13 year old architecture (sidebar: how is nehalem 13 years ago??? November 2008 )

Finally, some good news however:

The -fno-inline-small-functions reduced our assembly size slightly, but much more importantly, made it resemble the Clang and ICC/ICX assembly much more often.

for example, the pow() function is now:

GCC no *small* inline
        pxor    xmm1, xmm1
        mov     r15d, 1
        lea     ebp, [r12+4]
        sub     eax, r12d
        cvtsi2sd        xmm1, rax
        mov     rax, QWORD PTR .LC0[rip]
        movq    xmm0, rax
        call    pow
        cvttsd2si       rbx, xmm0
        test    rbx, rbx
        je      .L29
.L26:
        mov     edi, ebp
        add     r15, 1
        call    BottomUpTree
        mov     rdx, rax
        mov     rdi, rax
        call    ItemCheck
        mov     rdi, rdx
        call    DeleteTree
        cmp     rbx, r15
        jge     .L26

or

GCC no inline
.L27:
        vxorpd  xmm2, xmm2, xmm2
        lea     r12d, [r13+4]
        mov     eax, r14d
        sub     eax, r13d
        vcvtusi2sd      xmm1, xmm2, eax
        mov     rax, QWORD PTR .LC0[rip]
        vmovq   xmm0, rax
        call    pow
        vcvttsd2si      rbp, xmm0
        test    rbp, rbp
        je      .L23
        mov     ebx, 1

as opposed to

GCC normal
        vxorpd  xmm2, xmm2, xmm2
        mov     r15d, 1
        lea     ebp, [r12+4]
.LVL34:
       sub     eax, r12d
        vcvtusi2sd      xmm1, xmm2, eax
        mov     rax, QWORD PTR .LC0[rip]
        vmovq   xmm0, rax
        call    pow

Where as for the same no inline flag equivalents, clang and intel compilers output:

ICC no inline
     .LN48:
        vxorpd    xmm0, xmm0, xmm0                              #105.22
        .mov       r14d, 1                                       #109.14
        vcvtusi2sd xmm0, xmm0, ebx                              #105.22
        call      exp2                                          #105.22
        vcvttsd2si r12, xmm0                                    #105.22
        test      r12, r12                                      #109.26
        jle       ..B1.14       # Prob 10%                      #109.26

and

Clang no inline
.LBB4_1:                                # =>This Loop Header: Depth=1
        mov     eax, r12d
        sub     eax, r13d
        vcvtusi2sd      xmm0, xmm1, eax
        call    exp2@PLT
        vcvttsd2si      rbp, xmm0

Down The Rabbit hole

At Treedepth=26 results with all 12 compilers have been taking ~1h per sweep, but with results so consistent, it’s reasonable to cut out everything but the sub groups that perform differently:
GCC-12 for GCC
Clang 13 for Clang
and ICC for Intel

At this point, we can ignore legacy options, and pull out all the stops.

From now on the baseline compiler flag is -O3 -march=sapphirerapids -mno-amx-tile -mno-amx-int8 -mno-amx-bf16 Which I’ve found to be the most performant set of Pcore only compiler flags on Alder Lake with AVX512 enabled. (Gives a consistent 1 to 2 percent uplift in I/O for example)

Step one: make sure it isn’t weirdness with opt settings:

Results from the baseline above were: -O3 -march=sapphirerapids -mno-amx-tile -mno-amx-int8 -mno-amx-bf16

gcc 12 time taken is 413.502944 
clang 13 time taken is 283.297773 
intel icc time taken is 246.351291

Then -Ofast -march=sapphirerapids -mno-amx-tile -mno-amx-int8 -mno-amx-bf16 produced

gcc 12 time taken is 391.809389 
clang 13 time taken is 281.122563 
intel icc time taken is 244.576035 

Moving to -O1 -march=sapphirerapids -mno-amx-tile -mno-amx-int8 -mno-amx-bf16 yielded

gcc 12 time taken is 414.762074 
clang 13 time taken is 283.058792 
intel icc time taken is 246.912347 

Which is frankly ludicrous to me that O1 is within margin or error from Ofast and O3, meaning that -O0 was next in line.

Running with -O0 -march=sapphirerapids -mno-amx-tile -mno-amx-int8 -mno-amx-bf16

gcc 12 time taken is 483.183693 
clang 13 time taken is 338.256443 
intel icc time taken is 355.155574 

Now, the results above are slower, but if you look at the performance delta, we’re still in the ~40-50% performance delta range.

I think I need to put this down for a little bit and mull it over.

Path forward

At this point It’s fair to say that this is fundamental to GCC, regardless of version.

Is it a weird edge case? Without a doubt. Simultaneously, for such simple code (it’s just a binary tree after all) it’s very strange to see this sort of behavior.

Next step is to modify the data structures and watch how the compilers changes in terms of performance relative to each other.

Side bar

Slightly concerning is the Clang results having gotten worse after clang 11, and that Clang 13 was stagnant with Clang 12

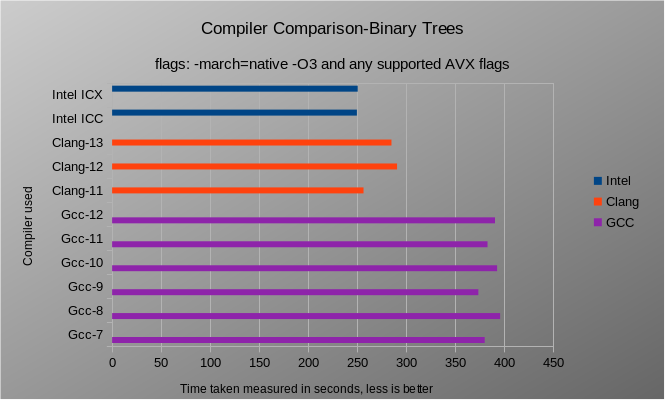
The Compiler results:

Lots of data:

-O3 -march=nehalem -mtune=native


	Running this script can take a long time, but can provide interesting results for your system.
	Currently this version tests the MAXIMUM optimizations levels of:
	GCC 7 8 9 10 11 12
	Clang 11 12 13
	Intel ICPX/ICPC

	This MAY take a LONG time, I suggest going to get a cup of coffee/tea etc.
cleaning up


gcc numbers 7 8 9 10 11 12
time taken is 378.633921 
time taken is 388.759841 
time taken is 398.505542 
time taken is 396.185356 
time taken is 389.246530 
time taken is 383.175040 

clang numbers 11 12 13
time taken is 247.940912 
time taken is 281.304001 
time taken is 281.172159 

intel numbers icc icx
time taken is 247.721858 
time taken is 247.919625 

Above tests were completed with Tree size of 26
You can modify this number via enviroment variable. Remember that larger trees take up more system memory
If no number is printed or you got a segfault, try setting $TREEDEPTH. A low number such as 16 is a good starting point

Also make sure you set your AVX flags correctly. To print the AVX(1, 2 or 512) instructions supported by your system, use the provided "detect_avx.sh" script
You can then use "CFLAGS=`./detect_avx.sh`" to add the flags directly. Any unsupported flags will be caught (and complained about) by your compiler
Different compilers support different levels of AVX. For the sake of convenience this script is setup to use 3 different levels of flags, deliniated at the gcc-10>=, gcc 8-9 and gcc-7<=
if set, they will now be printed:
-O3 -march=nehalem -mtune=native

-O3 -march=nehalem

	Welcome to the quick and dirty compiler profiler!

	Running this script can take a long time, but can provide interesting results for your system.
	Currently this version tests the MAXIMUM optimizations levels of:
	GCC 7 8 9 10 11 12
	Clang 11 12 13
	Intel ICPX/ICPC

	This MAY take a LONG time, I suggest going to get a cup of coffee/tea etc.
cleaning up


gcc numbers 7 8 9 10 11 12
time taken is 377.909626 
time taken is 402.613440 
time taken is 380.637230 
time taken is 381.880265 
time taken is 394.721852 
time taken is 384.849122 

clang numbers 11 12 13
time taken is 247.223285 
time taken is 281.160776 
time taken is 281.889140 

intel numbers icc icx
time taken is 251.820126 
time taken is 250.232138 

Above tests were completed with Tree size of 26
You can modify this number via enviroment variable. Remember that larger trees take up more system memory
If no number is printed or you got a segfault, try setting $TREEDEPTH. A low number such as 16 is a good starting point

Also make sure you set your AVX flags correctly. To print the AVX(1, 2 or 512) instructions supported by your system, use the provided "detect_avx.sh" script
You can then use "CFLAGS=`./detect_avx.sh`" to add the flags directly. Any unsupported flags will be caught (and complained about) by your compiler
Different compilers support different levels of AVX. For the sake of convenience this script is setup to use 3 different levels of flags, deliniated at the gcc-10>=, gcc 8-9 and gcc-7<=
if set, they will now be printed:
-O3 -march=nehalem
-O3 -march=nehalem
-O3 -march=nehalem

export CFLAGS=’-O3 -march=nehalem -fno-inline-small-functions -mavx512f -mavx512dq -mavx512ifma -mavx512cd -mavx512bw -mavx512vl -mavx512bf16 -mavx512vbmi -mavx512vbmi2 -mavx512vnni -mavx512bitalg -mavx512vpopcntdq -mavx512vp2intersect -mavx512fp16’

	Welcome to the quick and dirty compiler profiler!

	Running this script can take a long time, but can provide interesting results for your system.
	Currently this version tests the MAXIMUM optimizations levels of:
	GCC 7 8 9 10 11 12
	Clang 11 12 13
	Intel ICPX/ICPC

	This MAY take a LONG time, I suggest going to get a cup of coffee/tea etc.
cleaning up


gcc numbers 7 8 9 10 11 12
time taken is 387.134731 
time taken is 402.971395 
time taken is 399.359678 
time taken is 394.730115 
./quick_benchmark.sh: line 31: ./cpu_gcc11_fast_opt: No such file or directory
time taken is 406.477327 

clang numbers 11 12 13
time taken is 248.450385 
time taken is 282.136717 
time taken is 281.579489 

intel numbers icc icx
time taken is 253.399868 
time taken is 253.133112 

Above tests were completed with Tree size of 26
You can modify this number via enviroment variable. Remember that larger trees take up more system memory
If no number is printed or you got a segfault, try setting $TREEDEPTH. A low number such as 16 is a good starting point

Also make sure you set your AVX flags correctly. To print the AVX(1, 2 or 512) instructions supported by your system, use the provided "detect_avx.sh" script
You can then use "CFLAGS=`./detect_avx.sh`" to add the flags directly. Any unsupported flags will be caught (and complained about) by your compiler
Different compilers support different levels of AVX. For the sake of convenience this script is setup to use 3 different levels of flags, deliniated at the gcc-10>=, gcc 8-9 and gcc-7<=
if set, they will now be printed:
-O3 -march=nehalem -fno-inline-small-functions -mavx512f -mavx512dq -mavx512ifma -mavx512cd -mavx512bw -mavx512vl -mavx512bf16 -mavx512vbmi -mavx512vbmi2 -mavx512vnni -mavx512bitalg -mavx512vpopcntdq -mavx512vp2intersect -mavx512fp16
-O3 -march=nehalem
-O3 -march=nehalem

GCC 11 fails due to lack of support for some AVX flags. Running it with AVX512FP16 removed yields a time of

export TREEDEPTH=26
gcc-11 binarytrees.c -o tmp $CFLAGS -lm
./tmp $TREEDEPTH 
time taken is 412.476479 
echo $CFLAGS 
-O3 -march=nehalem -fno-inline-small-functions -mavx512f -mavx512dq -mavx512ifma -mavx512cd -mavx512bw -mavx512vl -mavx512vbmi -mavx512vbmi2 -mavx512vnni -mavx512bitalg -mavx512vpopcntdq -mavx512vp2intersect
1 Like

Briefly ran a no flag run for piece of mind:

./very_quick_benchmark.sh 
	Welcome to the quick and dirty compiler profiler!

This is the fast version of the script which assumes you're only interested in the newest compilers (and/or add an additional option for testing a regression)
	Currently the default is the MAXIMUM optimizations of: 	GCC 12 	Clang 13 Intel ICC
	This MAY take a LONG time, but probably won't.
cleaning up

gcc 12
time taken is 490.230212 

clang 13
time taken is 341.391767 

intel numbers icc 
time taken is 243.609520 

Above tests were completed with Tree size of 26
This version of the script assumes you know what you're doing. If not, run /quick_benchmark or /benchmark instead for more exhaustive testing


Behaviour is expected, ICC defaults to highly optimized builds by default unless explicitly told not to.

Smalls updates:

  1. I’m adding Clang 14 to the suite of tests moving forward (logic is that, since gcc-12 is also pre-release, may as well extend the courtesy to clang as well)

  2. Any ideas/recommendations/requests on what to tackle next?

RE point 1

at tree depth 27:

gcc 12
time taken is 826.169036 

clang 13
time taken is 572.318110 

clang 14
time taken is 659.124352 

intel numbers icc 
time taken is 494.879815 

Above tests were completed with Tree size of 27
This version of the script assumes you know what you are doing. If not, run /quick_benchmark or /benchmark instead for more exhaustive testing
-O3 -march=native -mavx512f -mavx512dq -mavx512ifma -mavx512cd -mavx512bw -mavx512vl -mavx512vbmi -mavx512vbmi2 -mavx512vnni -mavx512bitalg -mavx512vpopcntdq -mavx512vp2intersect -mavx512bf16

Implementing the early suggestion of @risk of removing the dependency on math.h and moving to bit wise operators did not yield much/any changes in relative difference between compilers:

 ./very_quick_benchmark.sh 
	Welcome to the quick and dirty compiler profiler!

This is the fast version of the script which assumes you're only interested in the newest compilers (and/or add an additional option for testing a regression)
	Currently the default is the MAXIMUM optimizations of: 	GCC 12 	Clang 13+14 Intel ICC
	This MAY take a LONG time, but probably won't.
cleaning up

gcc 12
time taken is 395.022823 

clang 13
time taken is 257.672439 

clang 14
time taken is 301.031864 

intel numbers icc 
time taken is 230.153674 

Above tests were completed with Tree size of 26
This version of the script assumes you know what you're doing. If not, run /quick_benchmark or /benchmark instead for more exhaustive testing
-O3 -march=native -mavx512f -mavx512dq -mavx512ifma -mavx512cd -mavx512bw -mavx512vl -mavx512vbmi -mavx512vbmi2 -mavx512vnni -mavx512bitalg -mavx512vpopcntdq -mavx512vp2intersect -mavx512bf16 -static

It’s kind of what I’d expected, but then I noticed you later focusing on it, and thought you’d noticed something weird with pow.


Have you tried using perf or pprof (if you haven’t used it before see this example: Tutorial - Perf Wiki)

I suspect the timing on the run overall would be slightly slower, … but there’s enough runtime difference between gcc and icc/clang that slowing both down shouldn’t be a big deal.

That way, you can compare profiles to see which particular pieces of c code are more expensive, and whether there’s a particular part or code path that stands out as particularly “hot”… or much worse on gcc.

From there, and with a little knowledge of computer architecture and design … and maybe some code rewriting, you can maybe intuit what gcc might be doing wrong, and why is it not “feeding the beast” correctly in this case.

Planning on using Vtune from the oneAPI suite, debian sid+popOS seems to be having an issue with prof atm.

Well, looks like the Vtune Issues that @wendell and I both ran into last month are still rearing their ugly head in this release.

Falling back on good old gprof (results below), its seems as if the issue has to do with how GCC is dealing with malloc, specifically it seems to be having trouble with:
_int_malloc going up between 3-6* depending on which compiler you compare against
DeleteTree is roughtly doubled.

the concerning option however is ItemCheck:

GCC-12: 29.6s
ICC 0.87s
Clang-11 2.6
Clang-14 17.5

As before, all the same flags were used when possible, with Clang 11 getting march=native instead of sapphire rapids due to lack of support

GCC-12:

Each sample counts as 0.01 seconds.
  %   cumulative   self              self     total           
 time   seconds   seconds    calls  Ts/call  Ts/call  name    
 36.61    121.87   121.87                             _int_malloc
 15.86    174.67    52.80                             _int_free
 14.28    222.21    47.54                             DeleteTree
  9.06    252.36    30.15                             malloc
  8.88    281.93    29.57                             ItemCheck
  4.97    298.48    16.55                             free
  3.21    309.17    10.69                             BottomUpTree
  1.86    315.35     6.18                             malloc_consolidate
  1.52    320.42     5.07                             __malloc_check_init
  1.26    324.61     4.19                             memalign_hook_ini
  1.10    328.28     3.67                             __profile_frequency
  1.05    331.78     3.50                             brk
  0.20    332.45     0.67                             arena_get_retry
  0.07    332.68     0.23                             NewTreeNode
  0.04    332.80     0.12                             unlink_chunk.constprop.0
  0.03    332.90     0.10                             new_heap
  0.01    332.93     0.03                             sysmalloc
  0.01    332.95     0.02                             systrim.constprop.0
  0.00    332.95     0.00        1     0.00     0.00  main

ICC

Each sample counts as 0.01 seconds.
  %   cumulative   self              self     total           
 time   seconds   seconds    calls   s/call   s/call  name    
 24.48     41.94    41.94                             _int_free
 15.68     68.81    26.87                             _int_malloc
 15.37     95.15    26.34                             malloc
 14.67    120.29    25.14 671088593     0.00     0.00  DeleteTree
  9.02    135.75    15.46                             free
  6.62    147.08    11.34 89478482     0.00     0.00  BottomUpTree
  3.20    152.56     5.48                             malloc_consolidate
  3.01    157.71     5.15                             __malloc_check_init
  2.47    161.94     4.23                             memalign_hook_ini
  2.01    165.38     3.44                             __profile_frequency
  1.88    168.60     3.22                             brk
  0.55    169.55     0.95        1     0.95    37.42  main
  0.50    170.41     0.87                             ItemCheck
  0.41    171.12     0.71                             arena_get_retry
  0.06    171.22     0.10                             new_heap
  0.04    171.28     0.06                             systrim.constprop.0
  0.02    171.31     0.03                             sysmalloc
  0.01    171.32     0.01                             tcgetattr
  0.01    171.33     0.01                             unlink_chunk.constprop.0

Clang-11

Each sample counts as 0.01 seconds.
  %   cumulative   self              self     total           
 time   seconds   seconds    calls   s/call   s/call  name    
 23.69     40.62    40.62                             _int_free
 14.32     65.17    24.55 89478481     0.00     0.00  DeleteTree
 12.97     87.40    22.23                             malloc
 12.05    108.06    20.66                             _int_malloc
  8.82    123.19    15.13                             free
  7.10    135.37    12.18 89478482     0.00     0.00  BottomUpTree
  5.93    145.54    10.17                             __profile_frequency
  5.65    155.23     9.69                             brk
  3.03    160.43     5.20                             malloc_consolidate
  2.83    165.29     4.86                             __malloc_check_init
  1.57    167.99     2.70                             memalign_hook_ini
  1.52    170.59     2.61                             ItemCheck
  0.38    171.24     0.65                             arena_get_retry
  0.04    171.31     0.07                             new_heap
  0.04    171.38     0.07                             unlink_chunk.constprop.0
  0.03    171.43     0.05                             sysmalloc
  0.01    171.45     0.02                             systrim.constprop.0
  0.01    171.46     0.01        1     0.01    36.74  main
  0.01    171.47     0.01                             tcgetattr

Clang-14

Each sample counts as 0.01 seconds.
  %   cumulative   self              self     total           
 time   seconds   seconds    calls   s/call   s/call  name    
 20.46     46.58    46.58                             _int_malloc
 18.54     88.78    42.20                             _int_free
 10.20    112.00    23.22 89478481     0.00     0.00  DeleteTree
  7.91    130.00    18.00                             calloc
  7.67    147.46    17.46 89478480     0.00     0.00  ItemCheck
  6.21    161.60    14.14                             free
  5.56    174.26    12.66                             brk
  5.50    186.77    12.51                             __profile_frequency
  5.08    198.32    11.56 89478482     0.00     0.00  BottomUpTree
  4.77    209.17    10.85                             malloc
  3.04    216.10     6.93                             malloc_consolidate
  1.19    218.83     2.72                             pvalloc
  1.12    221.37     2.54                             arena_get_retry
  1.11    223.90     2.53                             __malloc_check_init
  1.00    226.17     2.27                             memalign_hook_ini
  0.50    227.30     1.13                             NewTreeNode
  0.07    227.46     0.16                             unlink_chunk.constprop.0
  0.03    227.53     0.07                             new_heap
  0.02    227.57     0.04                             sysmalloc
  0.01    227.60     0.03                             tcgetattr
  0.01    227.63     0.03        1     0.03    52.26  main
  0.01    227.65     0.02                             systrim.constprop.0

Yuck. I bet you that high “self time” you see in DeleteTree is caused by malloc free implementation poisoning CPU caches.

Try forcing the same malloc across all three compilers:

e.g. tcmalloc/docs at master · google/tcmalloc · GitHub

You may need to link your tiny toy c program with libc++ or with libstdc++ depending on the compiler there’s tons of mentions on stackoverflow and people running onto problems building it and solving those problems - it should be doable

disclaimer

I’m guaranteed to be biased here as I actually work for Google and as an SRE in ads serving I wrestle with performance predictability, capacity planning and traffic safety, for our c++ binaries as one part of my day job.

IMHO, tcmalloc is a good choice for this particular experimentation probably due to:

  1. various c++ and performance teams at Google are still optimizing both for clang and gcc, both are still in use internally (despite shifting to mostly using clang because ThinLTO is magic and at least on our team we have it enabled by default across all our binaries)
  2. those folks who work on compilers and low level libraries would have had access to unreleased chips from both Intel and AMD to play with and do basic sanity checking and optimizations - I don’t follow new stuff too closely, but if I had to guess, various iterations / steppings of ice lake have been around for at least a year in those circles - you can look at email addresses of people sending patches to clang compiler mailing lists.
  3. Huge page support - check page fault counters, if you are seeing lots of them you can try the huge page allocator in tcmalloc through environment variables. Linux could maybe merge the pages for you thanks to khugepaged but that’s optimistic and doesn’t always work.

I’m sure there’s many other fine mallocs out there that work well for other workloads, e.g. jemalloc from Facebook/Meta is often used as well - it used to result in e.g. things like Firefox using less ram way back when … no idea how they stack up these days… it might be easier to use with plain c code, I don’t know.

Most app developers - when they see lots of time spent in malloc, they usually are able to spot parts of c++ code where they’re doing some unnecessary c++ copying or allocation and are able to fix it up and call it a win… They generally wouldn’t swap compilers or dive into libc until after optimizing the algorithms or refactoring data structures and code

1 Like

Interesting Idea, will have to dig into it.

Just to make sure I understand correctly, you think it might be a problem in how stdlib.h and gcc are interacting and therefore thrashing cache?

Already had the OneAPI suite installed, so used mkl instead of stdlib.h as a first pass.

This yielded:
Minor improvements for GCC (~3.4%)
No tangible difference for Clang 13 ~(0.0017%, AKA margin of error)
Very minor improvements for Clang 14 (~2.4%)
Minor improvement for ICC (~3.1%)

The direct times with the profiler disabled were:

gcc 12
time taken is 382.000681 

clang 13
time taken is 257.226206 

clang 14
time taken is 293.053538 

intel icc
time taken is 223.219175 

Gprof and clang don’t play very well together in terms of program exit while writing out. This program, as simple as it is, has the print done as the last item, meaning it needs to wait for gprof to finish writing out first.

The Profiler results are below. While running with MKL and profiler on the “time taken” are below, but should be ignored, instead look after for the gprof results:

gcc 12
time taken is 445.771744 

clang 13
time taken is 589.468278 

clang 14
time taken is 634.292629 

intel icc
time taken is 302.278149 

GCC-12+ OneAPI 2021.4 MKL:

Each sample counts as 0.01 seconds.
  %   cumulative   self              self     total           
 time   seconds   seconds    calls  Ts/call  Ts/call  name  
 35.90    113.12   113.12                             _int_malloc
 15.64    162.39    49.27                             _int_free
 12.66    202.28    39.89                             DeleteTree
  9.30    231.58    29.30                             ItemCheck
  8.97    259.84    28.26                             malloc
  6.66    280.84    21.00                             free
  3.34    291.37    10.53                             BottomUpTree
  1.99    297.63     6.26                             malloc_consolidate
  1.54    302.48     4.85                             __malloc_check_init
  1.28    306.52     4.04                             memalign_hook_ini
  1.21    310.32     3.80                             __profile_frequency
  1.16    313.97     3.65                             brk
  0.19    314.58     0.61                             arena_get_retry
  0.07    314.80     0.22                             NewTreeNode
  0.05    314.96     0.16                             unlink_chunk.constprop.0
  0.02    315.03     0.07                             systrim.constprop.0
  0.02    315.09     0.06                             new_heap
  0.01    315.11     0.02                             tcgetattr
  0.00    315.12     0.01                             alloc_perturb
  0.00    315.12     0.00        1     0.00     0.00  main

ICC + MKL

Each sample counts as 0.01 seconds.
  %   cumulative   self              self     total           
 time   seconds   seconds    calls   s/call   s/call  name    
 24.41     42.90    42.90                             _int_free
 15.33     69.84    26.94                             _int_malloc
 14.92     96.05    26.21                             malloc
 13.90    120.48    24.43 671088593     0.00     0.00  DeleteTree
  9.88    137.84    17.36                             free
  6.66    149.55    11.71 89478482     0.00     0.00  BottomUpTree
  3.15    155.09     5.54                             __malloc_check_init
  3.12    160.57     5.48                             malloc_consolidate
  2.53    165.02     4.45                             memalign_hook_ini
  2.25    168.98     3.96                             brk
  2.19    172.82     3.84                             __profile_frequency
  0.59    173.86     1.05                             ItemCheck
  0.56    174.84     0.98        1     0.98    37.12  main
  0.40    175.54     0.70                             arena_get_retry
  0.05    175.63     0.09                             unlink_chunk.constprop.0
  0.05    175.71     0.08                             new_heap
  0.01    175.72     0.01                             systrim.constprop.0

Clang-13 +MKL

Each sample counts as 0.01 seconds.
  %   cumulative   self              self     total           
 time   seconds   seconds    calls   s/call   s/call  name    
 21.44     42.57    42.57                             _int_free
 12.52     67.43    24.86 89478481     0.00     0.00  DeleteTree
 11.71     90.69    23.26                             malloc
 10.73    111.99    21.30                             _int_malloc
  9.20    130.26    18.27 89478480     0.00     0.00  ItemCheck
  7.55    145.26    15.00                             free
  6.71    158.59    13.33                             brk
  6.19    170.89    12.30                             __profile_frequency
  5.85    182.51    11.62 89478482     0.00     0.00  BottomUpTree
  3.30    189.06     6.55                             malloc_consolidate
  2.56    194.14     5.08                             __malloc_check_init
  1.24    196.60     2.46                             memalign_hook_ini
  0.59    197.77     1.18                             NewTreeNode
  0.31    198.39     0.62                             arena_get_retry
  0.05    198.48     0.09                             new_heap
  0.05    198.57     0.09                             unlink_chunk.constprop.0
  0.01    198.59     0.02                             systrim.constprop.0
  0.01    198.61     0.02                             tcgetattr
  0.00    198.61     0.00        1     0.00    54.75  main

Clang14 +MKL

Each sample counts as 0.01 seconds.
  %   cumulative   self              self     total           
 time   seconds   seconds    calls   s/call   s/call  name    
 20.44     47.61    47.61                             _int_malloc
 17.75     88.95    41.34                             _int_free
  9.99    112.21    23.26 89478481     0.00     0.00  DeleteTree
  7.88    130.57    18.36 89478480     0.00     0.00  ItemCheck
  7.87    148.91    18.34                             calloc
  6.81    164.77    15.86                             free
  5.72    178.10    13.33                             __profile_frequency
  5.66    191.28    13.18                             brk
  4.84    202.56    11.28 89478482     0.00     0.00  BottomUpTree
  4.52    213.09    10.53                             malloc
  3.19    220.51     7.42                             malloc_consolidate
  1.28    223.49     2.98                             __malloc_check_init
  1.17    226.21     2.72                             memalign_hook_ini
  1.14    228.87     2.66                             pvalloc
  1.05    231.32     2.45                             arena_get_retry
  0.59    232.69     1.37                             NewTreeNode
  0.05    232.80     0.11                             unlink_chunk.constprop.0
  0.03    232.88     0.08                             new_heap
  0.02    232.92     0.04                             systrim.constprop.0
  0.01    232.94     0.02        1     0.02    52.92  main

Wowsers, you weren’t kidding with TCMalloc:

gcc 12
time taken is 188.211710 

clang 13
time taken is 220.405855 

clang 14
time taken is 216.331089 

intel icc
time taken is 195.462911 

Above tests were completed with Tree size of 26
This version of the script assumes you know what you're doing. If not, run /quick_benchmark or /benchmark instead for more exhaustive testing
-O3 -march=sapphirerapids -mno-amx-tile -mno-amx-int8 -mno-amx-bf16 -std=c17 -fno-builtin-malloc -fno-builtin-calloc -fno-builtin-realloc -fno-builtin-free -ltcmalloc_minimal 

Version used is 2.9.1 from the ubuntu repositories

GCC-12 TCMALLOC

Each sample counts as 0.01 seconds.
  %   cumulative   self              self     total
 time   seconds   seconds    calls  Ts/call  Ts/call  name
 30.91      8.42     8.42                             _int_malloc
 18.32     13.41     4.99                             _int_free
 11.38     16.51     3.10                             malloc
  9.16     19.01     2.50                             DeleteTree
  7.78     21.13     2.12                             ItemCheck
  7.38     23.14     2.01                             free
  4.92     24.48     1.34                             BottomUpTree
  2.53     25.17     0.69                             malloc_consolidate
  2.39     25.82     0.65                             __malloc_check_init
  1.80     26.31     0.49                             __profile_frequency
  1.65     26.76     0.45                             brk
  1.36     27.13     0.37                             memalign_hook_ini
  0.33     27.22     0.09                             arena_get_retry
  0.04     27.23     0.01                             new_heap
  0.04     27.24     0.01                             unlink_chunk.constprop.0
  0.02     27.24     0.01                             NewTreeNode
  0.00     27.24     0.00        1     0.00     0.00  main

ICC + TCMALLOC

Each sample counts as 0.01 seconds.
  %   cumulative   self              self     total
 time   seconds   seconds    calls   s/call   s/call  name
 24.41     42.90    42.90                             _int_free
 15.33     69.84    26.94                             _int_malloc
 14.92     96.05    26.21                             malloc
 13.90    120.48    24.43 671088593     0.00     0.00  DeleteTree
  9.88    137.84    17.36                             free
  6.66    149.55    11.71 89478482     0.00     0.00  BottomUpTree
  3.15    155.09     5.54                             __malloc_check_init
  3.12    160.57     5.48                             malloc_consolidate
  2.53    165.02     4.45                             memalign_hook_ini
  2.25    168.98     3.96                             brk
  2.19    172.82     3.84                             __profile_frequency
  0.59    173.86     1.05                             ItemCheck
  0.56    174.84     0.98        1     0.98    37.12  main
  0.40    175.54     0.70                             arena_get_retry
  0.05    175.63     0.09                             unlink_chunk.constprop.0
  0.05    175.71     0.08                             new_heap
  0.01    175.72     0.01                             systrim.constprop.0

CLANG13 + TC MALLOC

Each sample counts as 0.01 seconds.
  %   cumulative   self              self     total
 time   seconds   seconds    calls   s/call   s/call  name
 22.94      4.64     4.64                             _int_free
 13.05      7.28     2.64                             malloc
 11.57      9.62     2.34                             _int_malloc
  9.00     11.44     1.82 11184801     0.00     0.00  DeleteTree
  7.76     13.01     1.57                             free
  7.17     14.46     1.45 11184800     0.00     0.00  ItemCheck
  6.48     15.77     1.31                             __profile_frequency
  6.45     17.08     1.31 11184802     0.00     0.00  BottomUpTree
  6.18     18.33     1.25                             brk
  3.91     19.12     0.79                             malloc_consolidate
  2.67     19.66     0.54                             __malloc_check_init
  1.48     19.96     0.30                             memalign_hook_ini
  0.67     20.09     0.14                             NewTreeNode
  0.49     20.19     0.10                             arena_get_retry
  0.10     20.21     0.02                             new_heap
  0.10     20.23     0.02                             unlink_chunk.constprop.0
  0.00     20.23     0.00        1     0.00     4.58  main

CLANG14 + TCMALLOC

Each sample counts as 0.01 seconds.
  %   cumulative   self              self     total
 time   seconds   seconds    calls   s/call   s/call  name
 18.78      4.39     4.39                             _int_malloc
 18.69      8.76     4.37                             _int_free
  8.38     10.72     1.96                             calloc
  8.28     12.66     1.94 11184801     0.00     0.00  DeleteTree
  6.89     14.27     1.61                             free
  6.67     15.83     1.56 11184800     0.00     0.00  ItemCheck
  6.46     17.34     1.51                             brk
  6.37     18.83     1.49                             __profile_frequency
  5.56     20.13     1.30                             malloc
  4.71     21.23     1.10 11184802     0.00     0.00  BottomUpTree
  3.38     22.02     0.79                             malloc_consolidate
  1.63     22.40     0.38                             memalign_hook_ini
  1.33     22.71     0.31                             pvalloc
  1.24     23.00     0.29                             arena_get_retry
  1.11     23.26     0.26                             __malloc_check_init
  0.45     23.36     0.11                             NewTreeNode
  0.04     23.37     0.01                             new_heap
  0.04     23.38     0.01                             unlink_chunk.constprop.0
  0.00     23.38     0.00        1     0.00     4.60  main

yep: … this is what I get on my poor ancient NAS box, it’s almost twice as fast:

LD_PRELOAD commands and output
root@314cc6e36a87:/mnt# ./binarytrees_gcc 18
time taken is 6.261416
root@314cc6e36a87:/mnt# ./binarytrees_clang 18
time taken is 5.932290
root@314cc6e36a87:/mnt# LD_PRELOAD=/usr/lib/x86_64-linux-gnu/libtcmalloc_minimal.so.4 ./binarytrees_gcc 18
time taken is 3.414278
root@314cc6e36a87:/mnt# LD_PRELOAD=/usr/lib/x86_64-linux-gnu/libtcmalloc_minimal.so.4 ./binarytrees_clang 18
time taken is 3.804599
root@314cc6e36a87:/mnt#

now, … I guess you can compare profiles … I don’t think the code does much else than just allocate / deallocate stuff.

(also you may want to run clang-format -i binarytrees.c … and get it looking nicer - indepedently of any other change to sources you might be making.

1 Like

I haven’t pushed to git in a while, should probably do so :sweat_smile:

Also seems that TC doesn’t like being linked as static; could probably squeeze a few more points out of it that way.

Still surprises me how the GNU Glibc malloc implementation could play so poorly with the GNU compiler.

Next push will be JEMalloc.

Beyond that, will now see what I can squeeze out of clang and ICC.

Clang 11 with TC malloc was able to get down to

./tmp-clang-11 26 time taken is 196.880752 

ICC was able to get:

./tmp-icc 26 time taken is 190.658456 

Clang-14 (in line with 12 and 13) on the other hand continues to trail behind Clang-11.

Augmenting GCC-12 to also use -fallow-store-data-races -fgcse-las -fgcse-after-reload -fdevirtualize-at-ltrans -fdevirtualize-speculatively -fsched-spec-load-dangerous -fsched-spec-load -fsemantic-interposition -fgraphite-identity -floop-nest-optimize -ftree-loop-im -ftree-loop-ivcanon -fivopts -ftree-vectorize -flto -fwhole-program -fuse-linker-plugin -funroll-loops

cut times another ~5 seconds to

time taken is 183.425887