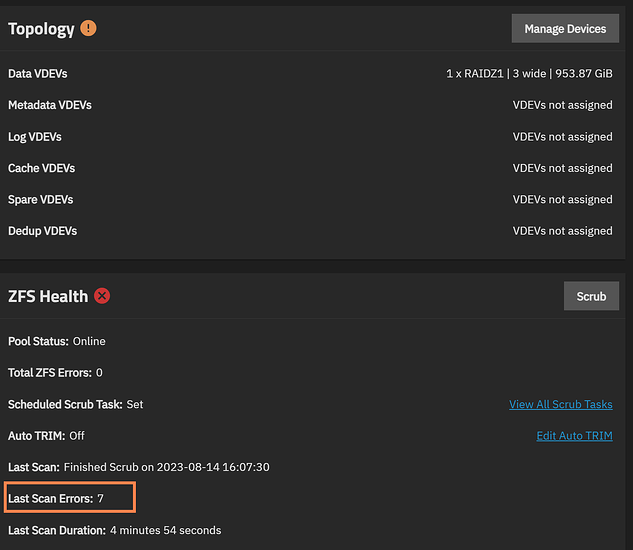
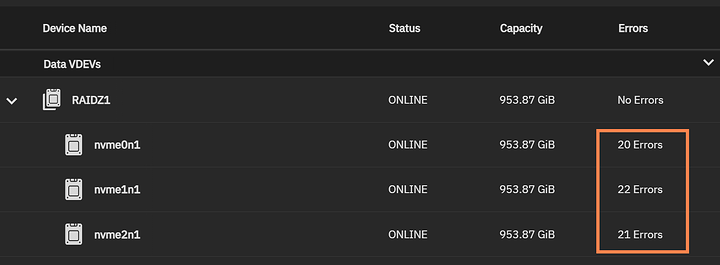
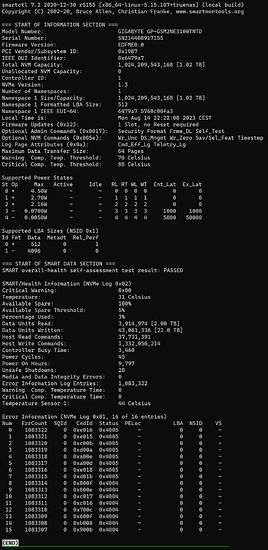
Thanks for sending the info. Looks like this isn’t really a new problem. Been happening as far back as I an see in the logs.
Jul  8 04:19:17 arjuna smartd[5423]: Device: /dev/nvme0n1, number of Error Log entries increased from 989724 to 989776
Jul  8 04:19:17 arjuna smartd[5423]: Device: /dev/nvme1n1, number of Error Log entries increased from 989724 to 989776
Jul  8 04:19:17 arjuna smartd[5423]: Device: /dev/nvme2n1, number of Error Log entries increased from 989724 to 989776
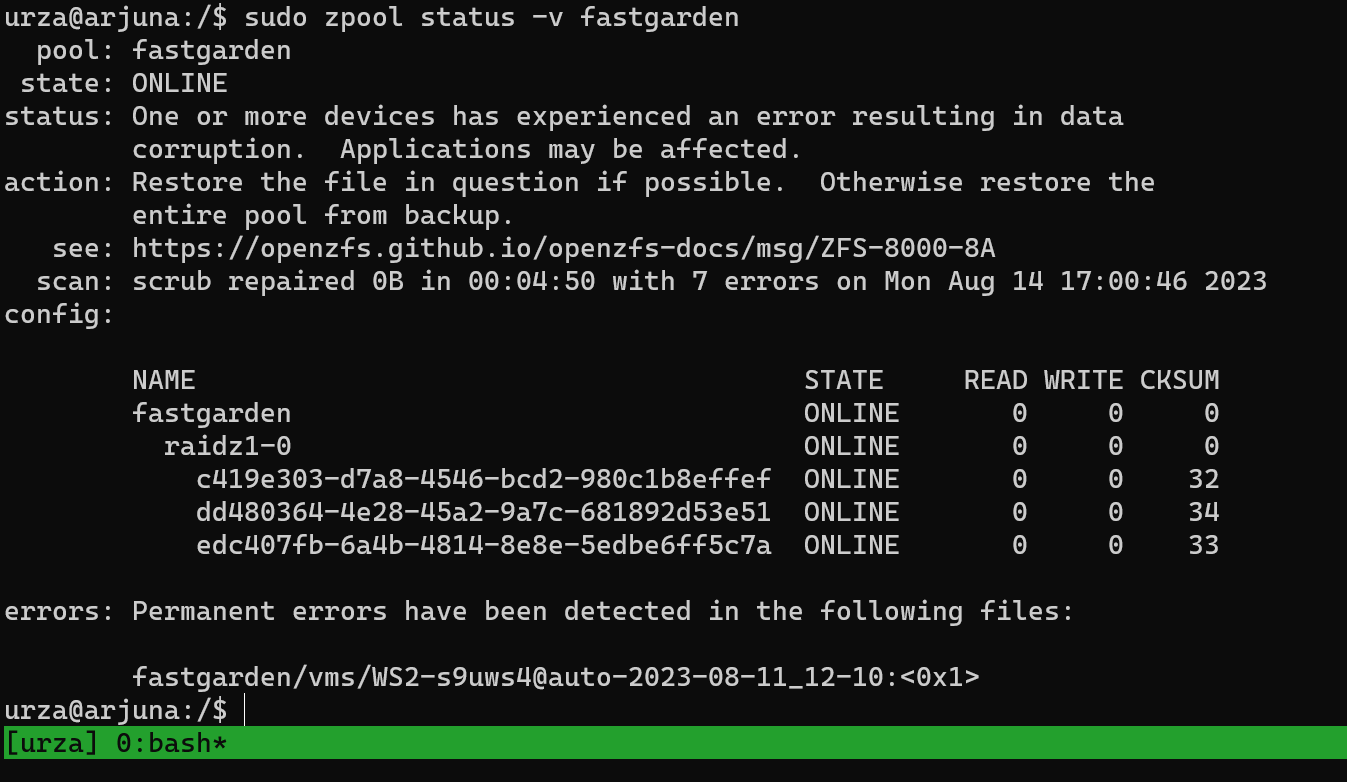
it looks like this particular file was corrupted:
errors: Permanent errors have been detected in the following files:

        fastgarden/vms/WS2-s9uws4@auto-2023-08-11_12-10:<0x1>
and you had recently scrubbed yesterday:
  pool: fastgarden
 state: ONLINE
status: One or more devices has experienced an error resulting in data
	corruption.  Applications may be affected.
action: Restore the file in question if possible.  Otherwise restore the
	entire pool from backup.
   see: https://openzfs.github.io/openzfs-docs/msg/ZFS-8000-8A
  scan: scrub repaired 0B in 00:04:50 with 7 errors on Mon Aug 14 17:00:46 2023
and we are still seeing errors:
	    c419e303-d7a8-4546-bcd2-980c1b8effef  ONLINE       0     0    32
	    dd480364-4e28-45a2-9a7c-681892d53e51  ONLINE       0     0    34
	    edc407fb-6a4b-4814-8e8e-5edbe6ff5c7a  ONLINE       0     0    33
Looks like you do have periodic scrubs setup and you kicked this one off manually
2023-03-12.00:00:09  zpool scrub fastgarden
2023-04-16.00:00:10  zpool scrub fastgarden
2023-05-21.00:00:09  zpool scrub fastgarden
2023-06-25.00:00:09  zpool scrub fastgarden
2023-08-14.16:02:37 py-libzfs: zpool scrub fastgarden
Drives are GIGABYTE GP-GSM2NE3100TNTD…
0000:04:00.0 Non-Volatile memory controller: Phison Electronics Corporation PS5013 E13 NVMe Controller (rev 01) (prog-if 02 [NVM Express])
	Subsystem: Phison Electronics Corporation PS5013 E13 NVMe Controller
	Control: I/O- Mem+ BusMaster+ SpecCycle- MemWINV- VGASnoop- ParErr- Stepping- SERR- FastB2B- DisINTx+
	Status: Cap+ 66MHz- UDF- FastB2B- ParErr- DEVSEL=fast >TAbort- <TAbort- <MAbort- >SERR- <PERR- INTx-
	Latency: 0, Cache Line Size: 64 bytes
	Interrupt: pin A routed to IRQ 38
	NUMA node: 0
	IOMMU group: 22
	Region 0: Memory at fc800000 (64-bit, non-prefetchable) [size=16K]
	Capabilities: [80] Express (v2) Endpoint, MSI 00
		DevCap:	MaxPayload 256 bytes, PhantFunc 0, Latency L0s unlimited, L1 unlimited
			ExtTag+ AttnBtn- AttnInd- PwrInd- RBE+ FLReset+ SlotPowerLimit 0.000W
		DevCtl:	CorrErr+ NonFatalErr+ FatalErr+ UnsupReq+
			RlxdOrd+ ExtTag+ PhantFunc- AuxPwr- NoSnoop+ FLReset-
			MaxPayload 256 bytes, MaxReadReq 512 bytes
		DevSta:	CorrErr- NonFatalErr- FatalErr- UnsupReq- AuxPwr- TransPend-
		LnkCap:	Port #1, Speed 8GT/s, Width x4, ASPM L1, Exit Latency L1 unlimited
			ClockPM- Surprise- LLActRep- BwNot- ASPMOptComp+
		LnkCtl:	ASPM Disabled; RCB 64 bytes, Disabled- CommClk+
			ExtSynch- ClockPM- AutWidDis- BWInt- AutBWInt-
		LnkSta:	Speed 8GT/s (ok), Width x4 (ok)
			TrErr- Train- SlotClk+ DLActive- BWMgmt- ABWMgmt-
		DevCap2: Completion Timeout: Range ABCD, TimeoutDis+ NROPrPrP- LTR+
			 10BitTagComp- 10BitTagReq- OBFF Not Supported, ExtFmt+ EETLPPrefix-
			 EmergencyPowerReduction Not Supported, EmergencyPowerReductionInit-
			 FRS- TPHComp- ExtTPHComp-
			 AtomicOpsCap: 32bit- 64bit- 128bitCAS-
		DevCtl2: Completion Timeout: 50us to 50ms, TimeoutDis- LTR+ OBFF Disabled,
			 AtomicOpsCtl: ReqEn-
		LnkCap2: Supported Link Speeds: 2.5-8GT/s, Crosslink- Retimer- 2Retimers- DRS-
		LnkCtl2: Target Link Speed: 8GT/s, EnterCompliance- SpeedDis-
			 Transmit Margin: Normal Operating Range, EnterModifiedCompliance- ComplianceSOS-
			 Compliance De-emphasis: -6dB
		LnkSta2: Current De-emphasis Level: -3.5dB, EqualizationComplete+ EqualizationPhase1+
			 EqualizationPhase2+ EqualizationPhase3+ LinkEqualizationRequest-
			 Retimer- 2Retimers- CrosslinkRes: unsupported
	Capabilities: [d0] MSI-X: Enable+ Count=9 Masked-
		Vector table: BAR=0 offset=00002000
		PBA: BAR=0 offset=00003000
	Capabilities: [e0] MSI: Enable- Count=1/8 Maskable+ 64bit+
		Address: 0000000000000000  Data: 0000
		Masking: 00000000  Pending: 00000000
	Capabilities: [f8] Power Management version 3
		Flags: PMEClk- DSI- D1- D2- AuxCurrent=0mA PME(D0-,D1-,D2-,D3hot-,D3cold-)
		Status: D0 NoSoftRst+ PME-Enable- DSel=0 DScale=0 PME-
	Capabilities: [100 v1] Latency Tolerance Reporting
		Max snoop latency: 1048576ns
		Max no snoop latency: 1048576ns
	Capabilities: [110 v1] L1 PM Substates
		L1SubCap: PCI-PM_L1.2+ PCI-PM_L1.1+ ASPM_L1.2+ ASPM_L1.1+ L1_PM_Substates+
			  PortCommonModeRestoreTime=10us PortTPowerOnTime=220us
		L1SubCtl1: PCI-PM_L1.2- PCI-PM_L1.1- ASPM_L1.2- ASPM_L1.1-
			   T_CommonMode=0us LTR1.2_Threshold=32768ns
		L1SubCtl2: T_PwrOn=220us
	Capabilities: [200 v2] Advanced Error Reporting
		UESta:	DLP- SDES- TLP- FCP- CmpltTO- CmpltAbrt- UnxCmplt- RxOF- MalfTLP- ECRC- UnsupReq- ACSViol-
		UEMsk:	DLP- SDES- TLP- FCP- CmpltTO- CmpltAbrt- UnxCmplt- RxOF- MalfTLP- ECRC- UnsupReq- ACSViol-
		UESvrt:	DLP+ SDES- TLP- FCP+ CmpltTO- CmpltAbrt- UnxCmplt- RxOF- MalfTLP+ ECRC- UnsupReq- ACSViol-
		CESta:	RxErr- BadTLP- BadDLLP- Rollover- Timeout- AdvNonFatalErr-
		CEMsk:	RxErr- BadTLP- BadDLLP- Rollover- Timeout- AdvNonFatalErr+
		AERCap:	First Error Pointer: 00, ECRCGenCap- ECRCGenEn- ECRCChkCap+ ECRCChkEn-
			MultHdrRecCap- MultHdrRecEn- TLPPfxPres- HdrLogCap-
		HeaderLog: 00000000 00000000 00000000 00000000
	Capabilities: [300 v1] Secondary PCI Express
		LnkCtl3: LnkEquIntrruptEn- PerformEqu-
		LaneErrStat: 0
	Kernel driver in use: nvme
	Kernel modules: nvme
If this were GEN4 I would say maybe try GEN3 but it’s not. All 3 are running at x4
LnkSta: Speed 8GT/s (ok), Width x4 (ok)
You’ve run a single SMART test on them:
SMART Self-test log structure revision number 1
Num  Test_Description    Status                  Remaining  LifeTime(hours)  LBA_of_first_error
# 1  Short offline       Completed without error       00%     10273         -
Doesn’t look like you’ve messed with the default queuing algorithm, and the kernel seems otherwise quiet. but what’s interesting is the message above it. This shows up at boot and I’m not seeing any other messages from nvme.
May 15 23:45:03 truenas kernel: nvme nvme2: missing or invalid SUBNQN field.
May 15 23:45:03 truenas kernel: nvme nvme0: missing or invalid SUBNQN field.
May 15 23:45:03 truenas kernel: nvme nvme1: missing or invalid SUBNQN field.
May 15 23:45:03 truenas kernel: nvme nvme2: allocated 128 MiB host memory buffer.
May 15 23:45:03 truenas kernel: nvme nvme0: allocated 128 MiB host memory buffer.
May 15 23:45:03 truenas kernel: nvme nvme1: allocated 128 MiB host memory buffer.
May 15 23:45:03 truenas kernel: nvme nvme1: 8/0/0 default/read/poll queues
May 15 23:45:03 truenas kernel:  nvme1n1: p1 p2
May 15 23:45:03 truenas kernel: nvme nvme2: 8/0/0 default/read/poll queues
May 15 23:45:03 truenas kernel: nvme nvme0: 8/0/0 default/read/poll queue
@wendell has been down the ZFS rabbit hole Do you have any insights in
kernel: nvme nvme0: missing or invalid SUBNQN field.
A google search resulted in a mixed bag of information. Some say to tune things, some say its normal, some say the NVME drive is out of spec… Not sure.
My advice/action items:
- Firmware update?
- Set up a weekly short SMART test
- Set up a monthly long SMART test
- Keep manually scrubbing. The values went up this time because the accumulated over the past month. They should start going down each time you run a new one now. After the next one or two if they go up and not down still, stop.
