Found a good website without a billion ads
http://www.aerospace.org/cords/reentry-predictions/tiangong-1-reentry/
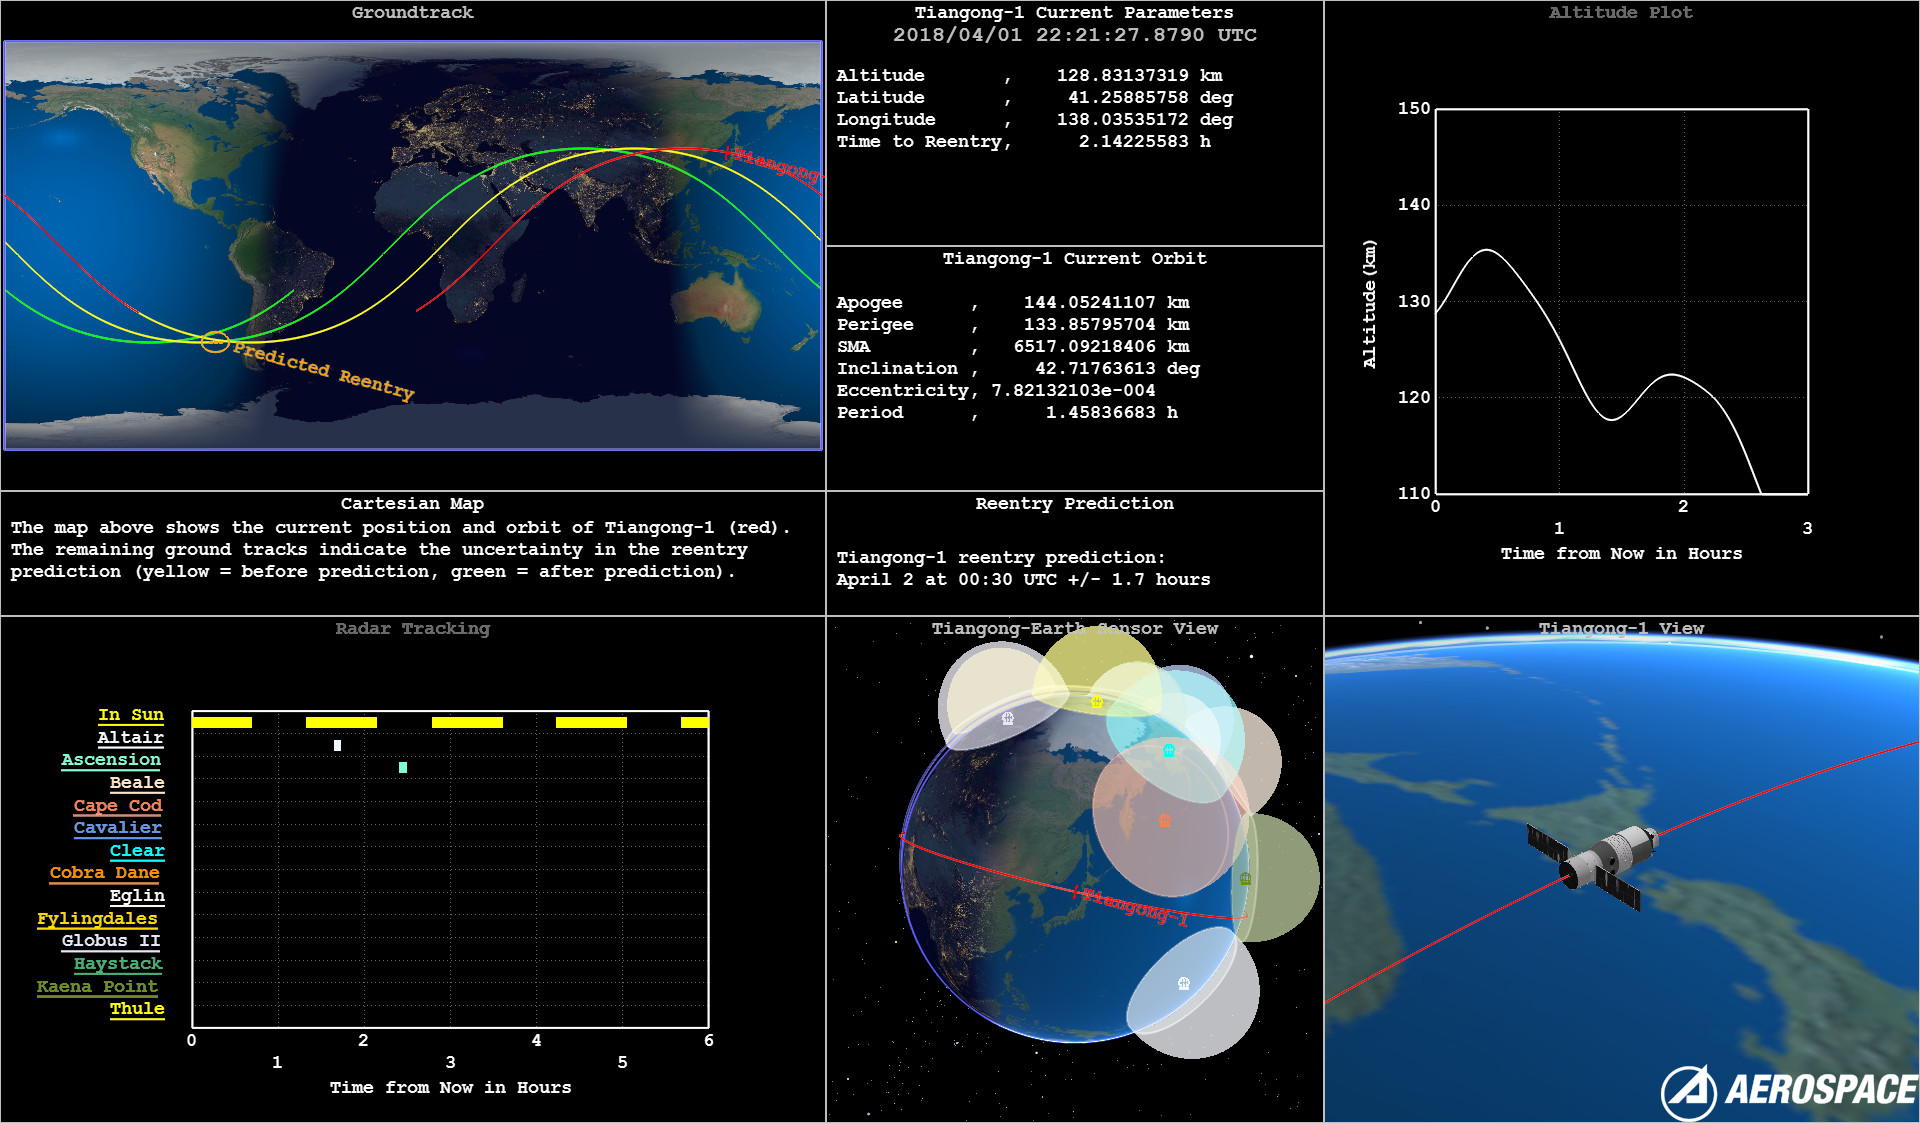
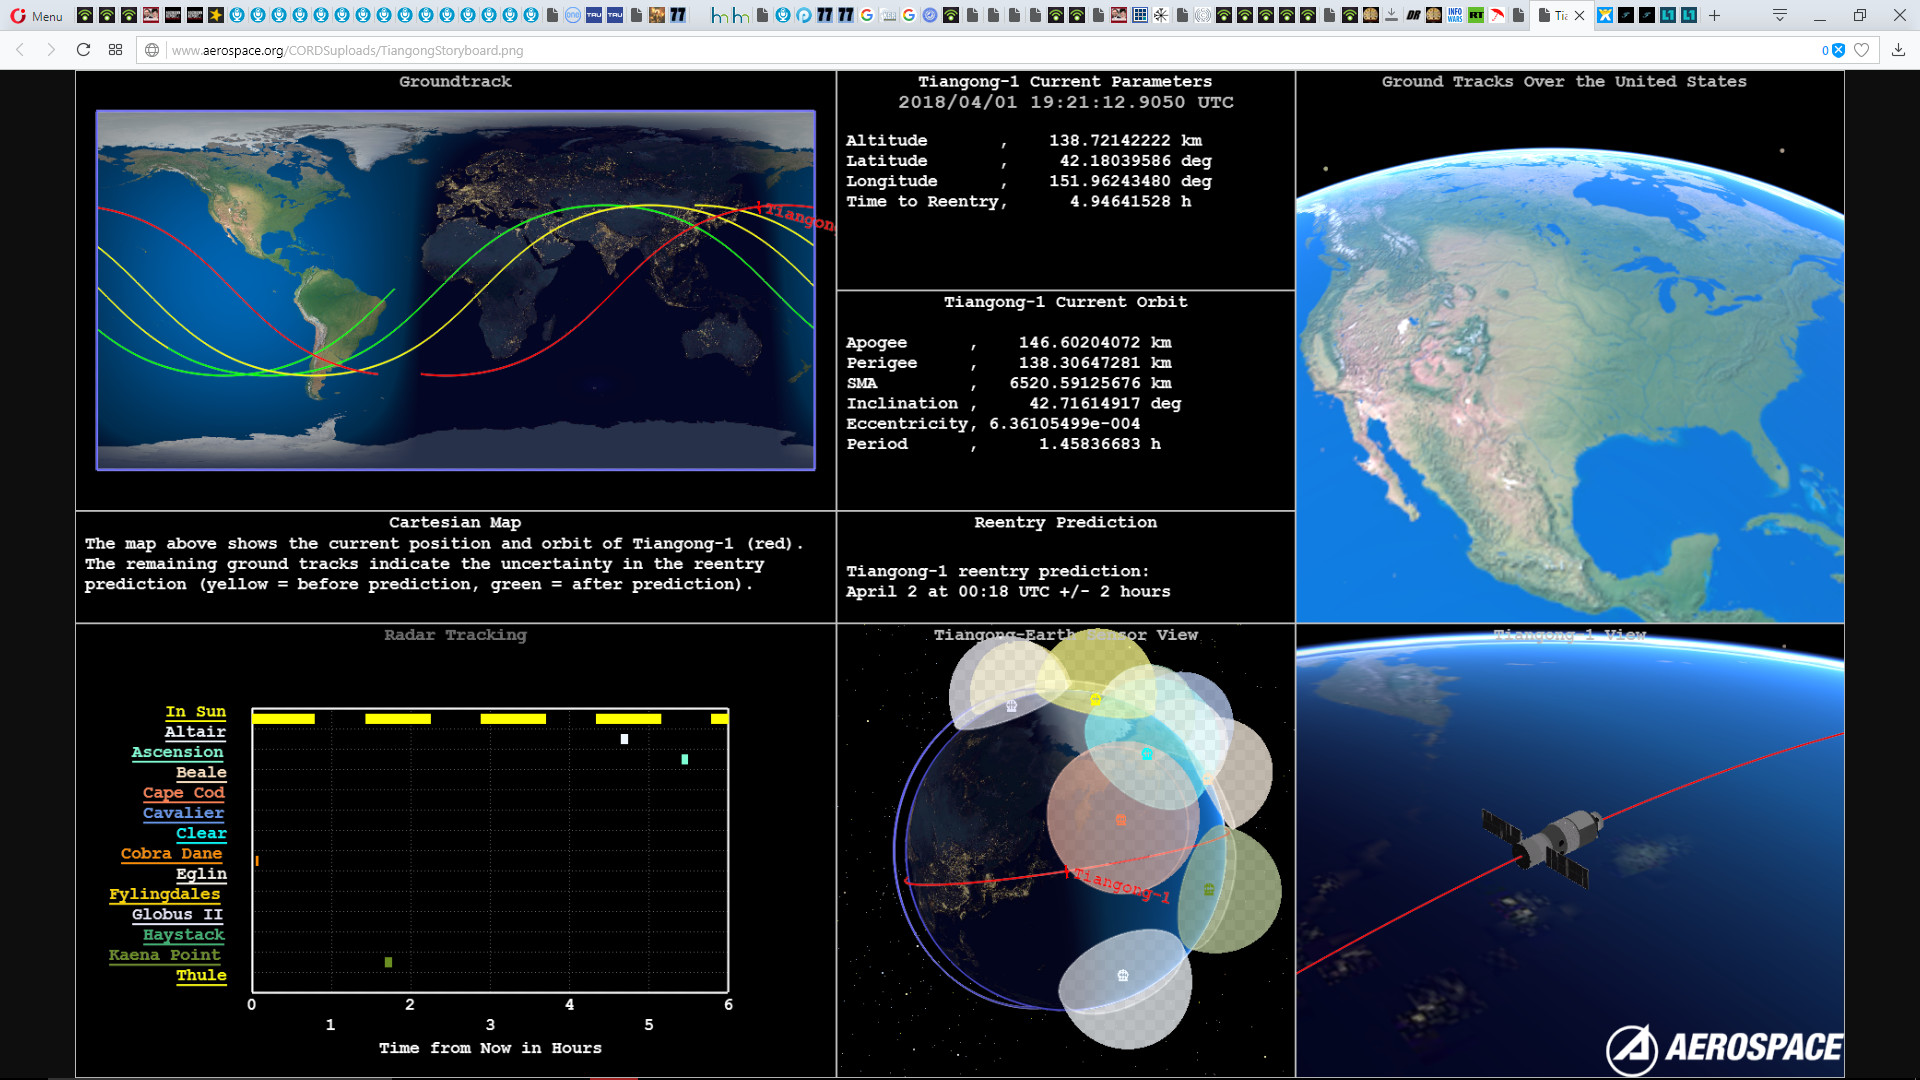
This is what the dashboard looks like on my PC
In 1979 we were better prepared


Even had a Skylab song
Found a good website without a billion ads
http://www.aerospace.org/cords/reentry-predictions/tiangong-1-reentry/
This is what the dashboard looks like on my PC
In 1979 we were better prepared
Approx 3 1/2 hours to go now.
Kinda weird to need to keep refreshing the image… any better way to view the dashboard?
Looks like I am out of the re-entry areas, unless it decides to hang around for another day. No hat required for me!
Do a google search for Tiangong-1, there are plenty of tracking sites that live update, such as:
http://www.satflare.com/track.asp?q=37820#MAP
I have the distinct impression that this image is based on a screenshot of a large dashboard projection/screen that’s on a wall somewhere.
This altitude plot though is interesting. Notice how it is predicted to increase for a time. Skipping off the atmosphere? What’s supposed to be going on there?
Orbits are circles, but the earth is not a perfect sphere. So the distance from the earth’s surface varies over time. Or maybe the orbit is not perfectly circular?
I think that’s what’s going on.
I know for a fact that orbits are not perfectly circular. That’s why perigee and apogee are terms. Right now Tangong-1 is very much at it’s lowest Perigee and I expect that should decrease in smooth progression. A ~5km change is rather large.
Note the Apogee and Perigee this is the high and low point of the orbit.
Orbits are rarely perfectly circular (if it was these values would be the same)
so satellites normally oscillate between these values.
@pFtpr and I have figured out(on discord) that the orbital period matches and accounts as for the perigee vs apogee variation in the altitude plot here.
Usually the plot would be a zig zag up and down, but now it’s starting to circularize like an easter egg orbit as it’s decaying into the atmosphere.
lack of the more usual up-down zig-zag caught us off guard at first