Threadripper intermittent CPU frequency throttling

I’m running into an issue with my Threadripper build where intermittently, all cores will throttle down to ~545 MHz. It will remain throttled for anywhere from ~10 seconds to ~2 minutes.

System specs:

  • Threadripper Pro 7985WX (64 cores)
  • ASUS WRX90E-SAGE SE
  • 256GB (8x32) Kingston 6000MT memory kit, running at 4800MT
  • Corsair AX1600i PSU
  • Crucial T700 4TB
  • Arctic Freezer 4U-M
  • GTX1080 GPU
  • Ubuntu 23.10 (kernel 6.5.0)

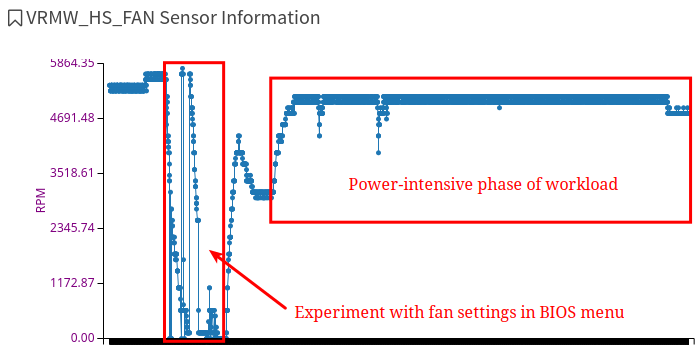
I’ll notice it when I’m running an all-cores workload because the fans slow down audibly. If I’m logged in through ssh, the terminal gets noticeably sluggish and any commands run slowly. I haven’t spent much time yet at the keyboard+monitor, but the one time I was there while it throttled, the entire UI got extremely laggy, including a video I was watching at the time.

I don’t yet know if this happens while the system is mostly idle.

Things I’ve ruled out so far:

  • It’s not the workload waiting on non-CPU resources. It has happened while I had two different 128-thread jobs running at the same time, plus my terminal session.
  • There are no messages in either the system logs or the IPMI.
  • Thermals are fine (at least the sensors I can read; there are a couple that aren’t exposed by the IPMI such as the chipset and VRMs. I hope ASUS fixes that.)

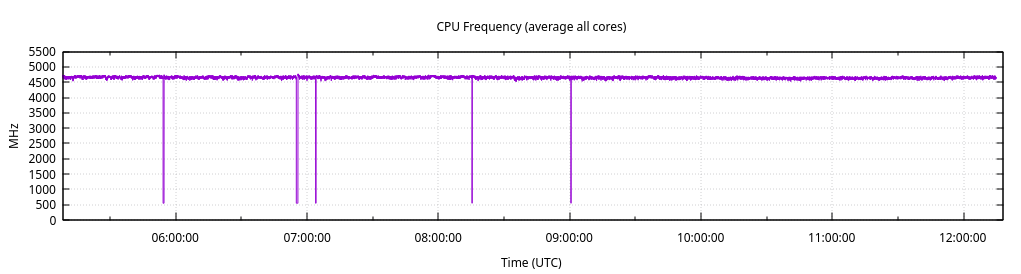
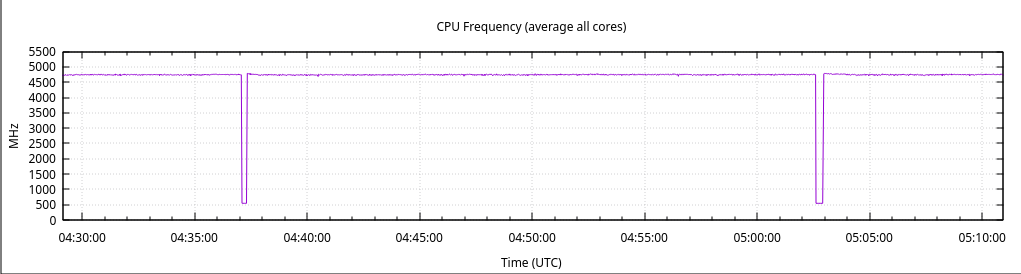
Here are four different occurrences, which I logged by polling /proc/cpuinfo at a sleep 1 interval.


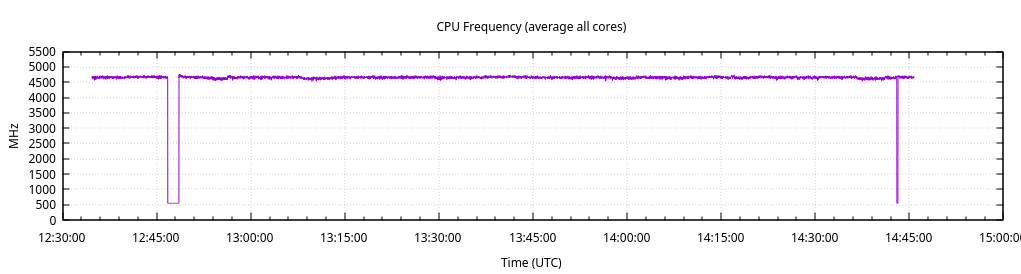
Sensor readings that were triggered immediately after the onset of the 14:43:01 event:

ID | Name             | Type           | Reading    | Units | Event
2  | +VCORE_0         | Voltage        | 0.67       | V     | 'OK'
3  | +VCORE_1         | Voltage        | 0.67       | V     | 'OK'
4  | +VSOC            | Voltage        | 0.93       | V     | 'OK'
5  | +VDDIO           | Voltage        | 1.11       | V     | 'OK'
6  | +VDD_11_S3       | Voltage        | 1.12       | V     | 'OK'
7  | +CHIPSET_1.8V    | Voltage        | 1.86       | V     | 'OK'
8  | +CHIPSET_1.05V   | Voltage        | 1.07       | V     | 'OK'
9  | +12V             | Voltage        | 12.00      | V     | 'OK'
10 | +5V              | Voltage        | 4.97       | V     | 'OK'
11 | +3.3V            | Voltage        | 3.31       | V     | 'OK'
12 | +5VSB            | Voltage        | 4.97       | V     | 'OK'
13 | +3.3VSB          | Voltage        | 3.30       | V     | 'OK'
14 | VBAT             | Voltage        | 3.25       | V     | 'OK'
15 | CPU Package Temp | Temperature    | 66.00      | C     | 'OK'
17 | LAN Temp         | Temperature    | 60.00      | C     | 'OK'
18 | DIMMA1_Temp      | Temperature    | 69.00      | C     | 'OK'
19 | DIMMB1_Temp      | Temperature    | 70.00      | C     | 'OK'
20 | DIMMC1_Temp      | Temperature    | 70.00      | C     | 'OK'
21 | DIMMD1_Temp      | Temperature    | 69.00      | C     | 'OK'
22 | DIMME1_Temp      | Temperature    | 67.00      | C     | 'OK'
23 | DIMMF1_Temp      | Temperature    | 69.00      | C     | 'OK'
24 | DIMMG1_Temp      | Temperature    | 71.00      | C     | 'OK'
25 | DIMMH1_Temp      | Temperature    | 68.00      | C     | 'OK'
nvme-pci-4100
Adapter: PCI adapter
Composite:    +51.9°C  (low  =  -0.1°C, high = +86.8°C)
                       (crit = +88.8°C)

k10temp-pci-00c3
Adapter: PCI adapter
Tctl:         +65.8°C  
Tccd1:        +52.2°C  
Tccd2:        +54.0°C  
Tccd3:        +54.8°C  
Tccd4:        +52.2°C  
Tccd5:        +51.4°C  
Tccd6:        +54.0°C  
Tccd7:        +54.5°C  
Tccd8:        +51.9°C  

For comparison, here are what the sensor readings normally look like under the same load:

ID | Name             | Type           | Reading    | Units | Event
2  | +VCORE_0         | Voltage        | 1.15       | V     | 'OK'
3  | +VCORE_1         | Voltage        | 1.16       | V     | 'OK'
4  | +VSOC            | Voltage        | 1.04       | V     | 'OK'
5  | +VDDIO           | Voltage        | 1.11       | V     | 'OK'
6  | +VDD_11_S3       | Voltage        | 1.14       | V     | 'OK'
7  | +CHIPSET_1.8V    | Voltage        | 1.87       | V     | 'OK'
8  | +CHIPSET_1.05V   | Voltage        | 1.06       | V     | 'OK'
9  | +12V             | Voltage        | 12.00      | V     | 'OK'
10 | +5V              | Voltage        | 4.97       | V     | 'OK'
11 | +3.3V            | Voltage        | 3.30       | V     | 'OK'
12 | +5VSB            | Voltage        | 4.97       | V     | 'OK'
13 | +3.3VSB          | Voltage        | 3.30       | V     | 'OK'
14 | VBAT             | Voltage        | 3.25       | V     | 'OK'
15 | CPU Package Temp | Temperature    | 67.00      | C     | 'OK'
17 | LAN Temp         | Temperature    | 59.00      | C     | 'OK'
18 | DIMMA1_Temp      | Temperature    | 70.00      | C     | 'OK'
19 | DIMMB1_Temp      | Temperature    | 71.00      | C     | 'OK'
20 | DIMMC1_Temp      | Temperature    | 70.00      | C     | 'OK'
21 | DIMMD1_Temp      | Temperature    | 69.00      | C     | 'OK'
22 | DIMME1_Temp      | Temperature    | 67.00      | C     | 'OK'
23 | DIMMF1_Temp      | Temperature    | 70.00      | C     | 'OK'
24 | DIMMG1_Temp      | Temperature    | 71.00      | C     | 'OK'
25 | DIMMH1_Temp      | Temperature    | 69.00      | C     | 'OK'
nvme-pci-4100
Adapter: PCI adapter
Composite:    +51.9°C  (low  =  -0.1°C, high = +86.8°C)
                       (crit = +88.8°C)

k10temp-pci-00c3
Adapter: PCI adapter
Tctl:         +66.8°C  
Tccd1:        +64.5°C  
Tccd2:        +65.5°C  
Tccd3:        +66.2°C  
Tccd4:        +63.6°C  
Tccd5:        +63.9°C  
Tccd6:        +66.0°C  
Tccd7:        +66.0°C  
Tccd8:        +66.0°C  

Other than trying to see if it also happens at near-idle, I don’t know what my next troubleshooting steps would be. Has anybody else experienced this?

Hi

Are you using BTRFS filesystem and timeshift automatic snapshotting?
I had some problems in the past with this combination that almost froze my system for a few seconds in regular intervals.

No, the filesystem is ext4 on top of LUKS-encrypted LVM. (The default stack for full disk encryption on a fresh install of Ubuntu.)

I just had a ~20 second throttle event, and here are some mpstat, vmstat and iostat outputs. Nothing out of the ordinary there. The throttling happened from 17:11:24 to 17:11:44.

05:11:18 PM  CPU    %usr   %nice    %sys %iowait    %irq   %soft  %steal  %guest  %gnice   %idle
05:11:19 PM  all   99.80    0.00    0.17    0.00    0.00    0.01    0.00    0.00    0.00    0.02
05:11:20 PM  all   99.98    0.00    0.02    0.00    0.00    0.00    0.00    0.00    0.00    0.00
05:11:21 PM  all   99.94    0.00    0.06    0.00    0.00    0.00    0.00    0.00    0.00    0.00
05:11:22 PM  all   99.95    0.00    0.05    0.00    0.00    0.00    0.00    0.00    0.00    0.00
05:11:23 PM  all   99.78    0.00    0.22    0.00    0.00    0.00    0.00    0.00    0.00    0.00
05:11:24 PM  all   99.87    0.00    0.13    0.00    0.00    0.00    0.00    0.00    0.00    0.00
05:11:25 PM  all   99.69    0.00    0.28    0.00    0.00    0.01    0.00    0.00    0.00    0.02
05:11:26 PM  all   99.14    0.00    0.73    0.00    0.00    0.02    0.00    0.00    0.00    0.12
05:11:27 PM  all   99.41    0.00    0.57    0.00    0.00    0.02    0.00    0.00    0.00    0.01
05:11:28 PM  all   98.24    0.00    1.24    0.00    0.00    0.04    0.00    0.00    0.00    0.48
05:11:29 PM  all   97.34    0.00    2.39    0.00    0.00    0.04    0.00    0.00    0.00    0.23
05:11:30 PM  all   97.57    0.00    1.95    0.00    0.00    0.02    0.00    0.00    0.00    0.46
05:11:31 PM  all   97.68    0.00    1.88    0.00    0.00    0.04    0.00    0.00    0.00    0.41
05:11:32 PM  all   98.01    0.00    1.89    0.00    0.00    0.05    0.00    0.00    0.00    0.05
05:11:33 PM  all   98.18    0.00    1.76    0.00    0.00    0.05    0.00    0.00    0.00    0.01
05:11:34 PM  all   97.73    0.00    1.96    0.00    0.00    0.05    0.00    0.00    0.00    0.26
05:11:35 PM  all   98.55    0.00    1.30    0.00    0.00    0.04    0.00    0.00    0.00    0.11
05:11:36 PM  all   98.28    0.00    1.01    0.00    0.00    0.05    0.00    0.00    0.00    0.66
05:11:37 PM  all   99.11    0.00    0.84    0.00    0.00    0.05    0.00    0.00    0.00    0.00
05:11:38 PM  all   98.73    0.00    1.13    0.00    0.00    0.05    0.00    0.00    0.00    0.09
05:11:39 PM  all   98.05    0.00    1.60    0.00    0.00    0.02    0.00    0.00    0.00    0.34
05:11:40 PM  all   97.99    0.00    1.41    0.00    0.00    0.05    0.00    0.00    0.00    0.55
05:11:41 PM  all   97.85    0.00    2.02    0.00    0.00    0.01    0.00    0.00    0.00    0.12
05:11:42 PM  all   98.43    0.00    1.54    0.00    0.00    0.03    0.00    0.00    0.00    0.00
05:11:43 PM  all   97.91    0.00    2.02    0.00    0.00    0.06    0.00    0.00    0.00    0.01
05:11:44 PM  all   98.40    0.00    1.36    0.00    0.00    0.01    0.00    0.00    0.00    0.23
05:11:45 PM  all   98.28    0.00    1.32    0.00    0.00    0.04    0.00    0.00    0.00    0.35
05:11:46 PM  all   99.95    0.00    0.05    0.00    0.00    0.00    0.00    0.00    0.00    0.00
05:11:47 PM  all   99.94    0.00    0.06    0.00    0.00    0.00    0.00    0.00    0.00    0.00
05:11:48 PM  all   99.91    0.00    0.09    0.00    0.00    0.00    0.00    0.00    0.00    0.00
05:11:49 PM  all   99.90    0.00    0.08    0.00    0.00    0.00    0.00    0.00    0.00    0.02
05:11:50 PM  all   99.87    0.00    0.12    0.00    0.00    0.00    0.00    0.00    0.00    0.01
 129    0       513536      1376132         9996     74279556    0    0     0     0 32540 1280 100   0   0   0   0   0 2024-03-06 17:11:19
 129    0       513536      1378716         9996     74279556    0    0     0     0 32357 1480 100   0   0   0   0   0 2024-03-06 17:11:20
 129    0       513536      1377008         9996     74279556    0    0     0     0 32379 1524 100   0   0   0   0   0 2024-03-06 17:11:21
 129    0       513536      1374988         9996     74279556    0    0     0     0 32651 1795 100   0   0   0   0   0 2024-03-06 17:11:22
 129    0       513536      1378140        10004     74279548    0    0     0  2072 97405 2078 100   0   0   0   0   0 2024-03-06 17:11:23
--procs-- -----------------------memory---------------------- ---swap-- -----io---- -system-- ----------cpu---------- -----timestamp-----
   r    b         swpd         free         buff        cache   si   so    bi    bo   in   cs  us  sy  id  wa  st  gu                 UTC
 131    0       513536      1377364        10004     74279560    0    0     0    16 32757 1252 100   0   0   0   0   0 2024-03-06 17:11:24
 131    0       513536      1377112        10004     74279560    0    0     0     0 33436 1766  99   1   0   0   0   0 2024-03-06 17:11:25
 131    0       513536      1377112        10004     74279560    0    0     0     0 33487 1591 100   0   0   0   0   0 2024-03-06 17:11:27
 131    0       513536      1377112        10004     74279560    0    0     0     0 33620 1822  98   1   0   0   0   0 2024-03-06 17:11:28
 133    0       513536      1376140        10012     74279560    0    0     0  1132 67636 1796  97   2   0   0   0   0 2024-03-06 17:11:29
 131    0       513536      1375640        10012     74279560    0    0     0     4 33607 1587  98   2   0   0   0   0 2024-03-06 17:11:30
 134    0       513536      1375416        10012     74279560    0    0     0     0 33523 2121  98   2   0   0   0   0 2024-03-06 17:11:31
 131    0       513536      1374664        10012     74279564    0    0     0     0 33539 1878  98   2   0   0   0   0 2024-03-06 17:11:32
 134    0       513536      1374664        10012     74279564    0    0     0     0 33131 1497  98   2   0   0   0   0 2024-03-06 17:11:33
 132    0       513536      1373404        10020     74279568    0    0     0   724 54722 2591  98   2   0   0   0   0 2024-03-06 17:11:34
 133    0       513536      1375704        10020     74279568    0    0     0     0 33594 1871  99   1   0   0   0   0 2024-03-06 17:11:35
 129    0       513536      1377276        10020     74279568    0    0     0     0 33930 2001  98   1   1   0   0   0 2024-03-06 17:11:36
 131    0       513536      1378656        10020     74279568    0    0     0     0 33410 1370  99   1   0   0   0   0 2024-03-06 17:11:37
 131    0       513536      1378408        10020     74279572    0    0     0     0 33411 1666  99   1   0   0   0   0 2024-03-06 17:11:38
 132    0       513536      1378184        10028     74279572    0    0     0   628 52147 2421  98   2   0   0   0   0 2024-03-06 17:11:39
03/06/2024 05:11:28 PM
avg-cpu:  %user   %nice %system %iowait  %steal   %idle
          97.44    0.00    2.04    0.00    0.00    0.52

Device             tps    kB_read/s    kB_wrtn/s    kB_dscd/s    kB_read    kB_wrtn    kB_dscd
dm-0            173.27         0.00      1053.47         0.00          0       1064          0
dm-1            173.27         0.00      1053.47         0.00          0       1064          0
dm-2              0.00         0.00         0.00         0.00          0          0          0
nvme0n1         176.24         0.00      1065.35         0.00          0       1076          0
nvme0n1p1         0.00         0.00         0.00         0.00          0          0          0
nvme0n1p2         0.00         0.00         0.00         0.00          0          0          0
nvme0n1p3       176.24         0.00      1065.35         0.00          0       1076          0
sda               0.00         0.00         0.00         0.00          0          0          0
sda1              0.00         0.00         0.00         0.00          0          0          0
sda2              0.00         0.00         0.00         0.00          0          0          0


03/06/2024 05:11:29 PM
avg-cpu:  %user   %nice %system %iowait  %steal   %idle
          97.75    0.00    2.11    0.00    0.00    0.13

Device             tps    kB_read/s    kB_wrtn/s    kB_dscd/s    kB_read    kB_wrtn    kB_dscd
dm-0             19.00         0.00        72.00         0.00          0         72          0
dm-1             19.00         0.00        72.00         0.00          0         72          0
dm-2              0.00         0.00         0.00         0.00          0          0          0
nvme0n1          14.00         0.00        60.00         0.00          0         60          0
nvme0n1p1         0.00         0.00         0.00         0.00          0          0          0
nvme0n1p2         0.00         0.00         0.00         0.00          0          0          0
nvme0n1p3        14.00         0.00        60.00         0.00          0         60          0
sda               0.00         0.00         0.00         0.00          0          0          0
sda1              0.00         0.00         0.00         0.00          0          0          0
sda2              0.00         0.00         0.00         0.00          0          0          0


03/06/2024 05:11:30 PM
avg-cpu:  %user   %nice %system %iowait  %steal   %idle
          97.58    0.00    1.69    0.00    0.00    0.73

Device             tps    kB_read/s    kB_wrtn/s    kB_dscd/s    kB_read    kB_wrtn    kB_dscd
dm-0              0.00         0.00         0.00         0.00          0          0          0
dm-1              0.00         0.00         0.00         0.00          0          0          0
dm-2              0.00         0.00         0.00         0.00          0          0          0
nvme0n1           0.00         0.00         0.00         0.00          0          0          0
nvme0n1p1         0.00         0.00         0.00         0.00          0          0          0
nvme0n1p2         0.00         0.00         0.00         0.00          0          0          0
nvme0n1p3         0.00         0.00         0.00         0.00          0          0          0
sda               0.00         0.00         0.00         0.00          0          0          0
sda1              0.00         0.00         0.00         0.00          0          0          0
sda2              0.00         0.00         0.00         0.00          0          0          0

Hmm ok. Then I dodn’t have an immediate clue.

I didn’t know the frequence can drop that much. I have a threadripper 3575wx and mine doesn’t go lower than 2,2 Ghz.

What does cpupower frequeny-info say?

rgysi@zephir:~$ cpupower frequency-info 
analyzing CPU 0:
  driver: acpi-cpufreq
  CPUs which run at the same hardware frequency: 0
  CPUs which need to have their frequency coordinated by software: 0
  maximum transition latency:  Cannot determine or is not supported.
  hardware limits: 2.20 GHz - 4.37 GHz
  available frequency steps:  3.50 GHz, 2.40 GHz, 2.20 GHz
  available cpufreq governors: performance schedutil
  current policy: frequency should be within 2.20 GHz and 3.50 GHz.
                  The governor "performance" may decide which speed to use
                  within this range.
  current CPU frequency: Unable to call hardware
  current CPU frequency: 4.15 GHz (asserted by call to kernel)
  boost state support:
    Supported: yes
    Active: no
rgysi@zephir:~$

Thanks for helping out. Here’s what cpupower frequency-info has to say. I noticed that if I run it as root, it outputs a few more details.

$ sudo cpupower frequency-info
analyzing CPU 29:
  driver: amd-pstate-epp
  CPUs which run at the same hardware frequency: 29
  CPUs which need to have their frequency coordinated by software: 29
  maximum transition latency:  Cannot determine or is not supported.
  hardware limits: 545 MHz - 5.37 GHz
  available cpufreq governors: performance powersave
  current policy: frequency should be within 545 MHz and 5.37 GHz.
                  The governor "powersave" may decide which speed to use
                  within this range.
  current CPU frequency: Unable to call hardware
  current CPU frequency: 4.76 GHz (asserted by call to kernel)
  boost state support:
    Supported: yes
    Active: yes
    Boost States: 0
    Total States: 3
    Pstate-P0:  3200MHz
    Pstate-P1:  2200MHz
    Pstate-P2:  1500MHz

Edit: I ran cpupower frequency-info on each of the cores individually. They are all 545 MHz - 5.37 GHz except for ccd1 and ccd5:

$ for i in {0..63}; do taskset -c $i cpupower frequency-info; done | grep hardware.limits | nl -v0 | grep -v '5\.37 GHz'
     8	  hardware limits: 545 MHz - 7.79 GHz
     9	  hardware limits: 545 MHz - 7.63 GHz
    10	  hardware limits: 545 MHz - 6.98 GHz
    11	  hardware limits: 545 MHz - 7.14 GHz
    12	  hardware limits: 545 MHz - 6.82 GHz
    13	  hardware limits: 545 MHz - 7.79 GHz
    14	  hardware limits: 545 MHz - 7.47 GHz
    15	  hardware limits: 545 MHz - 7.31 GHz
    40	  hardware limits: 545 MHz - 6.50 GHz
    41	  hardware limits: 545 MHz - 5.69 GHz
    42	  hardware limits: 545 MHz - 6.34 GHz
    43	  hardware limits: 545 MHz - 6.66 GHz
    44	  hardware limits: 545 MHz - 5.53 GHz
    45	  hardware limits: 545 MHz - 5.85 GHz
    46	  hardware limits: 545 MHz - 6.01 GHz
    47	  hardware limits: 545 MHz - 6.17 GHz

Ah ok, so it looks the newer threadripper can clock as low as 545 MHz, so that is ok then.
Maybe it’s some bug in the powersave scheduler. I don’t know.

You could try to set the cpufreq governor to performance via ’ cpupower frequency-set --governor performance’ but that will then use more power, or try setting the min frequency.

Do you have the tuned.service running? Maybe that service does some sporadic changes.

Got any way to measure VRM thermals? Maybe chipset as well?

I’ll give that a try later today. And no, I don’t have tuned installed.

Other than rebooting into the BIOS setup menu, I haven’t found a way. Those sensors are missing in IPMI. One thing I could try though is to play with the VRM fan curves and see if the problem gets subjectively better or worse.

I enabled the performance governor, but it looks like I’m still getting frequency dropouts. As I’m writing this, it just happened again (not included in the graphs below.)

I rebooted into the BIOS menu and checked temperatures and fan curves (with the system idle since I can’t run any workloads from BIOS.) The hottest sensor was Chipset at a constant 75C. I tried spinning up each of the fans, but none had any effect on the chipset temperature.

Of the two VRM banks, VRMW consistently runs hotter because it is on the exhaust side of the CPU cooler. Both VRM fan curves are set to Standard.

Overnight, the VRM fans were running at less than 100%, which suggests to me that there is still some thermal headroom when the throttling occurs.

vrmw

CPU’s throttle due to temperature or lack of available power. Your temps don’t appear too out of line with the average. To me, it smells of a power issue.

What’s the brand and capacity of the PS? Some power supplies don’t have decent undervolt protection. Even a decent PS on bad power will be sketchy.

Is the unit on a UPS? If not, is it on the same circuit as a microwave, hot water heater or other heavy draw appliance? I’ve seen PC’s crash before when starved of power in hurricane caused brownouts. Other power drawn on the same circuit will reduce available power to the your workstation. Your TR may just be more resilient in low voltage situations. Sorry, just guessing at this point.

These are all good questions. The power supply is a Corsair AX1600i and it’s only drawing about 500W of power from the wall. The PSU should be overkill for the task. I don’t have it on a UPS.

Input: voltage = 117 v, current = 4.375 a, power = 494 w

The office circuit is an issue. It’s undersized (15A) and services the outlets and lighting in too many rooms, though it’s not as bad as it once was (the bathrooms are no longer on that circuit; they have their own 20A now.) This is something I intend to address. Main panel power is not an issue; it’s 200A service which is oversized for the building.

To rule out voltage dips, I tested by running my laser printer (which will dim the lights briefly when it energizes) and by cycling a hairdryer on and off. I wasn’t able to trigger a throttling event. To completely eliminate it as a possibility, I’m going to plug the system into the new 20A bathroom circuit; it will be the only appliance running on that circuit.

1 Like

Cool. On a 20A / 115v circuit you should be able to draw ~1920 watts safely. Breakers will trip at 25% above that, typically.

Update: I ran it on a 20A dedicated circuit for the day in an location with better ventilation, but it was still having throttling episodes. The mystery continues unsolved.

I’m running out of ideas at this point. If anybody else wants to see if it’s happening to them too, here’s a Linux command that will check the max core frequency once per second and print if the max is less than 600. It wouldn’t surprise me to find out that others were affected as well. The effect can be easy to miss if you’re not looking for it.

while sleep 1; do awk '/MHz/ { if (max < $4) max = $4 } END { if (max < 600) print strftime("%F_%T", systime()), max }' /proc/cpuinfo; done

Example output while running an all-cores workload:

2024-03-08_01:47:18 544.676
2024-03-08_01:47:20 544.690
2024-03-08_01:47:21 544.691
2024-03-08_01:47:22 544.687
2024-03-08_01:47:24 544.882
2024-03-08_01:47:25 544.691
2024-03-08_01:47:26 544.753
2024-03-08_01:47:28 544.684
2024-03-08_01:47:29 544.685
2024-03-08_01:47:30 544.694
2024-03-08_01:47:32 544.858
2024-03-08_01:47:33 544.760
2024-03-08_01:47:34 544.900
2024-03-08_01:47:35 544.698
2024-03-08_01:47:37 544.731
2024-03-08_01:47:38 544.687
2024-03-08_01:47:39 544.725
2024-03-08_01:47:41 544.686
2024-03-08_01:47:42 544.688
2024-03-08_01:47:43 545.103
2024-03-08_02:20:16 544.690
2024-03-08_02:20:17 544.688
2024-03-08_02:20:18 544.690
2024-03-08_02:20:20 544.690
2024-03-08_02:20:21 544.689
2024-03-08_02:20:22 544.740
2024-03-08_02:20:24 544.690
2024-03-08_02:20:25 544.764
2024-03-08_02:20:26 544.689
2024-03-08_02:20:28 544.691
2024-03-08_04:54:02 544.688
2024-03-08_04:54:03 544.790
2024-03-08_04:54:04 544.689
2024-03-08_04:54:06 544.687
2024-03-08_04:54:07 544.691
2024-03-08_04:54:08 544.818
2024-03-08_04:54:10 544.733
2024-03-08_04:54:11 544.824
2024-03-08_04:54:12 544.772
2024-03-08_04:54:13 544.856
2024-03-08_04:54:15 544.690
2024-03-08_04:54:16 544.689
2024-03-08_04:54:17 544.689
2024-03-08_04:54:19 544.714
2024-03-08_04:54:20 544.752
2024-03-08_04:54:21 544.710
2024-03-08_04:54:23 544.695
2024-03-08_04:54:24 544.757
2024-03-08_04:54:25 544.685

Another issue I’ve been having is that whenever the system is idle, after a while it just freezes up completely. Not even the Magic SysRq key works (over serial console, since I can’t wake up the display.) I plan on trying to disable the C6 state to see if that helps.

But back to the throttling issue… So today I stopped a workload in order to do more development on the code and the system ended up freezing. I power cycled the system and decided to let it idle again to see if I could reproduce the freeze. After 30+ minutes of not freezing, I wanted to try briefly putting the system under load and letting it return to idle, but I noticed the workload was running very slowly. It turns out all my cores were throttled, and stuck that way until I rebooted.

Something is screwy with power management.

Have you tried blowing air over your dimms? DDR5 does not like to be as hot as your temps show. Memory cooling may help since the memory throttles DDR5. Gskill recommends cooling above 60C. Memory cooling was optional on DDR4 on workstations, but mandatory for DDR5 if you want to maintain performance.

I have a total of four 40mm fans blowing directly down into the DIMM slots, two per bank of DIMMs. Without the fans, the memory temperatures for slots B, C, F, and G (the “middle” slots) were approaching 85C under load. I stopped the load before finding out just how high the temperatures wanted to climb.

These Kingston modules have an operating temperature range of 0-95C. The spec sheet doesn’t mention at what threshold they throttle. But given that they have reached 80-85C without causing the CPU to drop all cores down to minimum frequency, I’m inclined to disregard it as a possible cause—especially now that I’ve seen this happen while the system had been sitting idle for 30+ minutes. At idle, DIMM temperatures are in the 40-45C range.

2 Likes

Well… after spending a full day scouring Google, I just happened to stumble on this thread. Guess I should have known that starting on the L1T forums would have saved me time!

Voltara, it’s good to run into you again. If it helps, I’m experiencing the exact same behavior you are. If there’s any interest in me trying to more rigorously validate what you’re seeing, let me know what commands you’d like the output of and I’ll run them. This issue has prevented me from fully deploying this machine into production.

Subjectively, I’m noticing everything you mentioned: desktop environment and my various terminals randomly grinding to a halt in terms of responsiveness for as briefly as a few seconds to as long as an hour. CPU and RAM utilization are seemingly both in single digit percentages (2-4%) while disk IO is similarly minimal (0-5KiB/s). This seems to happen once or twice a day. Yesterday, it caused a workload that usually takes 40 minutes to complete to take 1 hour and 33 minutes.

I’ve been benchmarking all day in order to try to track down what’s causing it, but haven’t been able to identify anything concrete. I originally suspected power states, but as already identified above, it seems our CPUs are capable of dipping quite low by design (545MHz). I’m just not sure how to instantly force them to leave that low power state when there’s actual work to be done.

Here’s what I’m running on my end:

Hardware
Motherboard: ASUS Pro WS WRX90E-SAGE SE (404 BIOS Rev.)
CPU: AMD Ryzen Threadripper PRO 7965WX
RAM: 256GB Kingston Fury DDR5 6000 MT/s CL32 1.35V RDIMM (8x32GB, 256GB - KF560R32RBK8-256)
PSU: Seasonic Vertex PX-1200
OS: Debian 12.5, fully updated

One last thing I’ll add… I’m currently exploring the following:

echo governor | tee /sys/devices/system/cpu/cpu*/cpufreq/scaling_governor

This forces the CPU to stay out of any power-save states and will last until I reboot. A quick htop confirms all cores currently at 3.8GHz, even when doing no work. Not great for my power bill, but if it helps with troubleshooting, it seems like a worthy cause.

Here’s the ArchWiki with some additional info:

https://wiki.archlinux.org/title/CPU_frequency_scaling

Another victim… It’s interesting that we’re both running Linux - I wonder if that has anything to do with it.

If you didn’t see the shell command I included in a previous post, this is what I’ve been using to monitor for frequency drops. It checks /proc/cpuinfo at 1-second intervals and logs whenever the max frequency over all cores dips below 600. It will occasionally print out a false alarm if the system happens to be idle at the time.

Which scaling governor were you setting with the echo [governor] | tee /sys... command? I assume performance?

My current status is I’ve been running a related but different workload for the past 36 hours. I still had two throttling events, but they’ve been subjectively rarer. This program stresses the system differently; for example, it doesn’t raise the RAM temperatures as much as the other one does.

If you’re feeling adventurous, I now have a way to read the VRM temperatures. You “just” need to patch the asus-ec-sensors kernel module. I still haven’t figured out where the chipset temperature is hiding.

On the topic of sensors, the nct6775 module can read your chassis & cpu fan speeds. It’s also reporting a whole slew of voltages and temperatures, but the numbers don’t make any sense. They probably need to be scaled.

Perhaps something to check (though I have no idea how)