That would be great!
You can start by downloading Blender and then download demo files here.
In particular, I’d love to see you run simulations like Index of nearest, Mesh fracturing and especially my own file with some really heavy computations.
Original Blender files with Simulation nodes depend on Scene time. Activate the simulation by hitting spacebar. To reset the simulation, you can either drag the Scene time cursor back to 1st frame or use shortcut L Shift + Left arrow and hit spacebar again.
Simulations automatically bake data on the first run and most of the time every other run is much faster, because no actual simulation is running anymore. It’s just an animation of prebaked simulation at this point. However, if you’ll change anything within the simulation node tree, bake will cancel and the entire simulation will have to run and bake once again. This baked data is visually represented by little, purple bar at the bottom on Scene time tab.
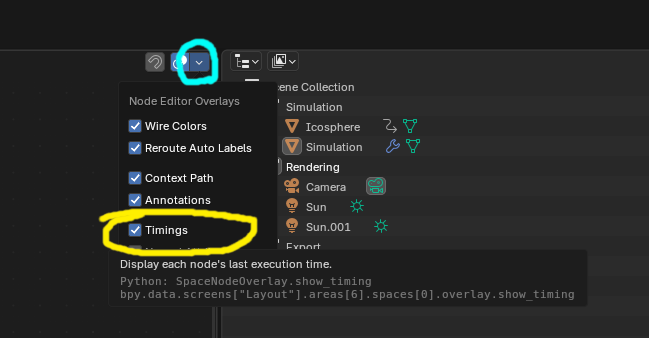
For basic interface movement within simulation node environment, click and hold mouse wheel. To measure how much each simulation/geometry node tree takes to execute in milliseconds, you can turn on Timings (hit that little, white arrow pointing down, on the blue background). This is file depedent setting and will have to be turned on with each file individually.
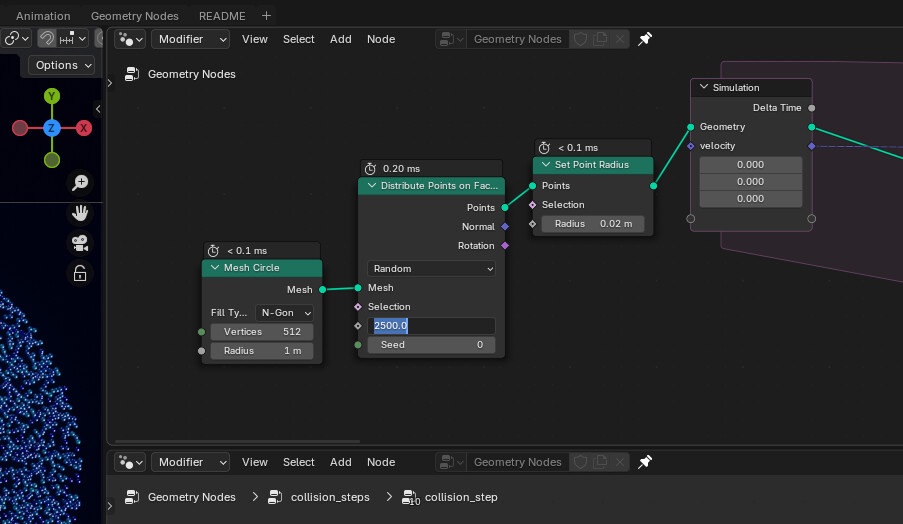
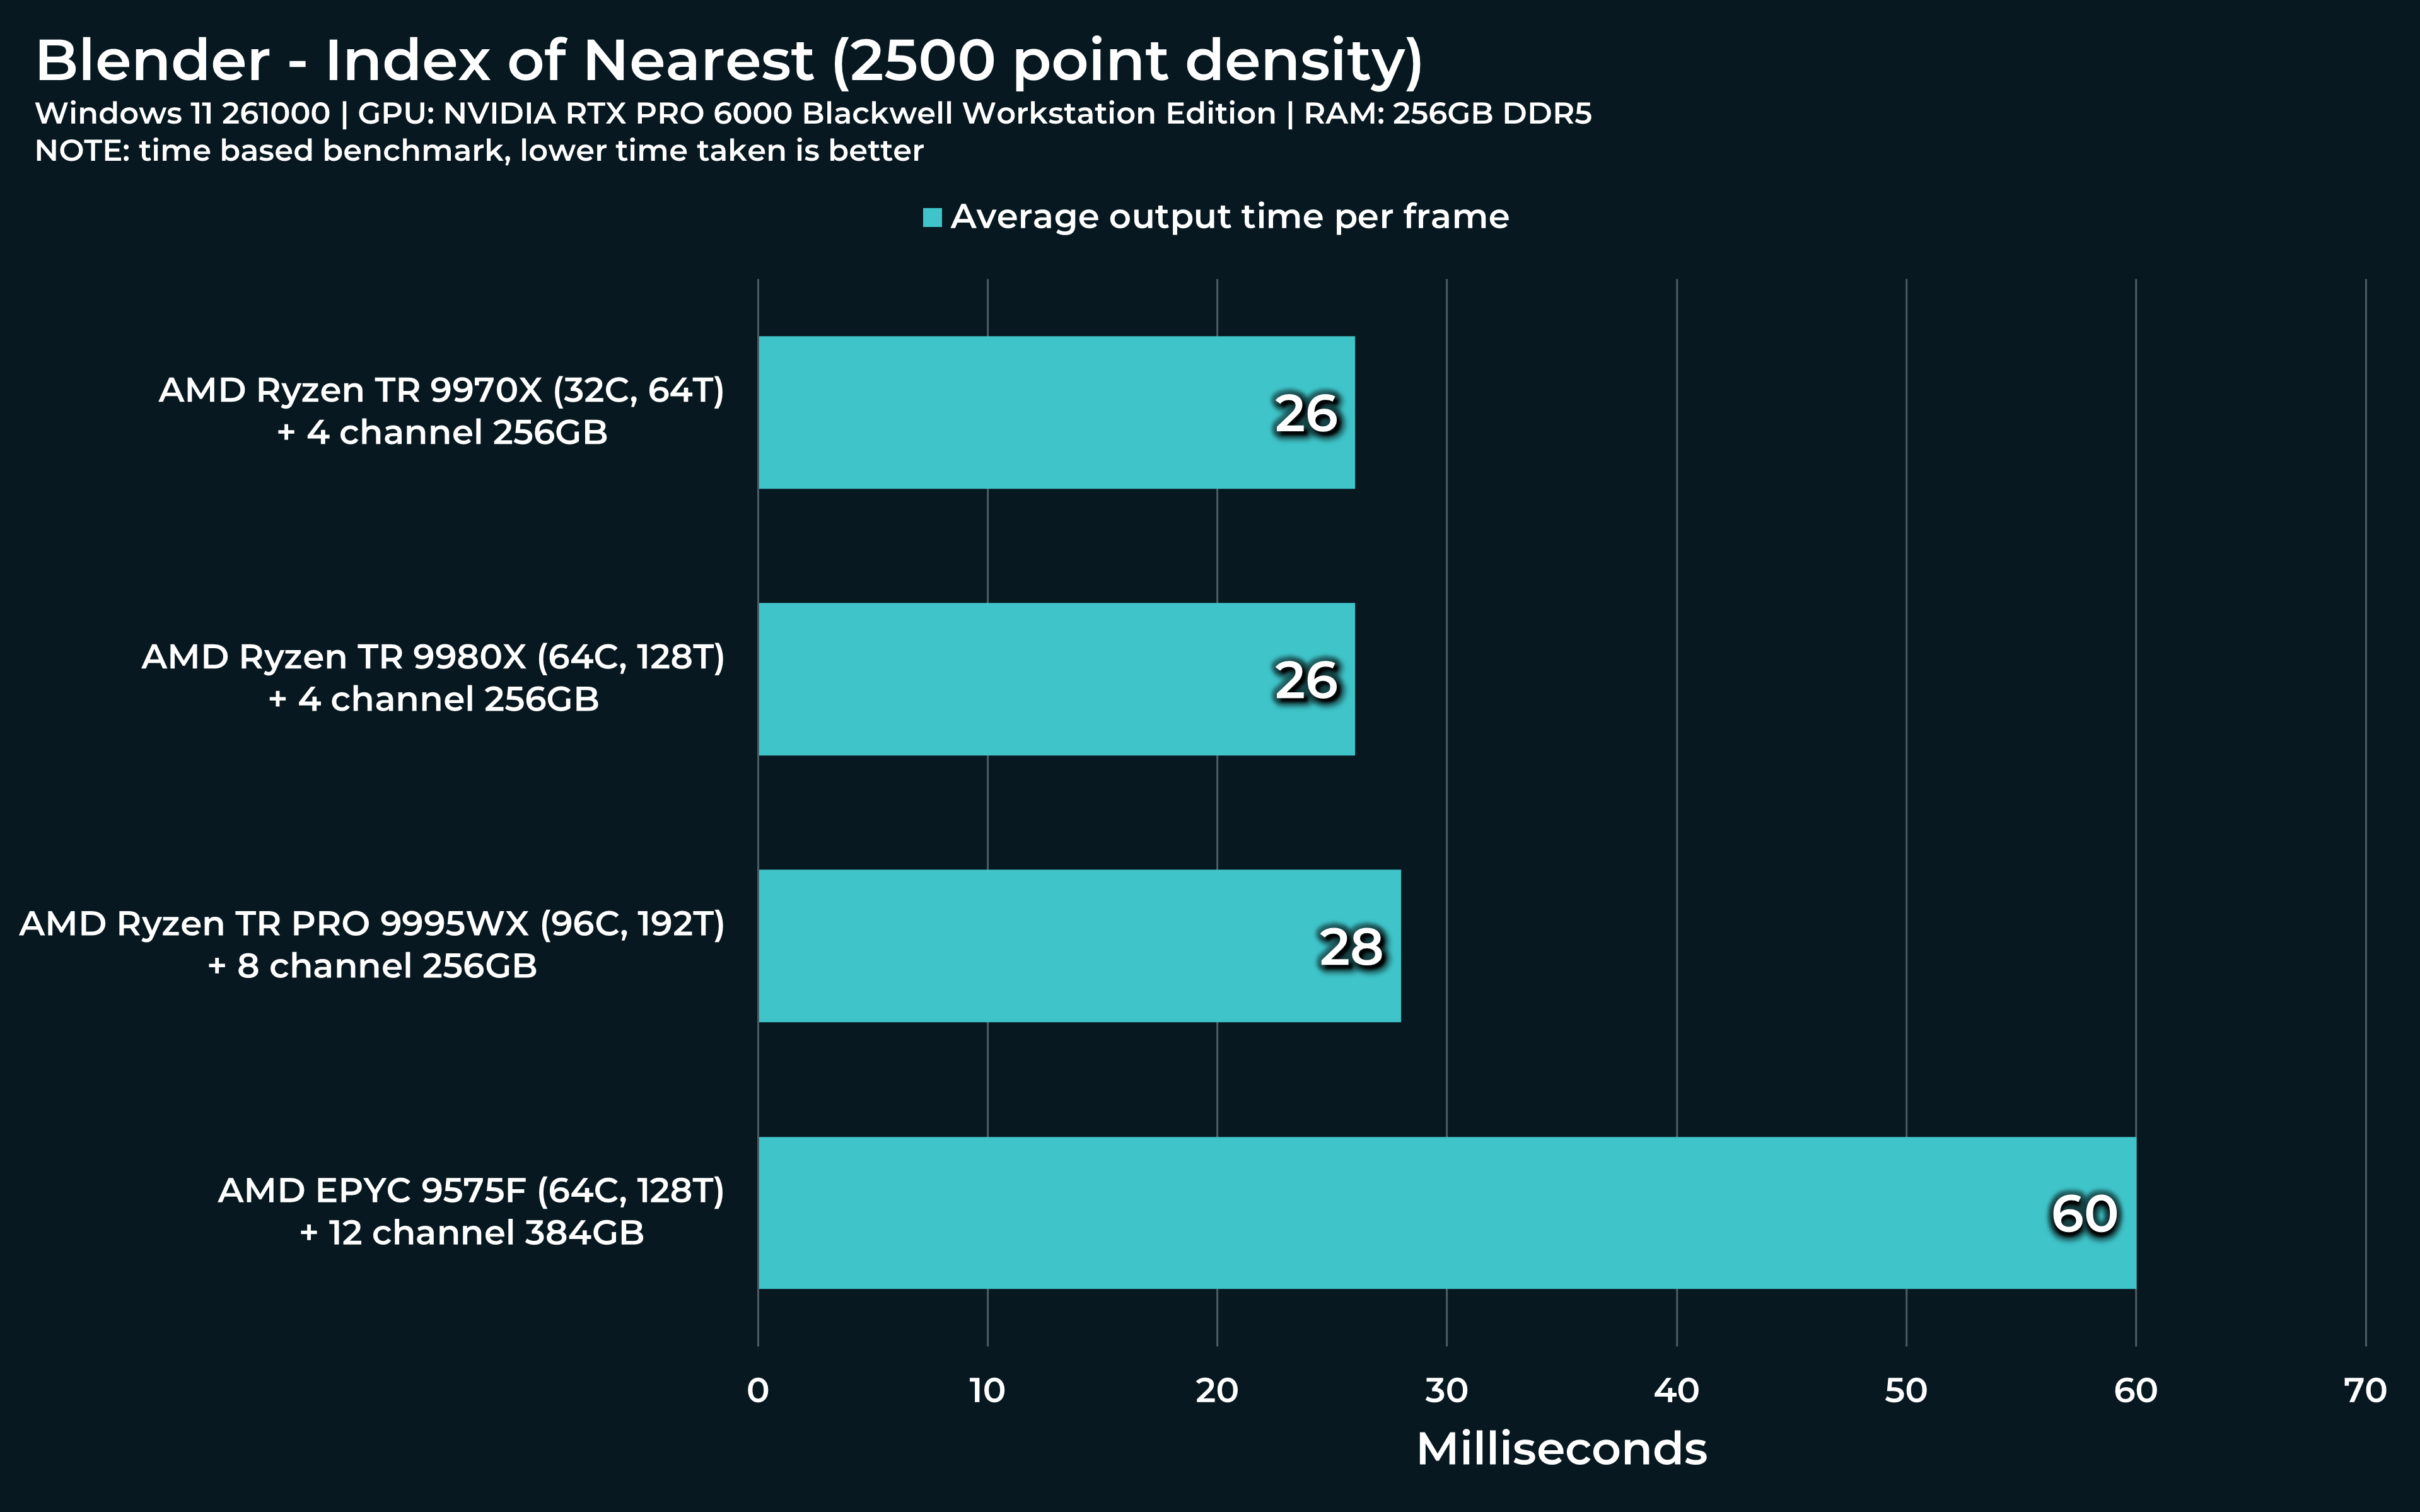
For Index of nearest file:
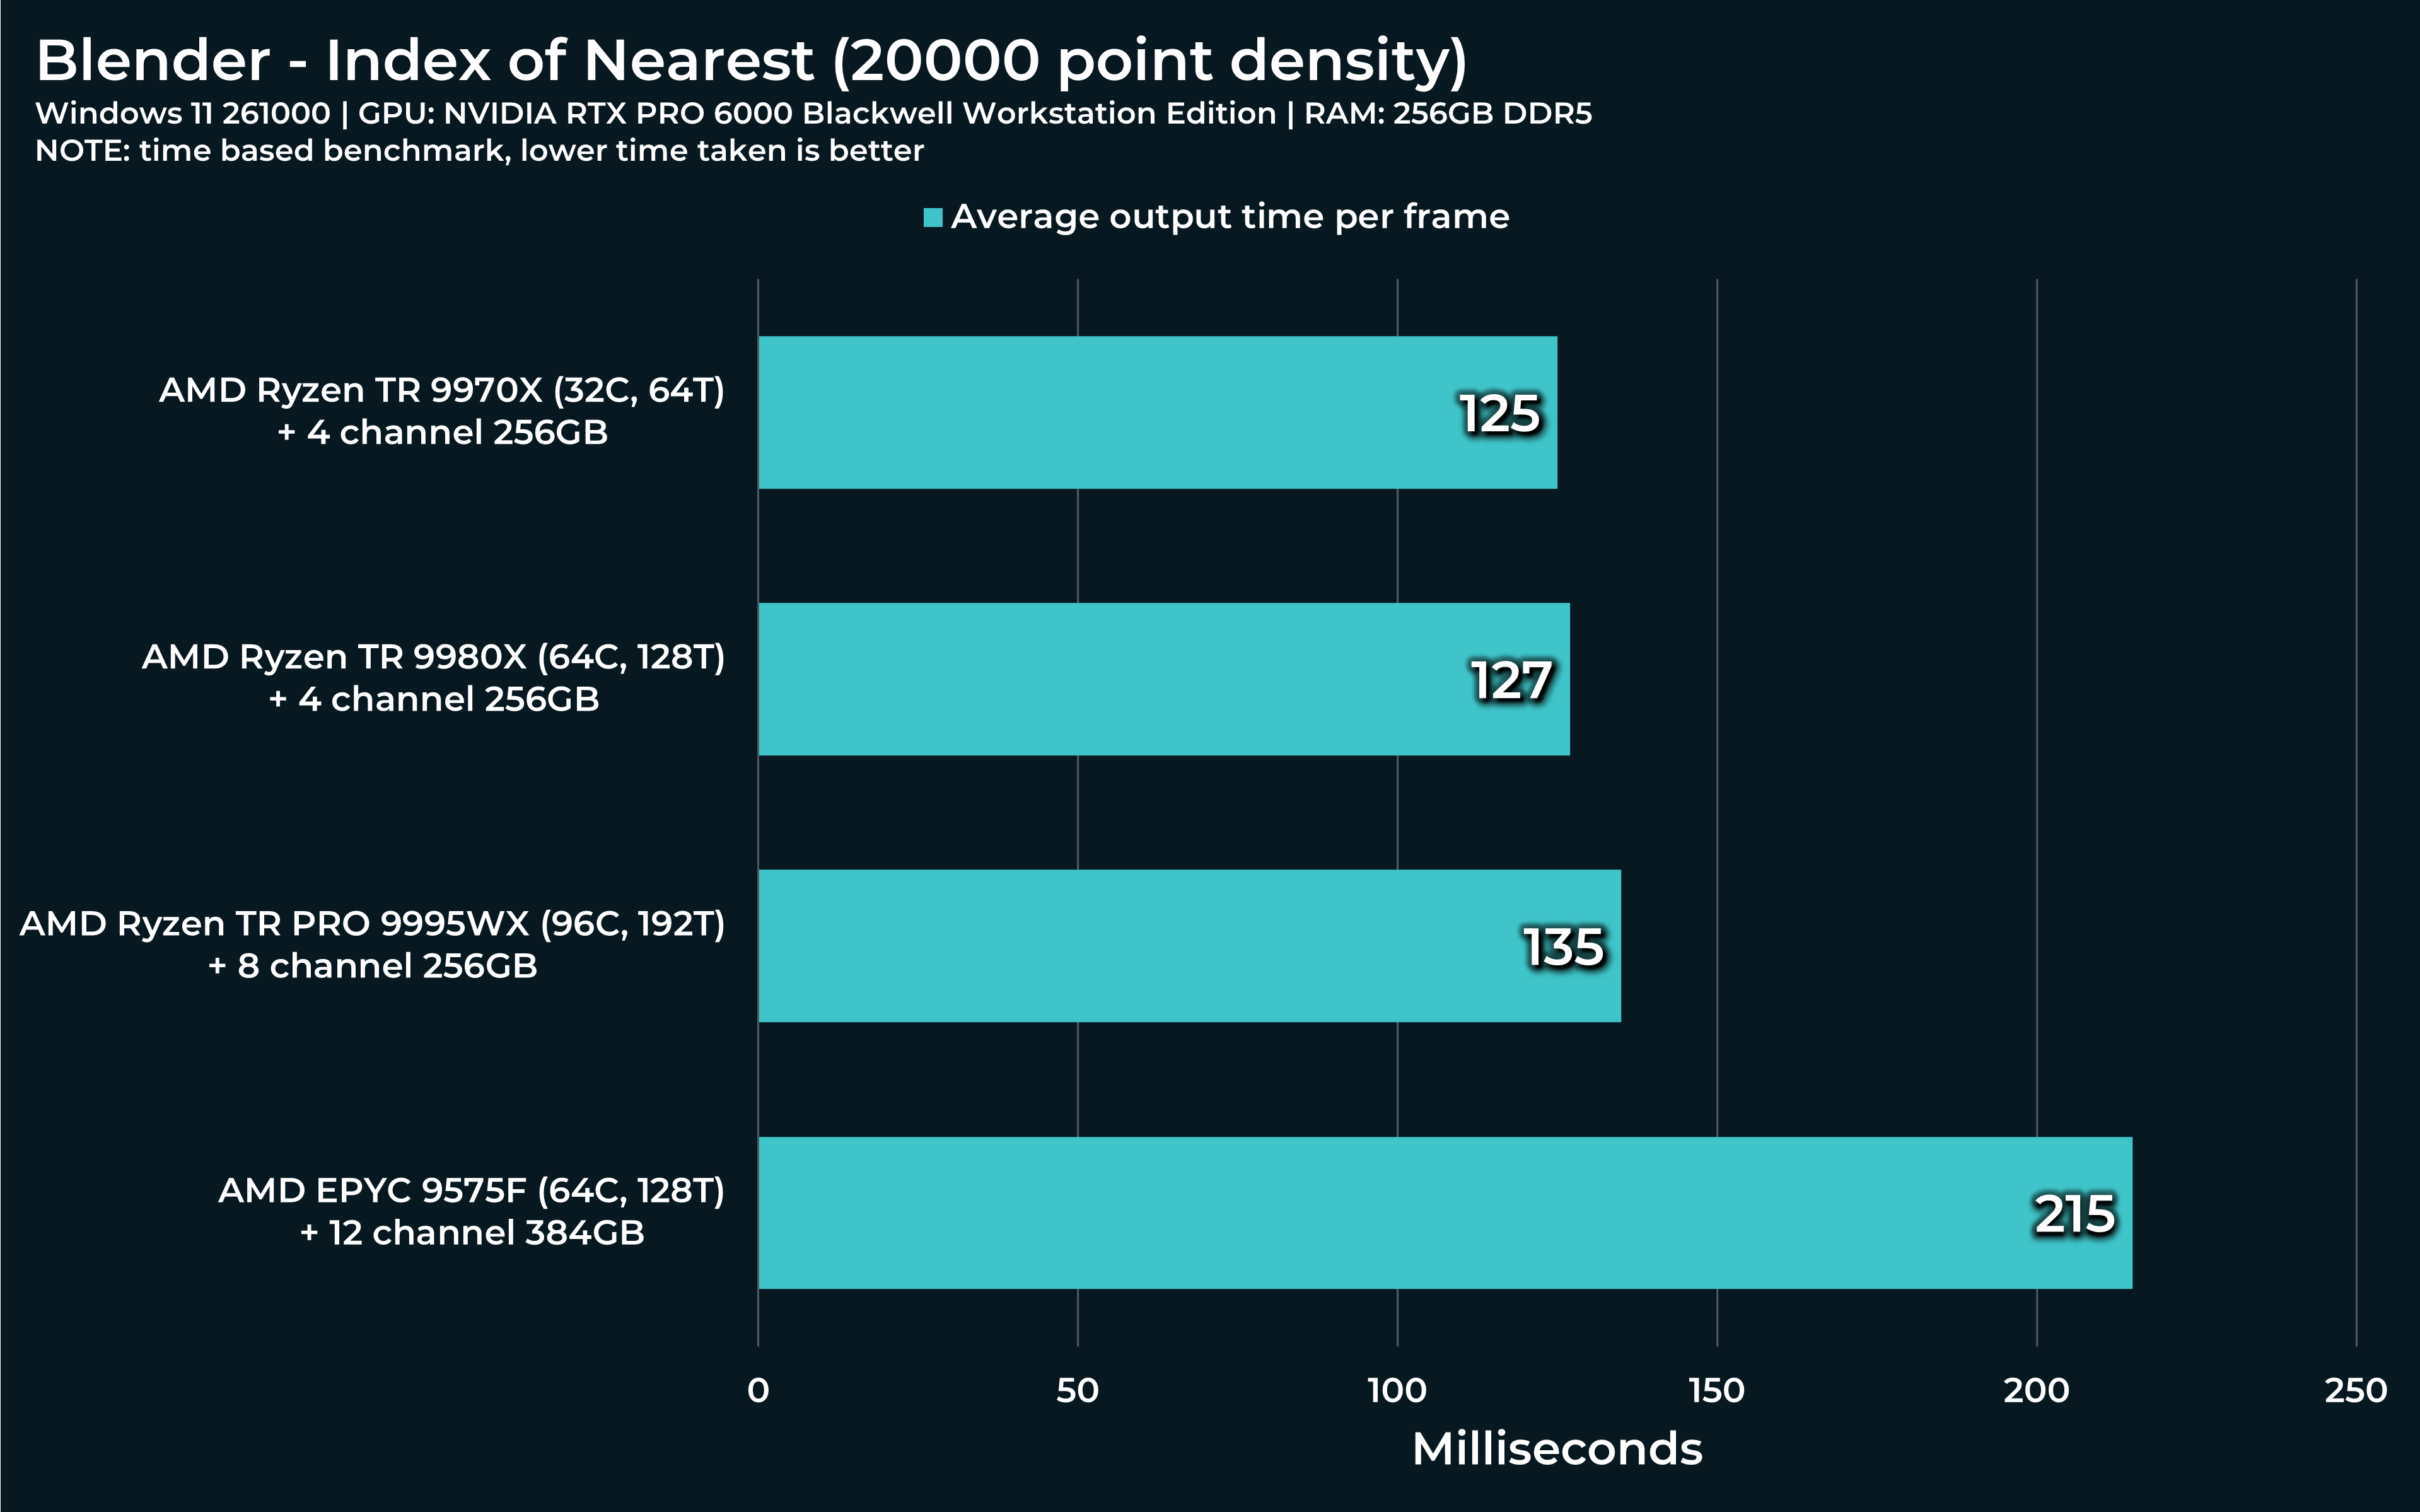
At the top Geometry node window, you’ll see Distribute Points on Faces node, second from the left. The default value is 2500. After you run this, change it to 20 000. Run the simulation from the beginning again. I’d like to know how Threadripper’s performance will vary.
The simulation seems to be running constantly, without being automatically baked for next run. Not sure why is that.
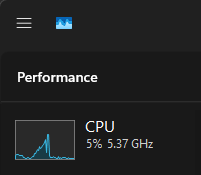
2500 (default) with 7950x: Results to ~27ms during the simulation, Task manager shows 68% of CPU used.
20 000 with 7950x: Results to ~170ms during the simulation on my system, Task manager shows 50% of CPU used.
Over 20 000 value seems to be visually breaking entiry simulation…
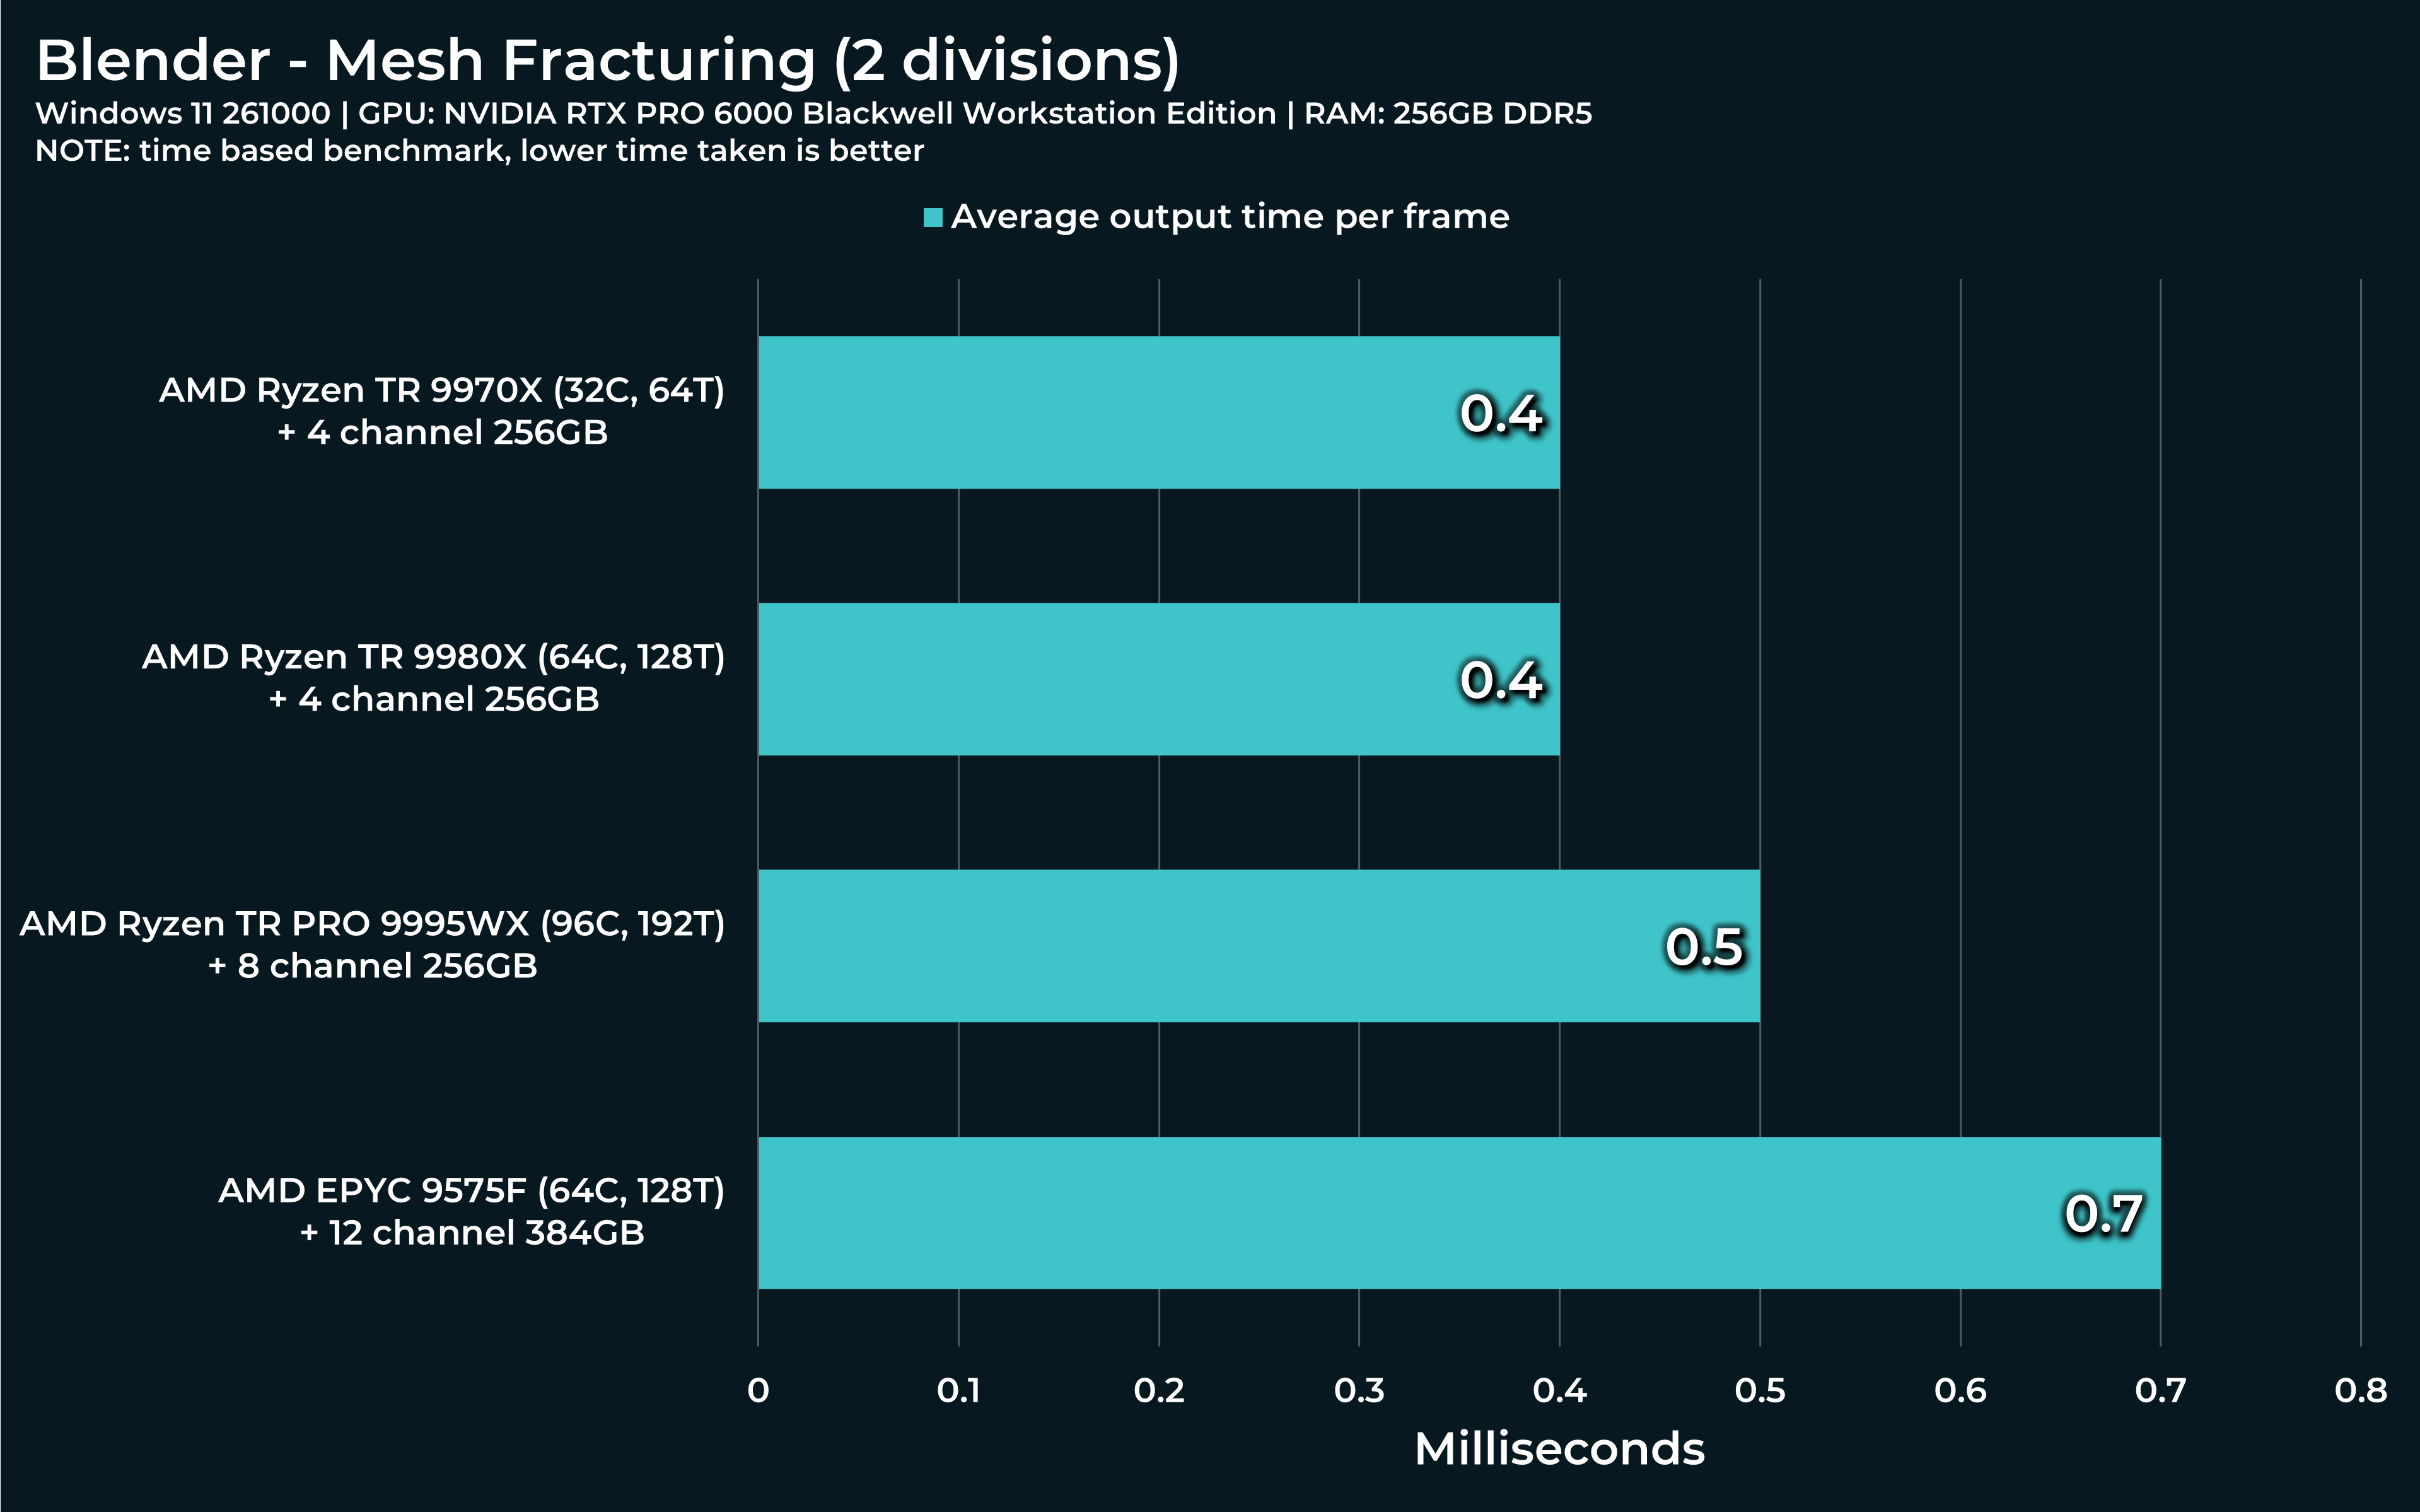
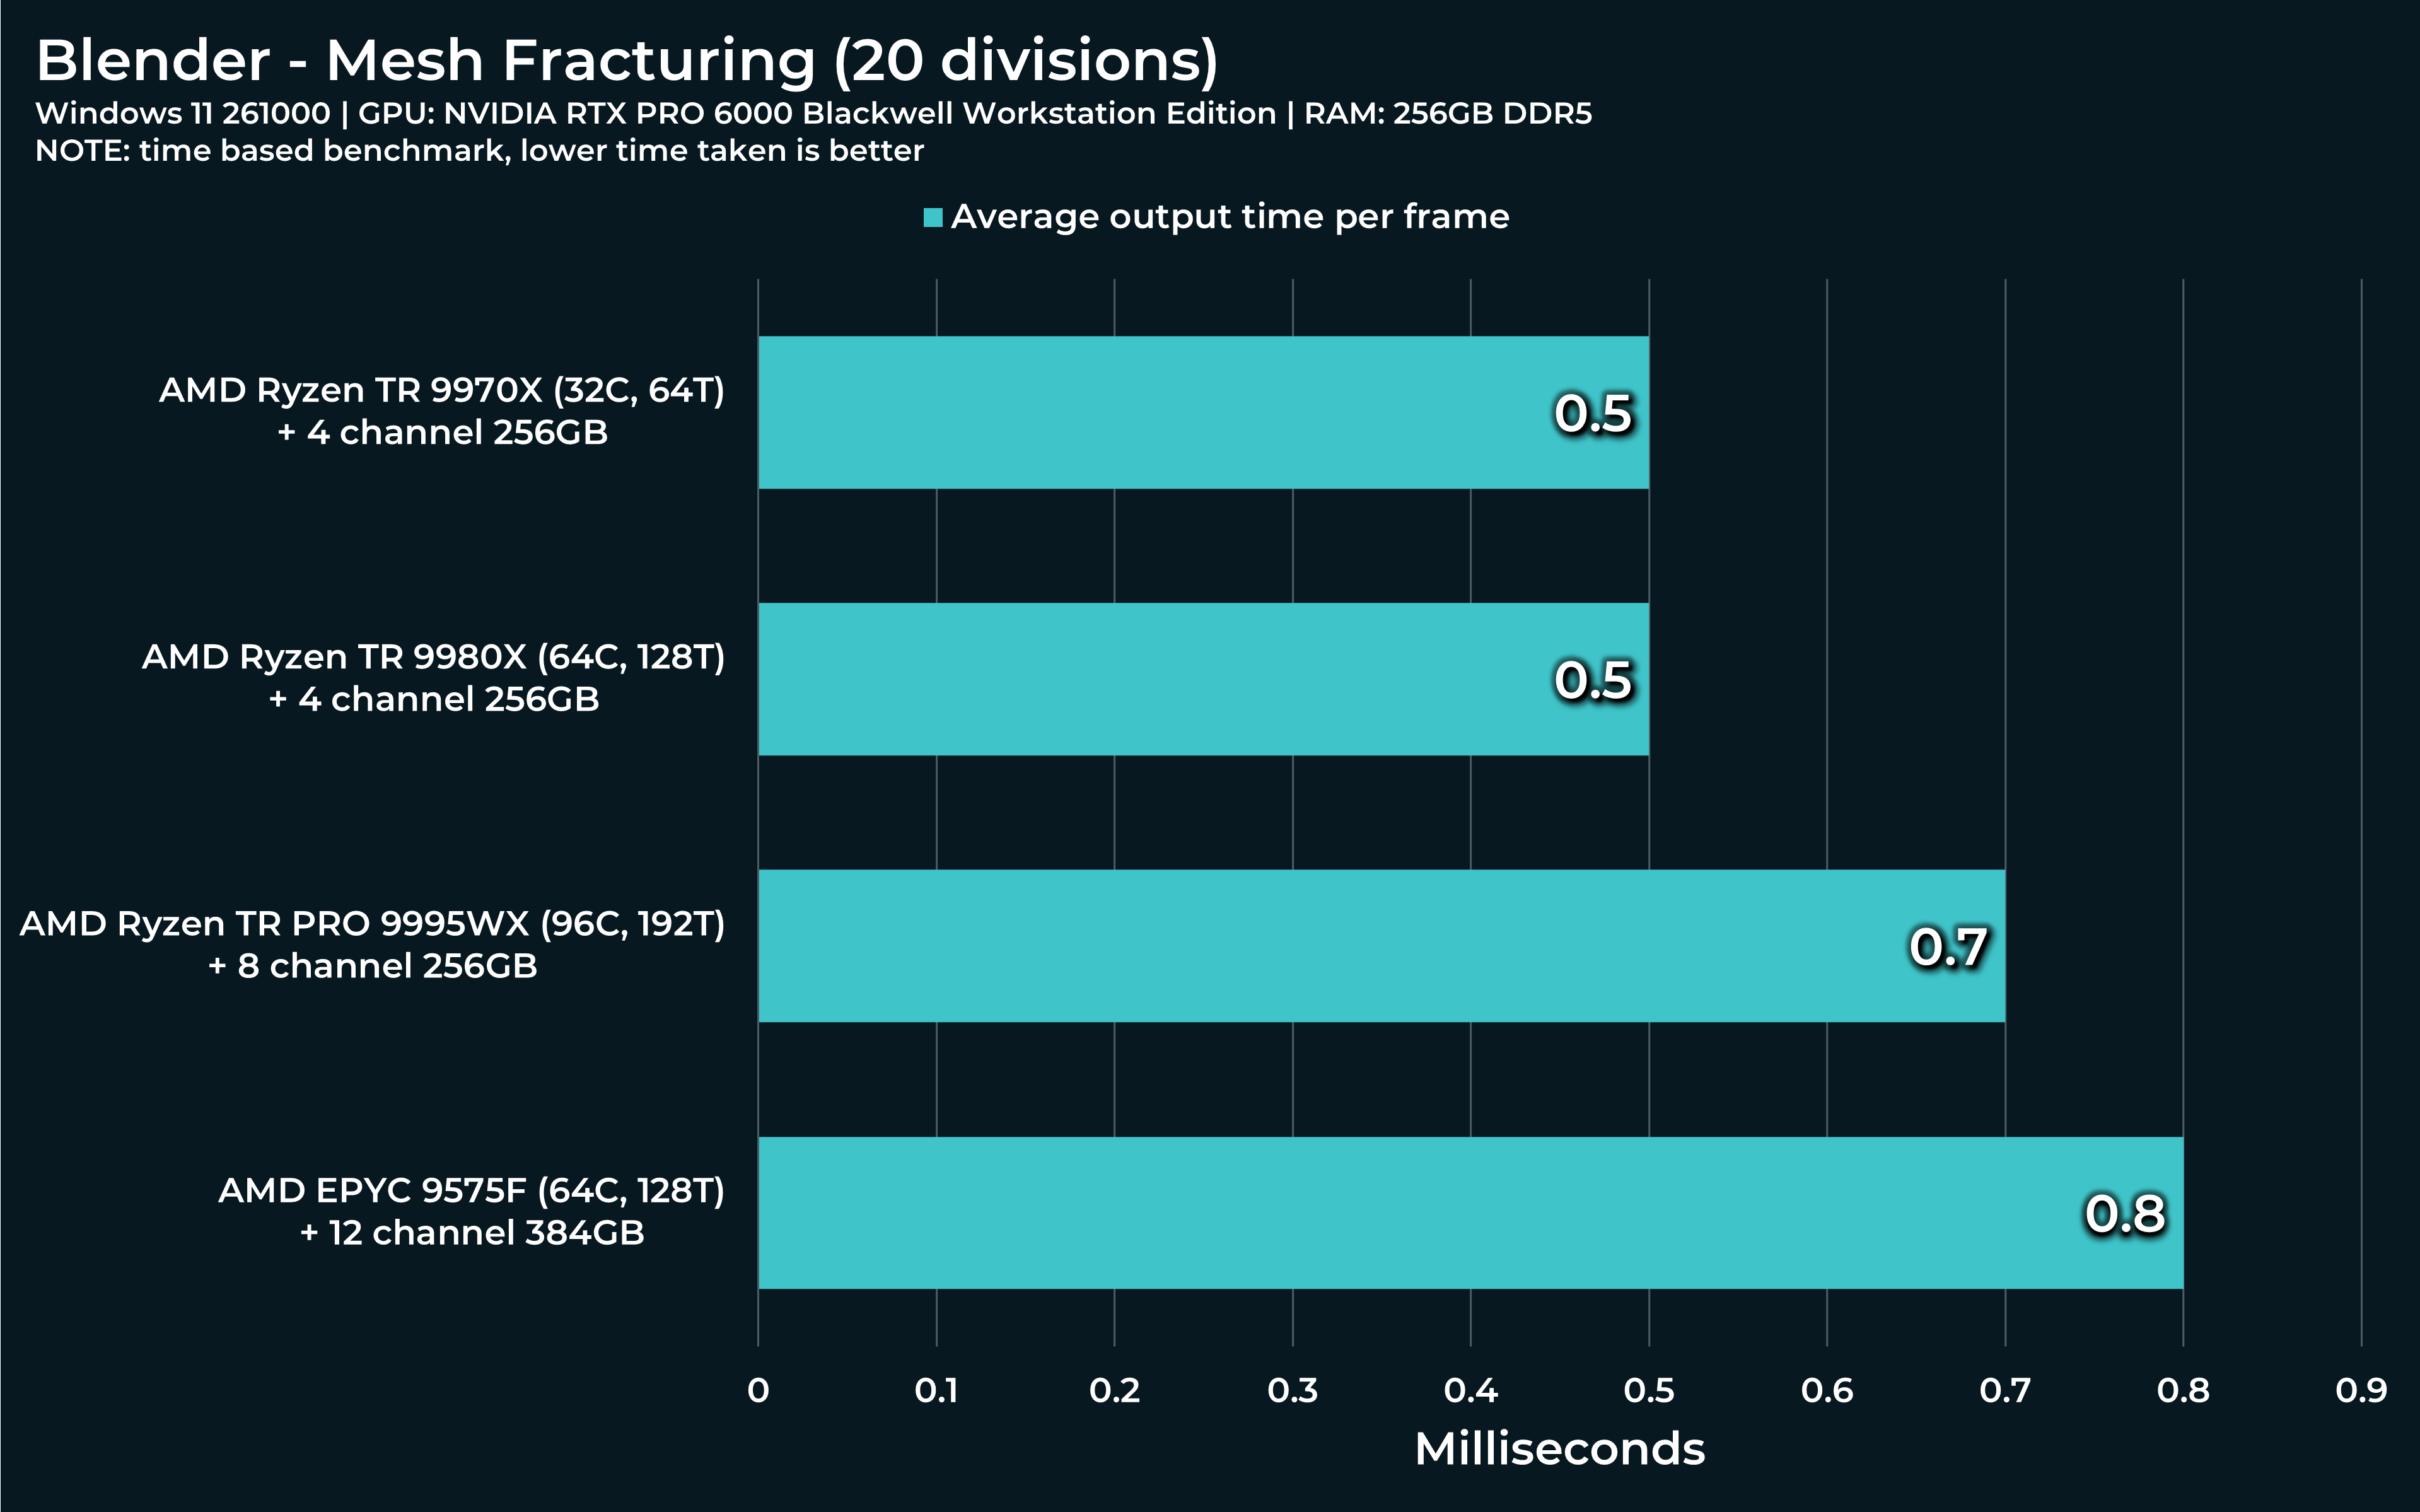
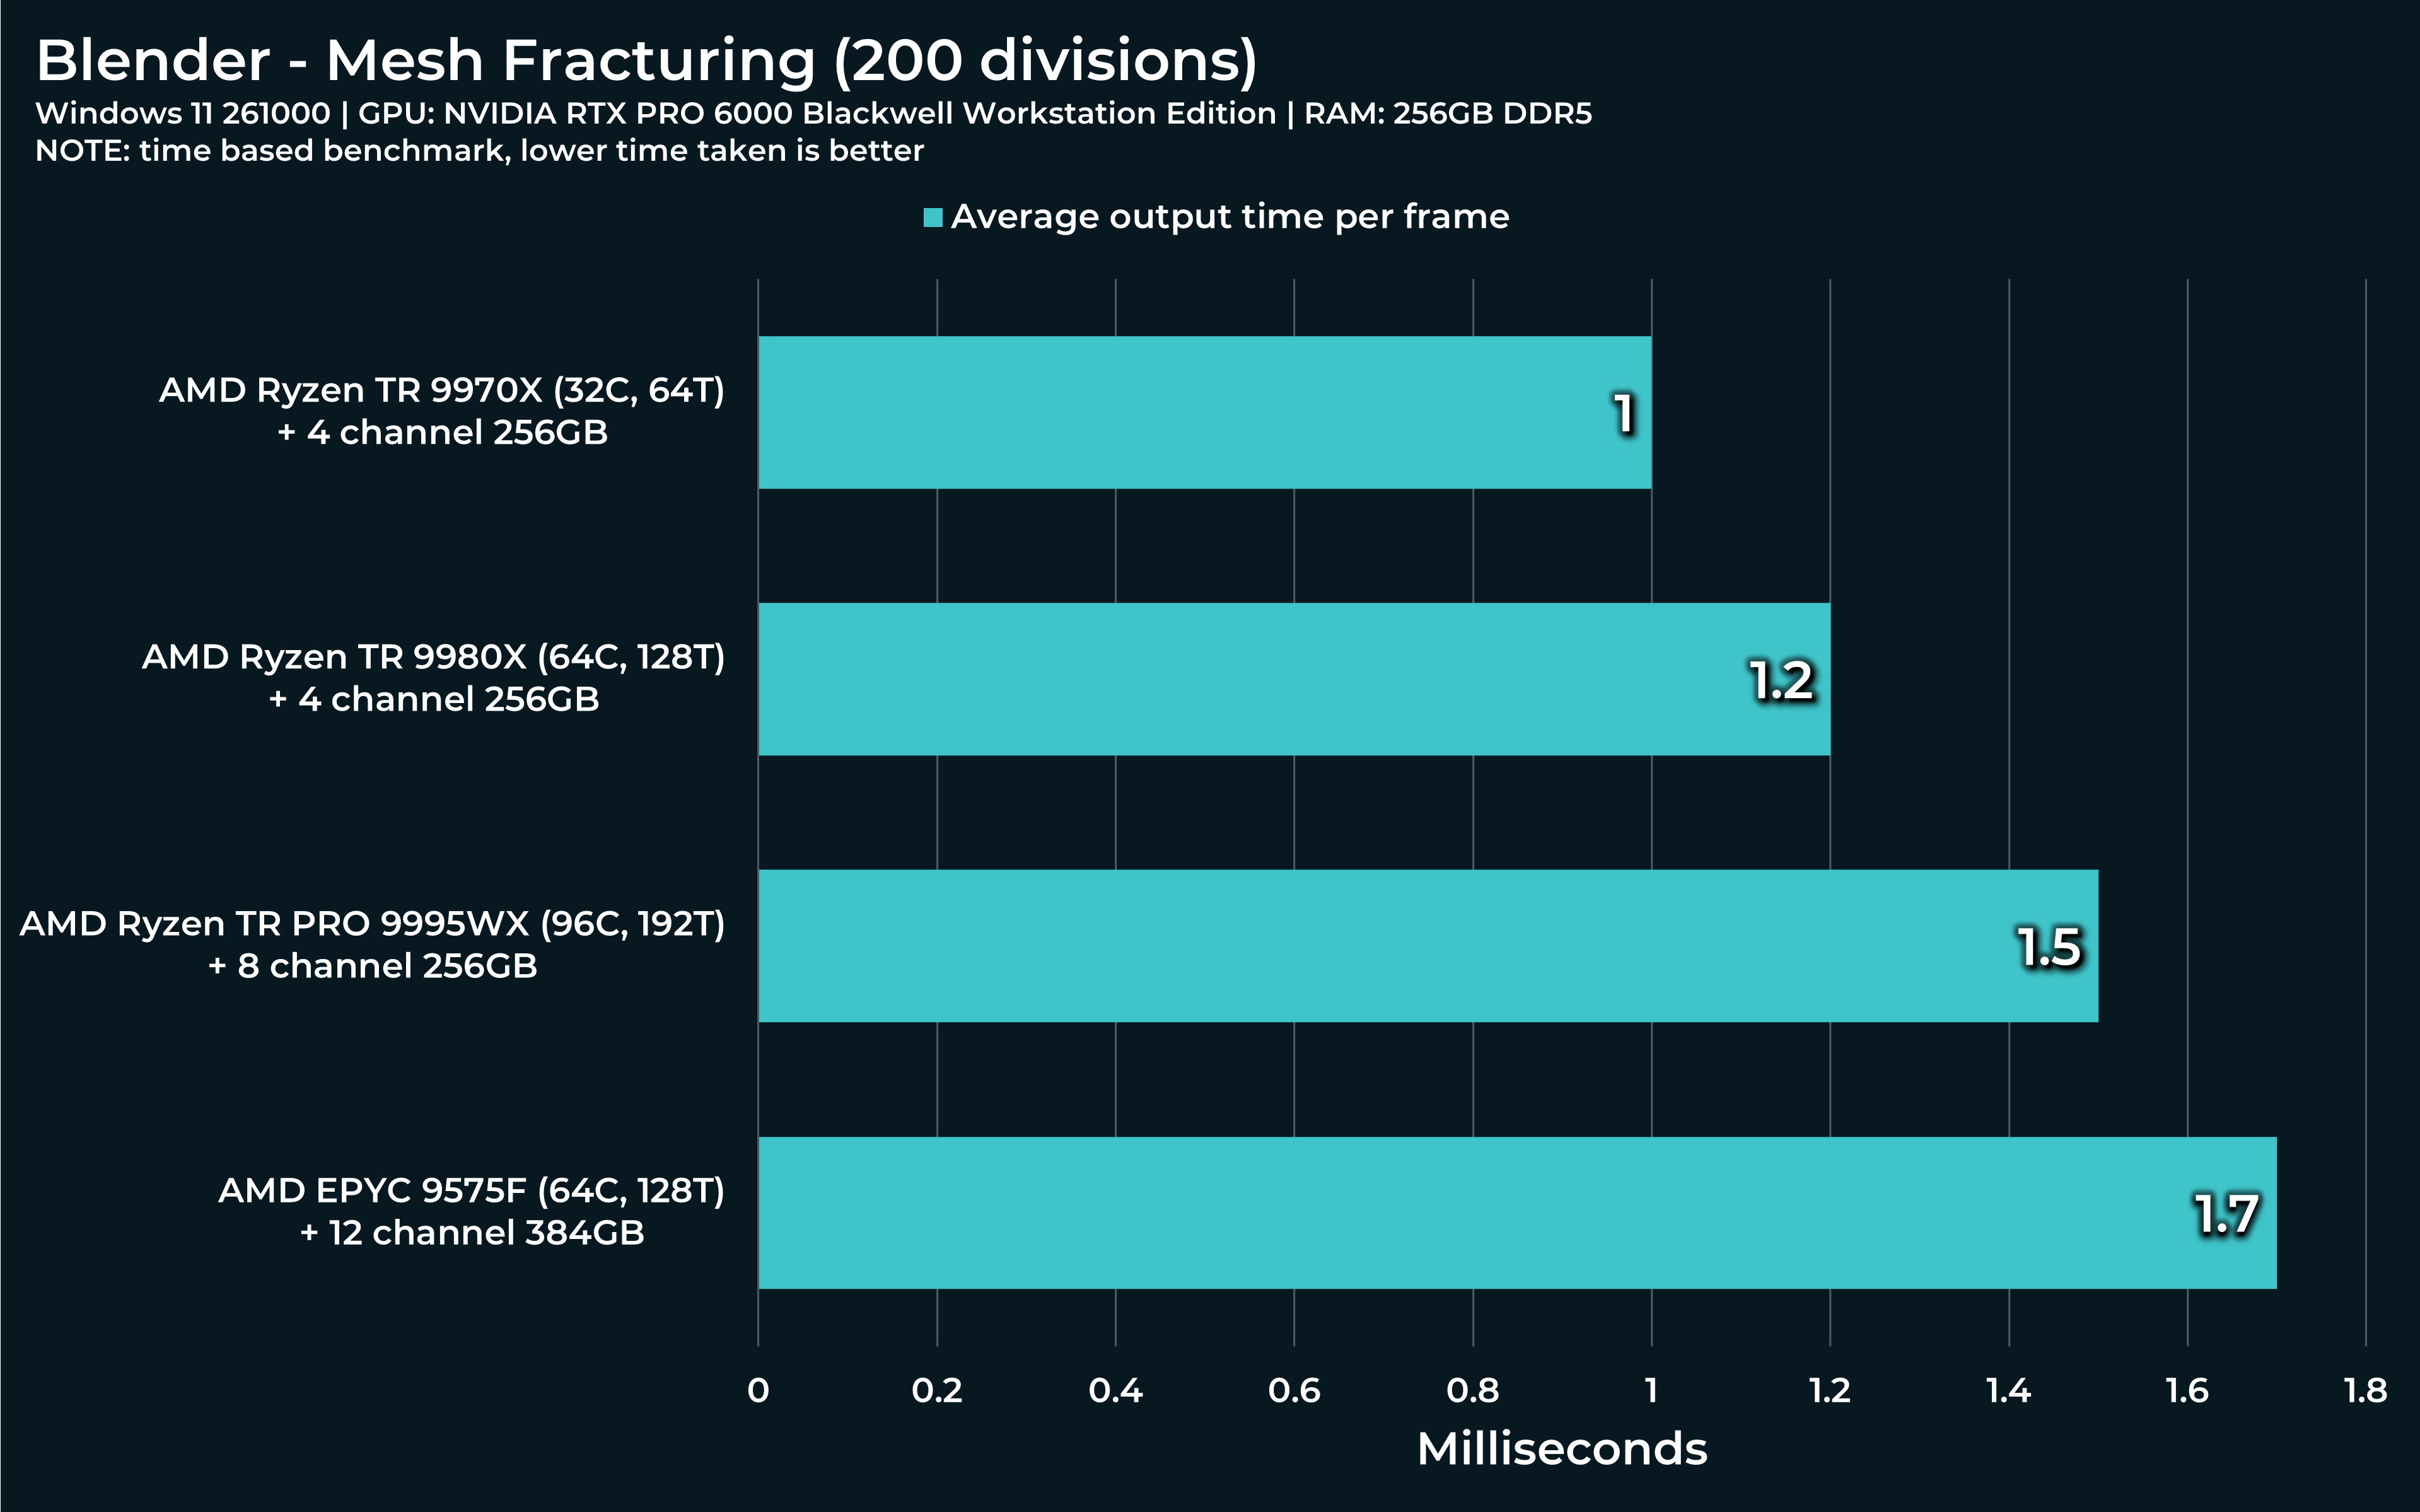
For Mesh fracturing file:

Same procedure, open file, hit spacebar. Only this time, the simulation will also bake during the first run and every subsequent run will run off that baked simulation. But the first one results in a growing CPU performance spike like this one:
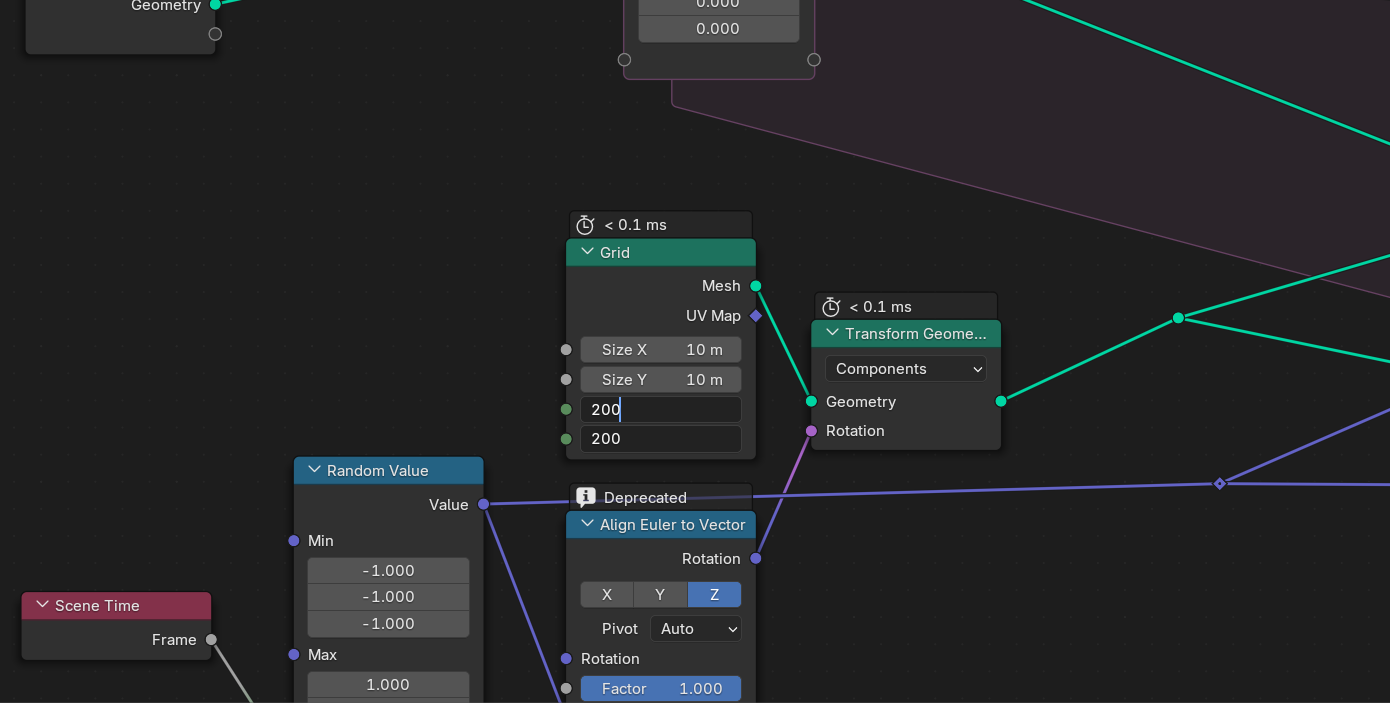
Threadripper will most likely have this curve much lower, but just for science, you can simply crank up subdivision in the Grid node for 2 to 200. Let’s see how Threadripper reacts.
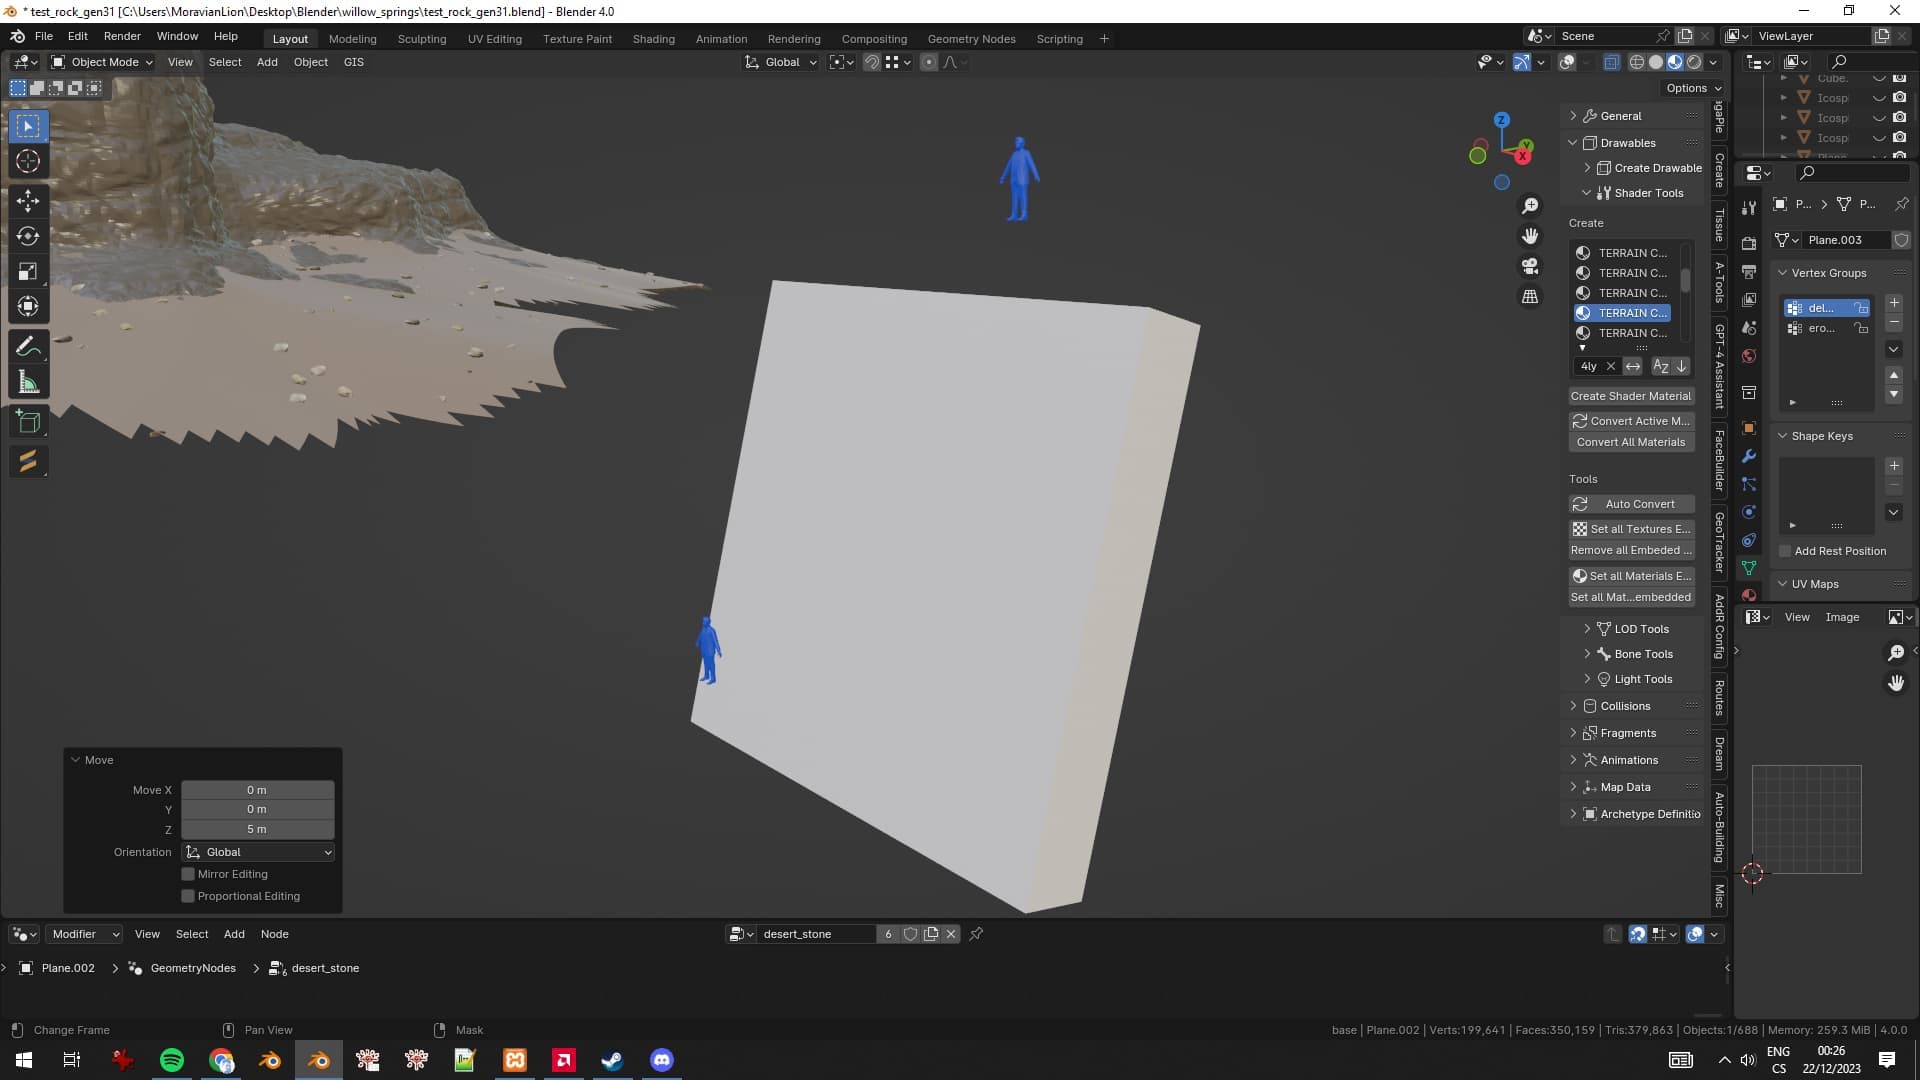
Lastly, my own file I prepared specifically for you.
I prepared several computations based on my own modelling workflow I already demonstrated at the beginning of this thread. To begin the computation, select one of several options from the drop down menu highlighted in purple, the one with default option “None”. You can go one by one to try them out.
Some will only take a few seconds. Some might take up to several minutes and push close to 200Gb RAM.
Besides total computational time, I also wrote down individual nodes’ times, in case you’d feel like writing them down as well for me or anyone else reading this thread. Those nodes in question are highlighted in teal and yellow colors. 2 of those computations rely on 2 heavy node calculations. To made them more clear to see, I used teal.
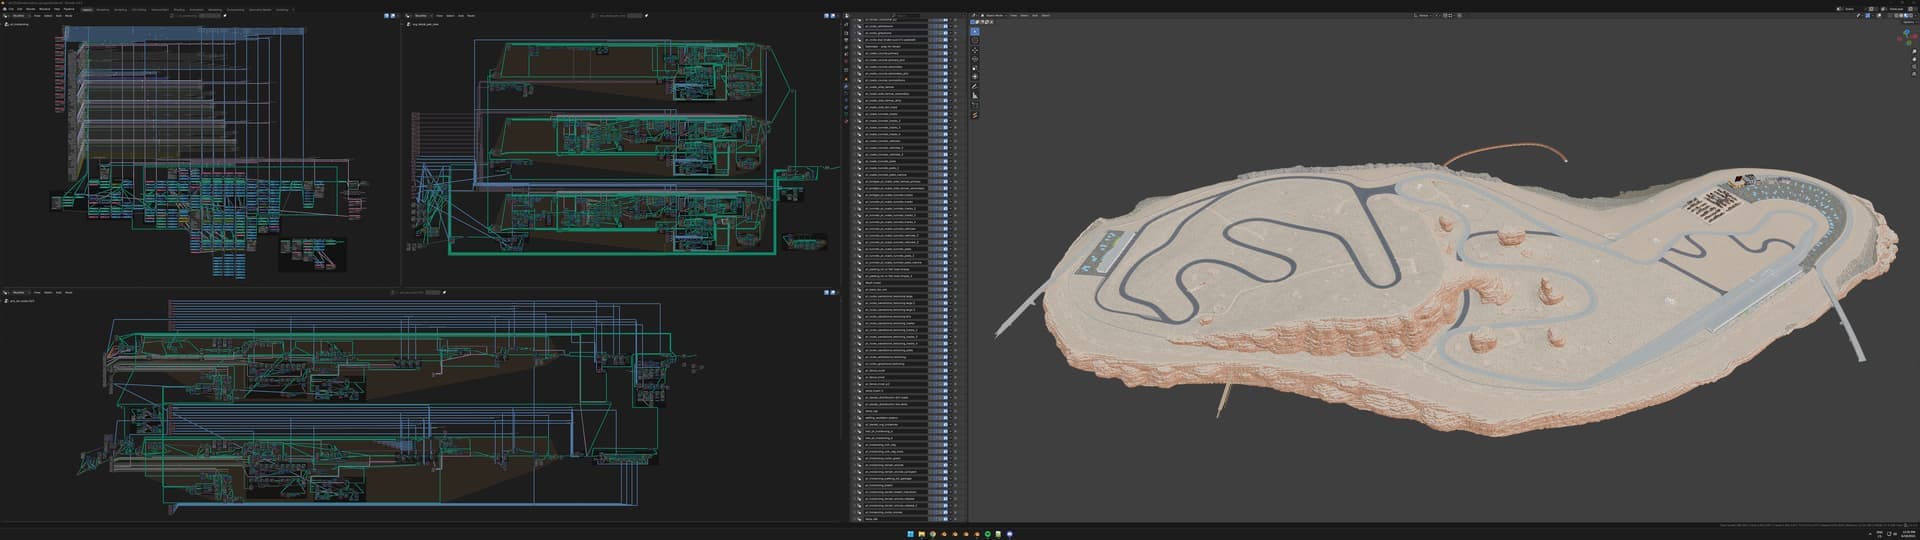
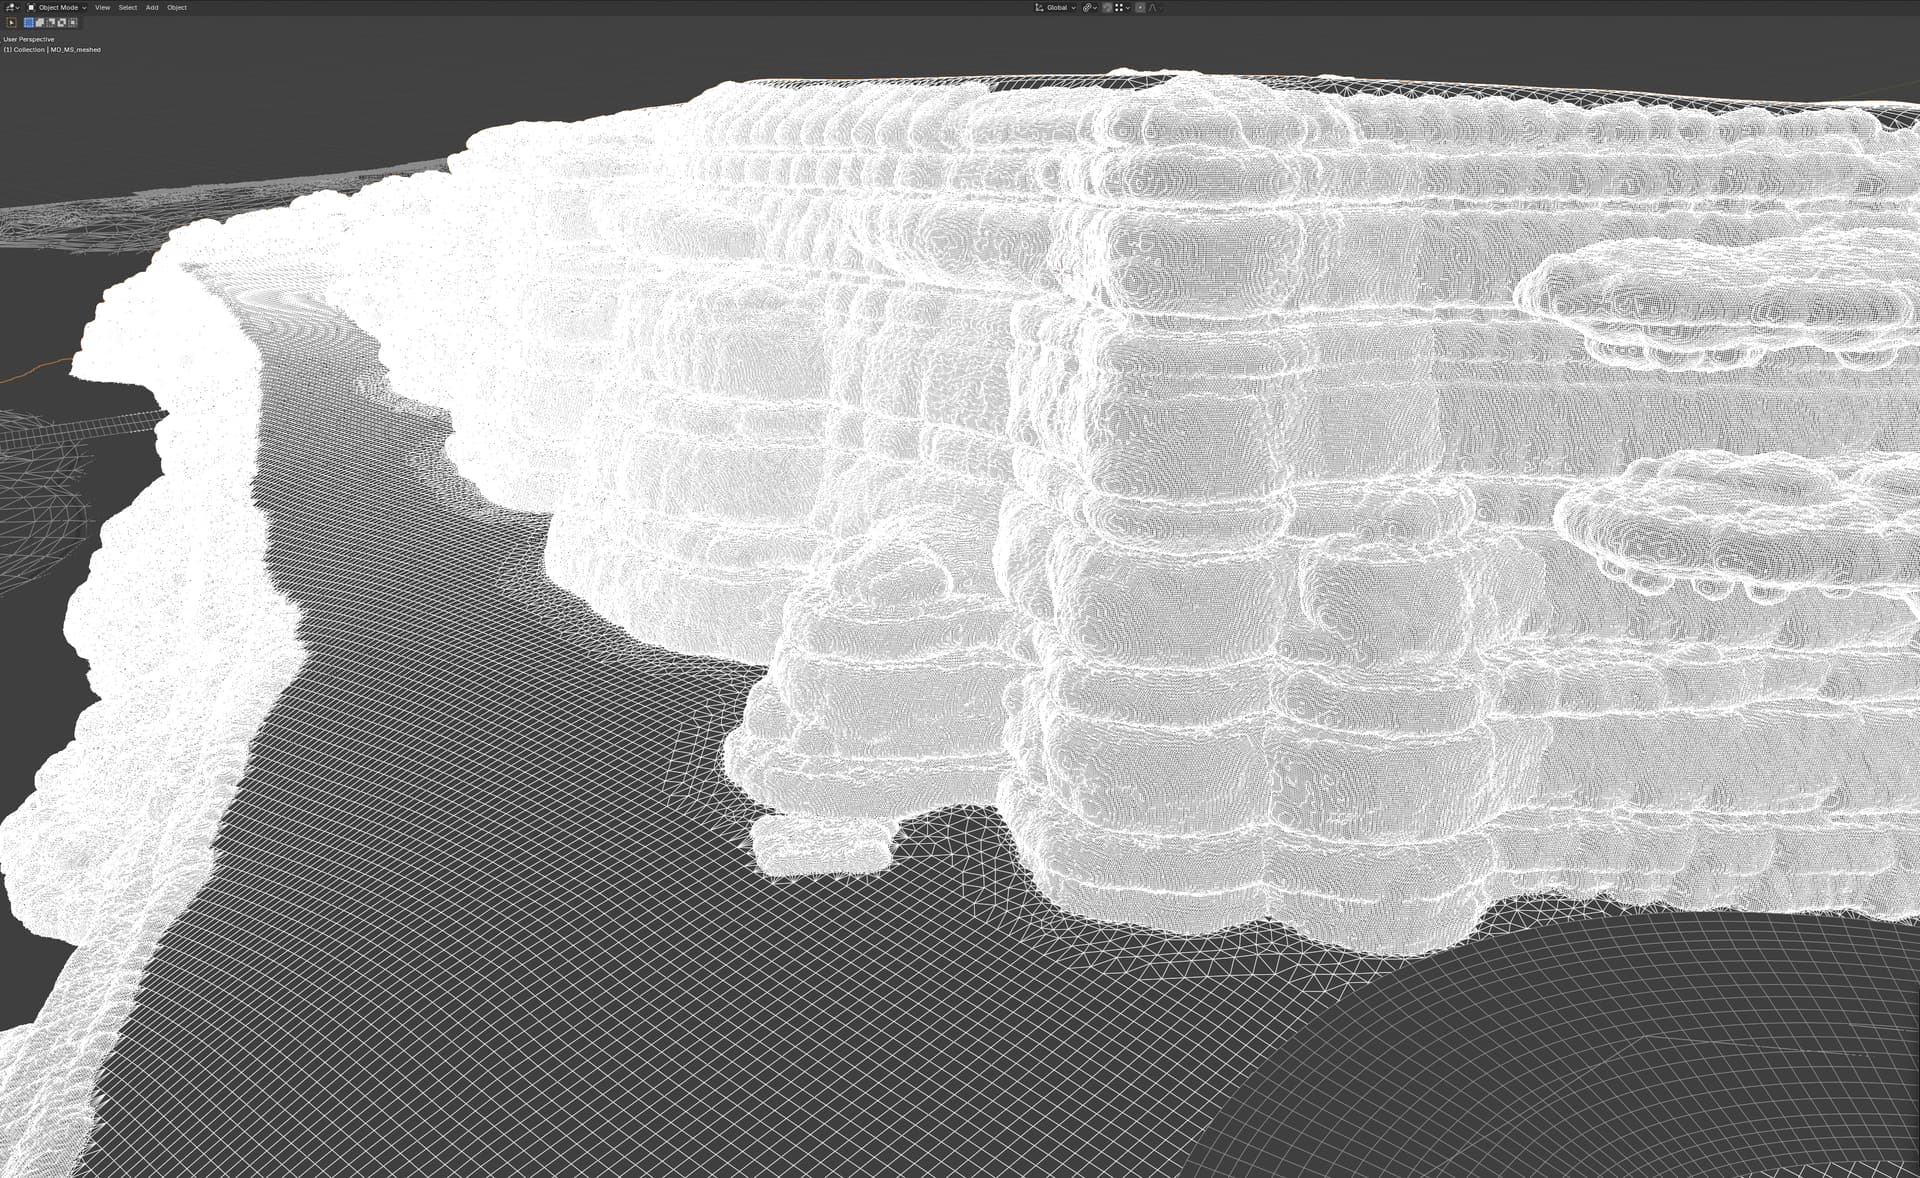
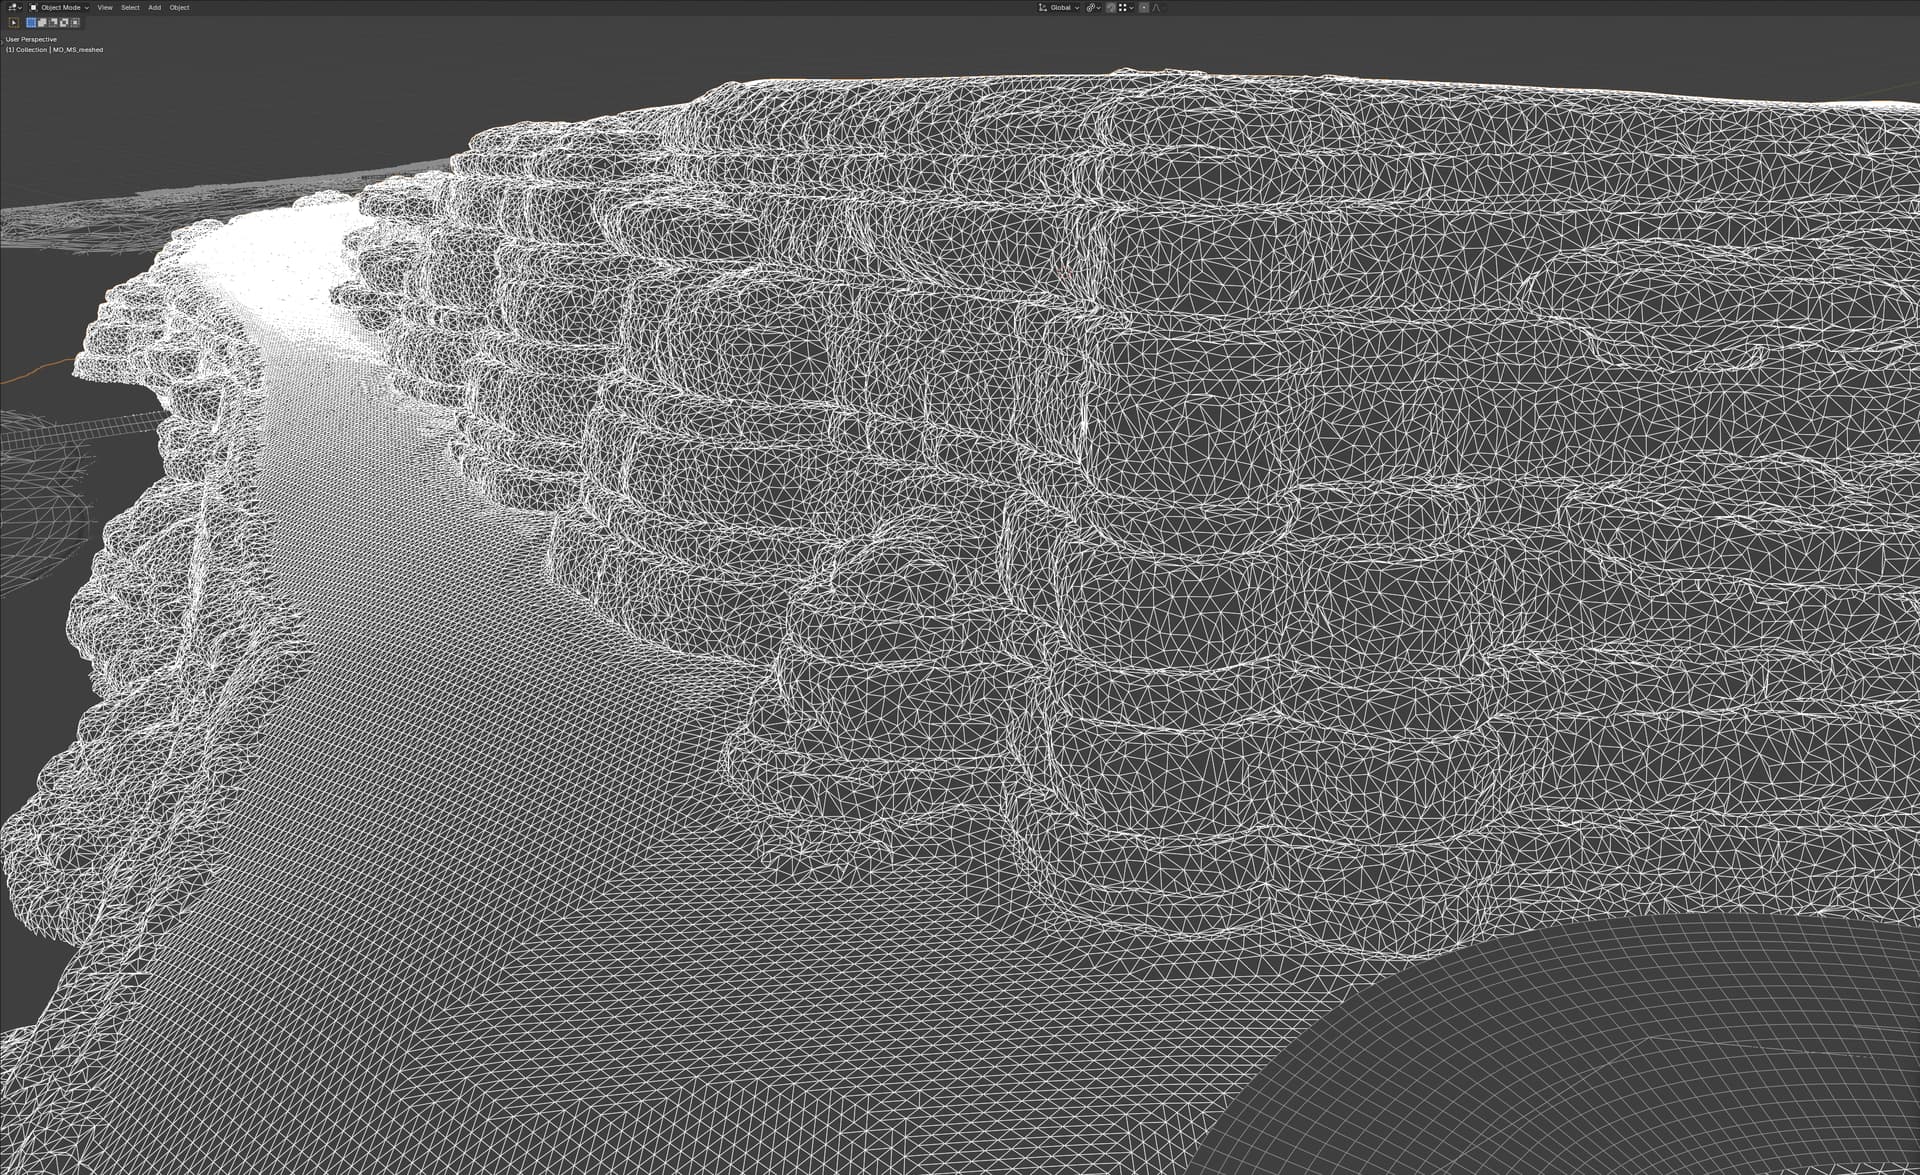
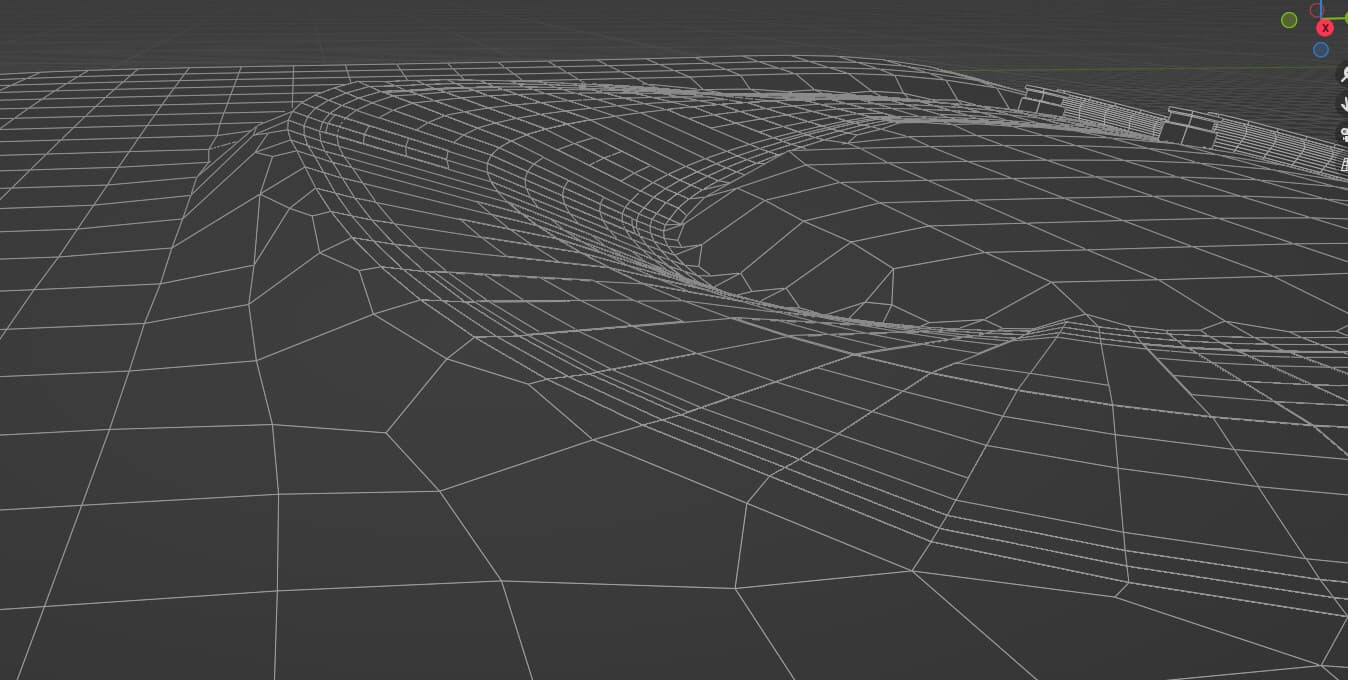
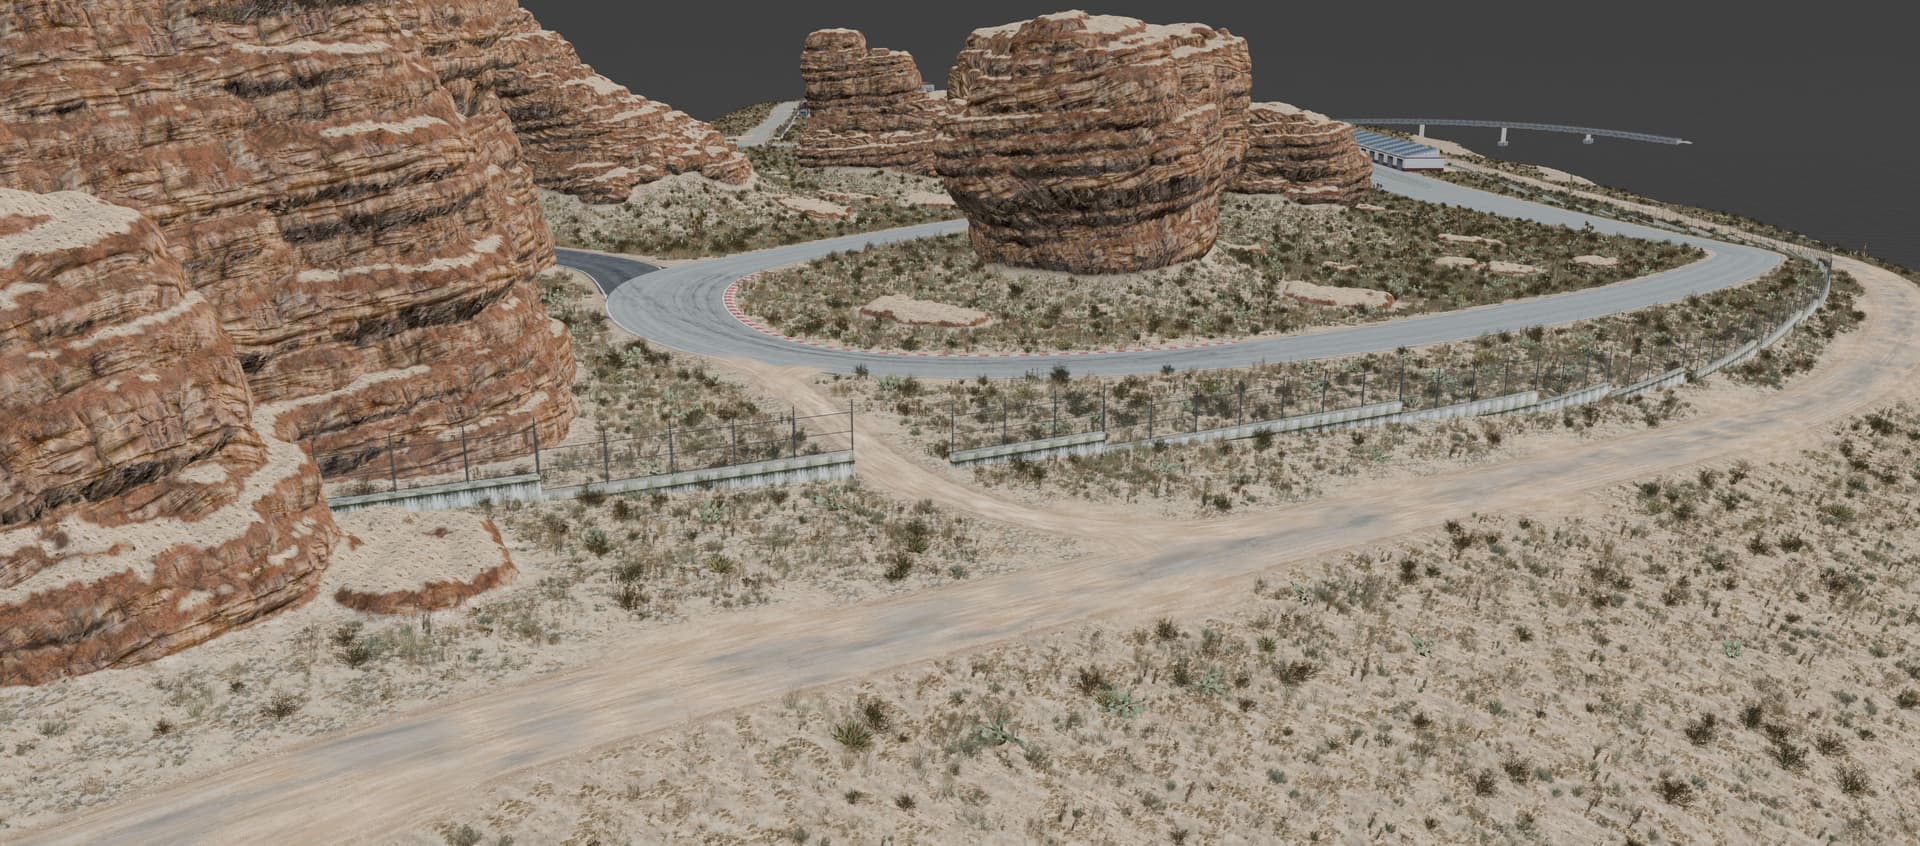
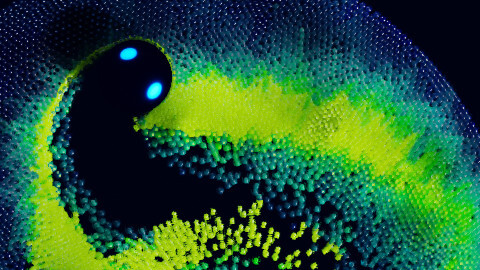
There’s not much to show off visually, because I wanted to keep as uniform scaling as possible when preparing this file. So, not as interesting to look at as previous examples. But definitely the most valuable in my eyes  .
.
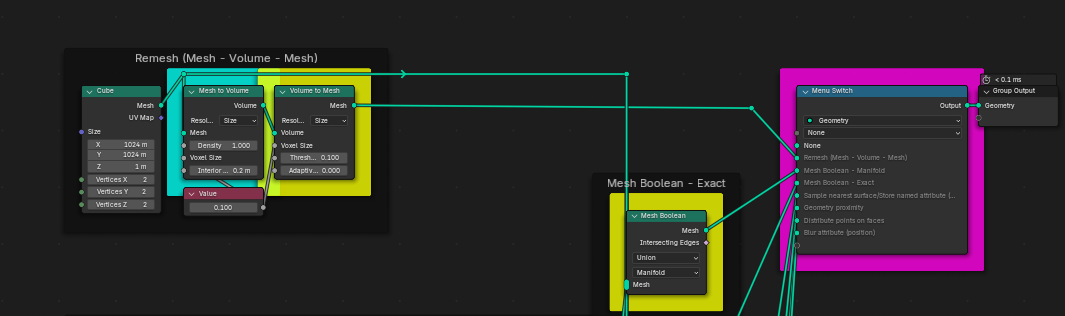
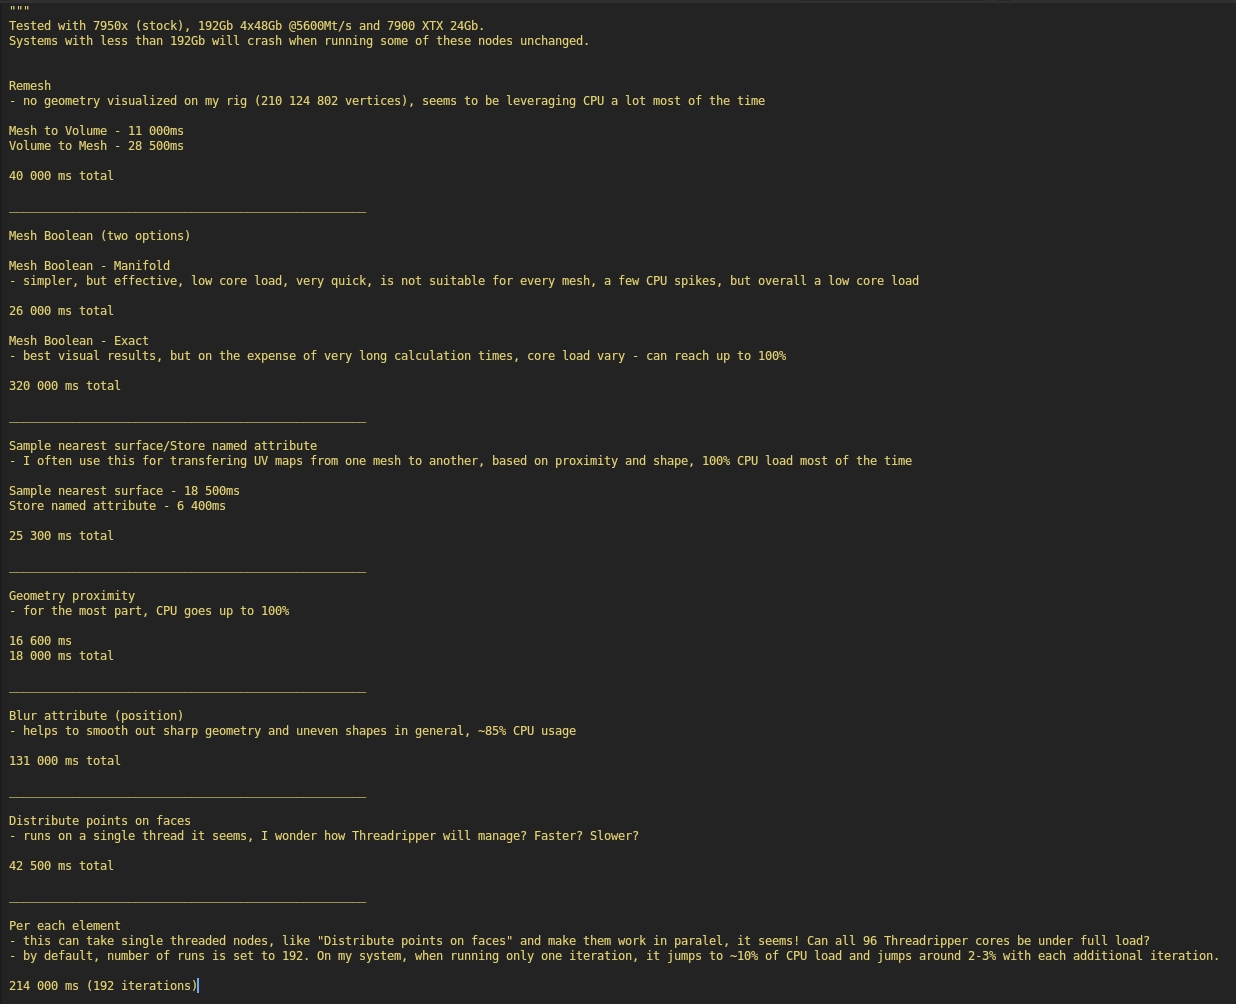
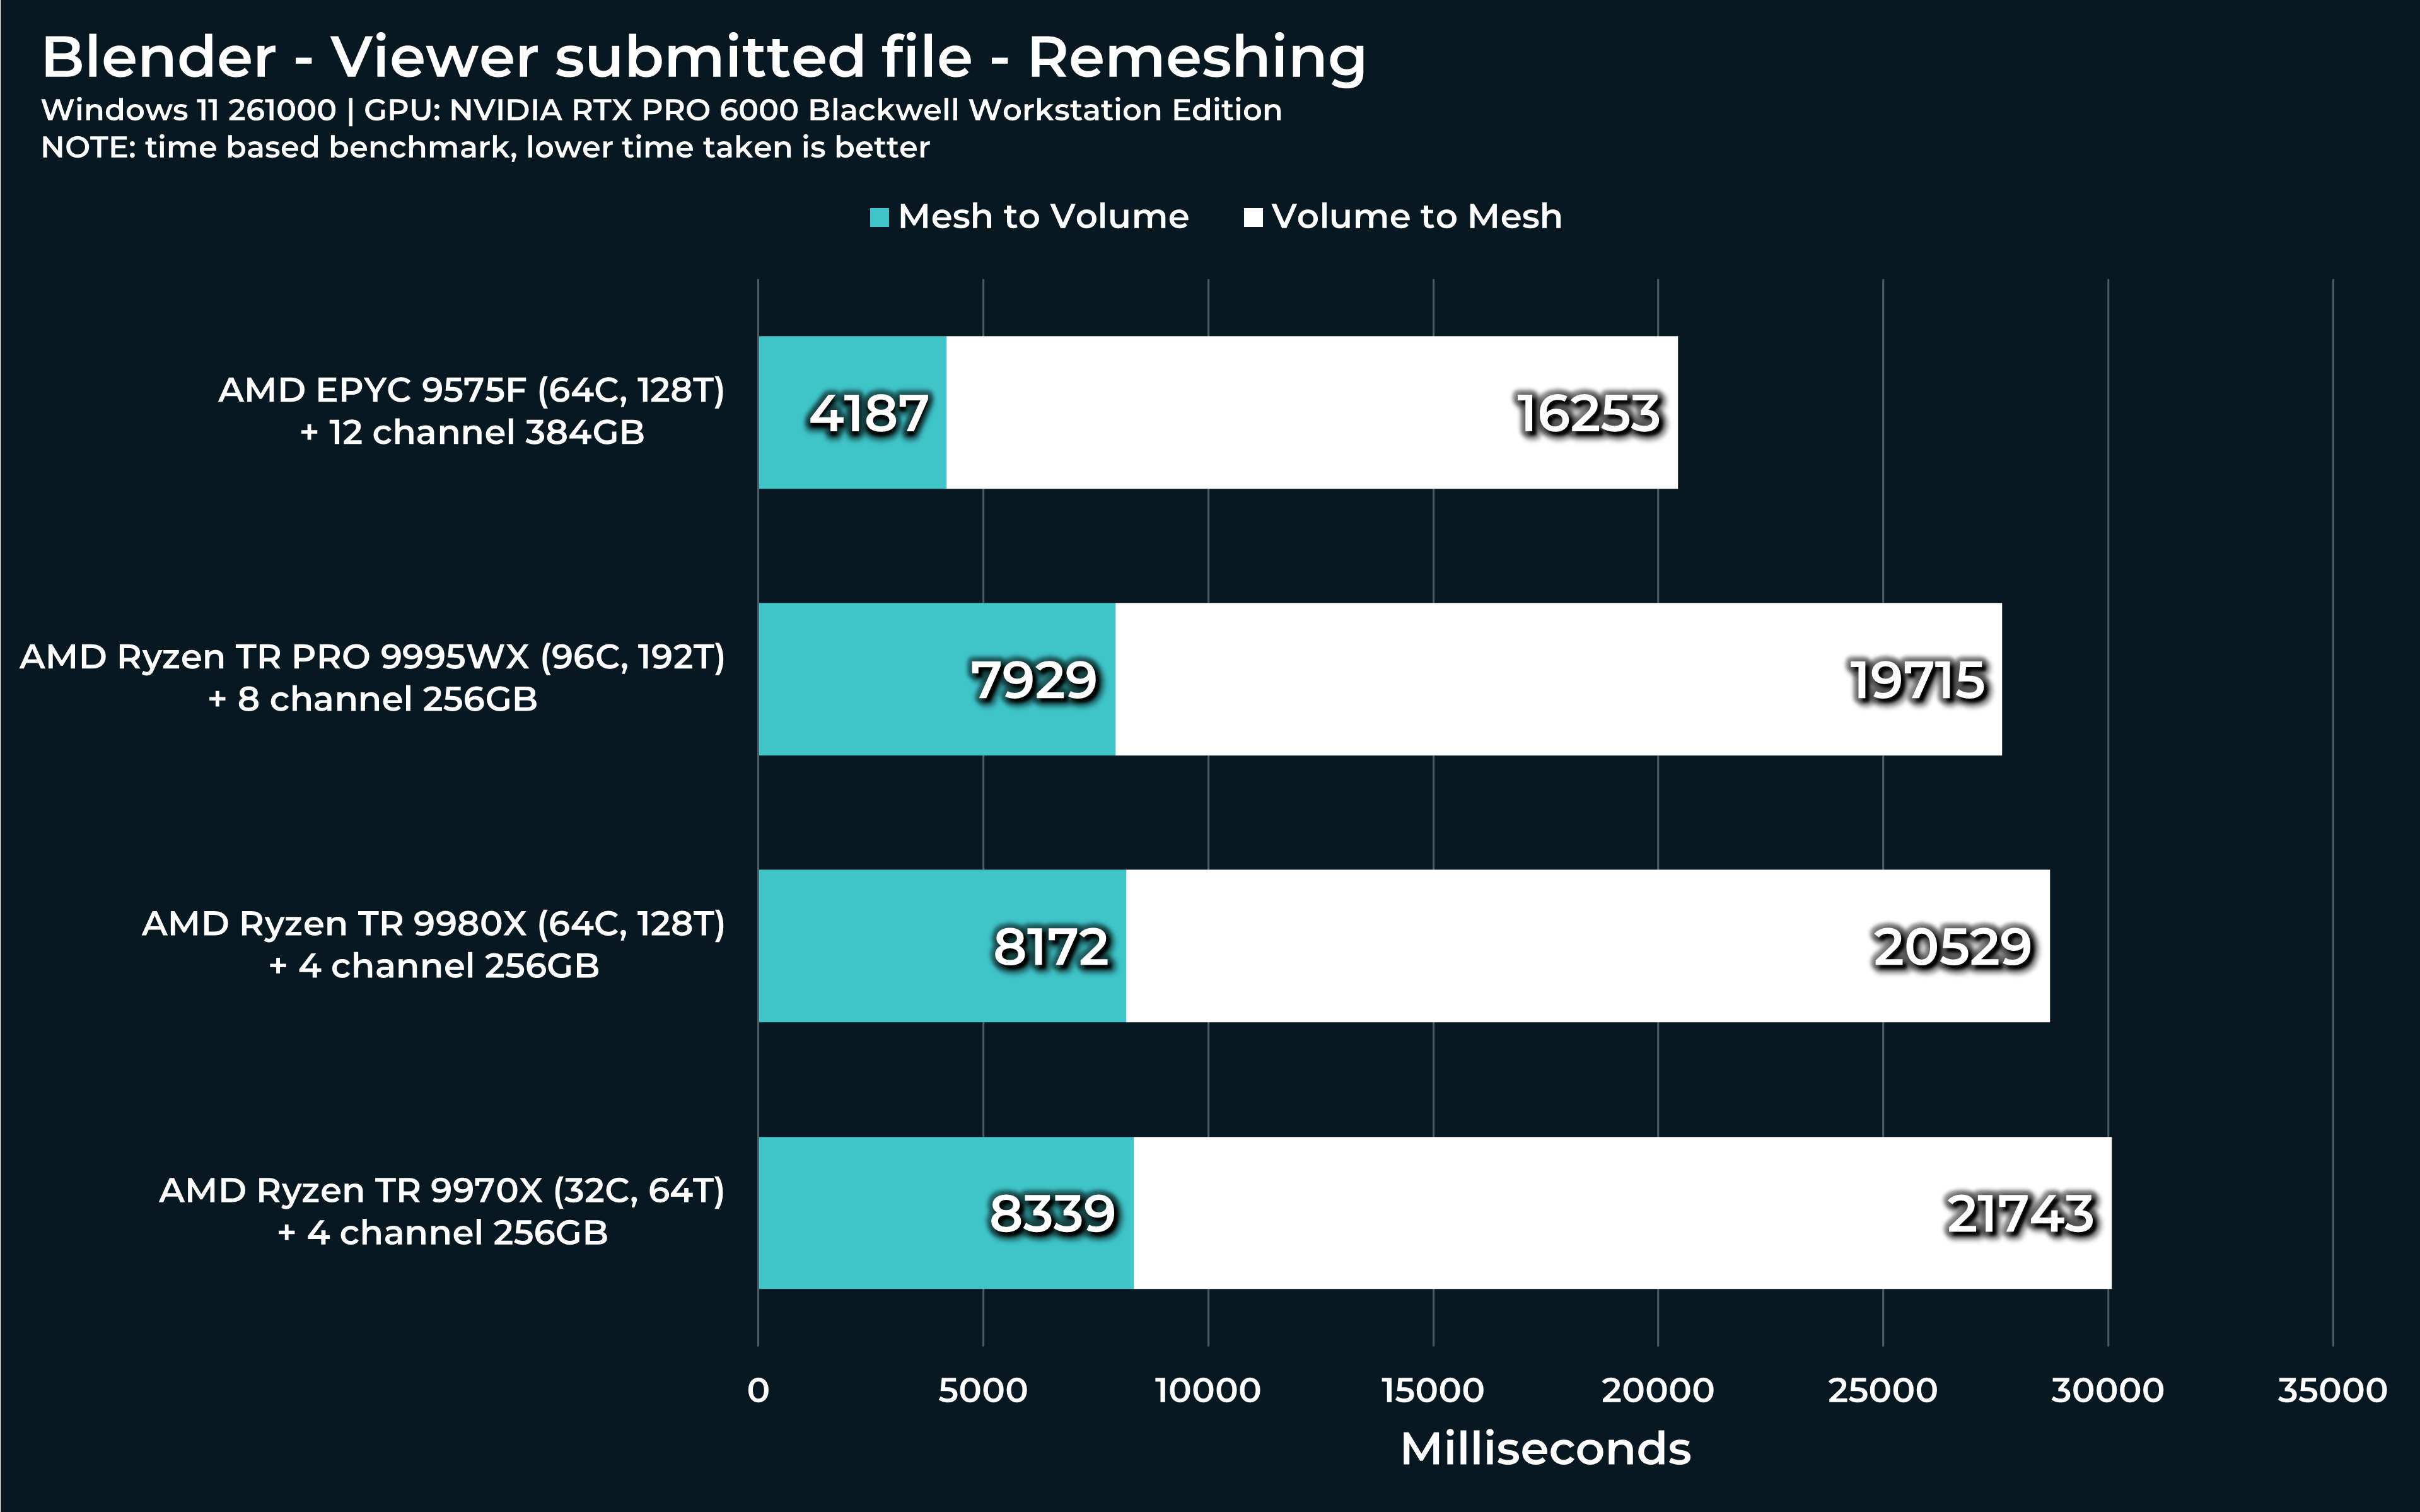
For example, first “Remesh” calculation generates excessively large amount of geometry, specifically 210 124 802 vertices and my system is unable (or gives up) to render it. I wonder, if your system will be able to or if this is Blender’s own limitation. Please, let me know, if it renders all that geometry for you or not. And computational time, of course.
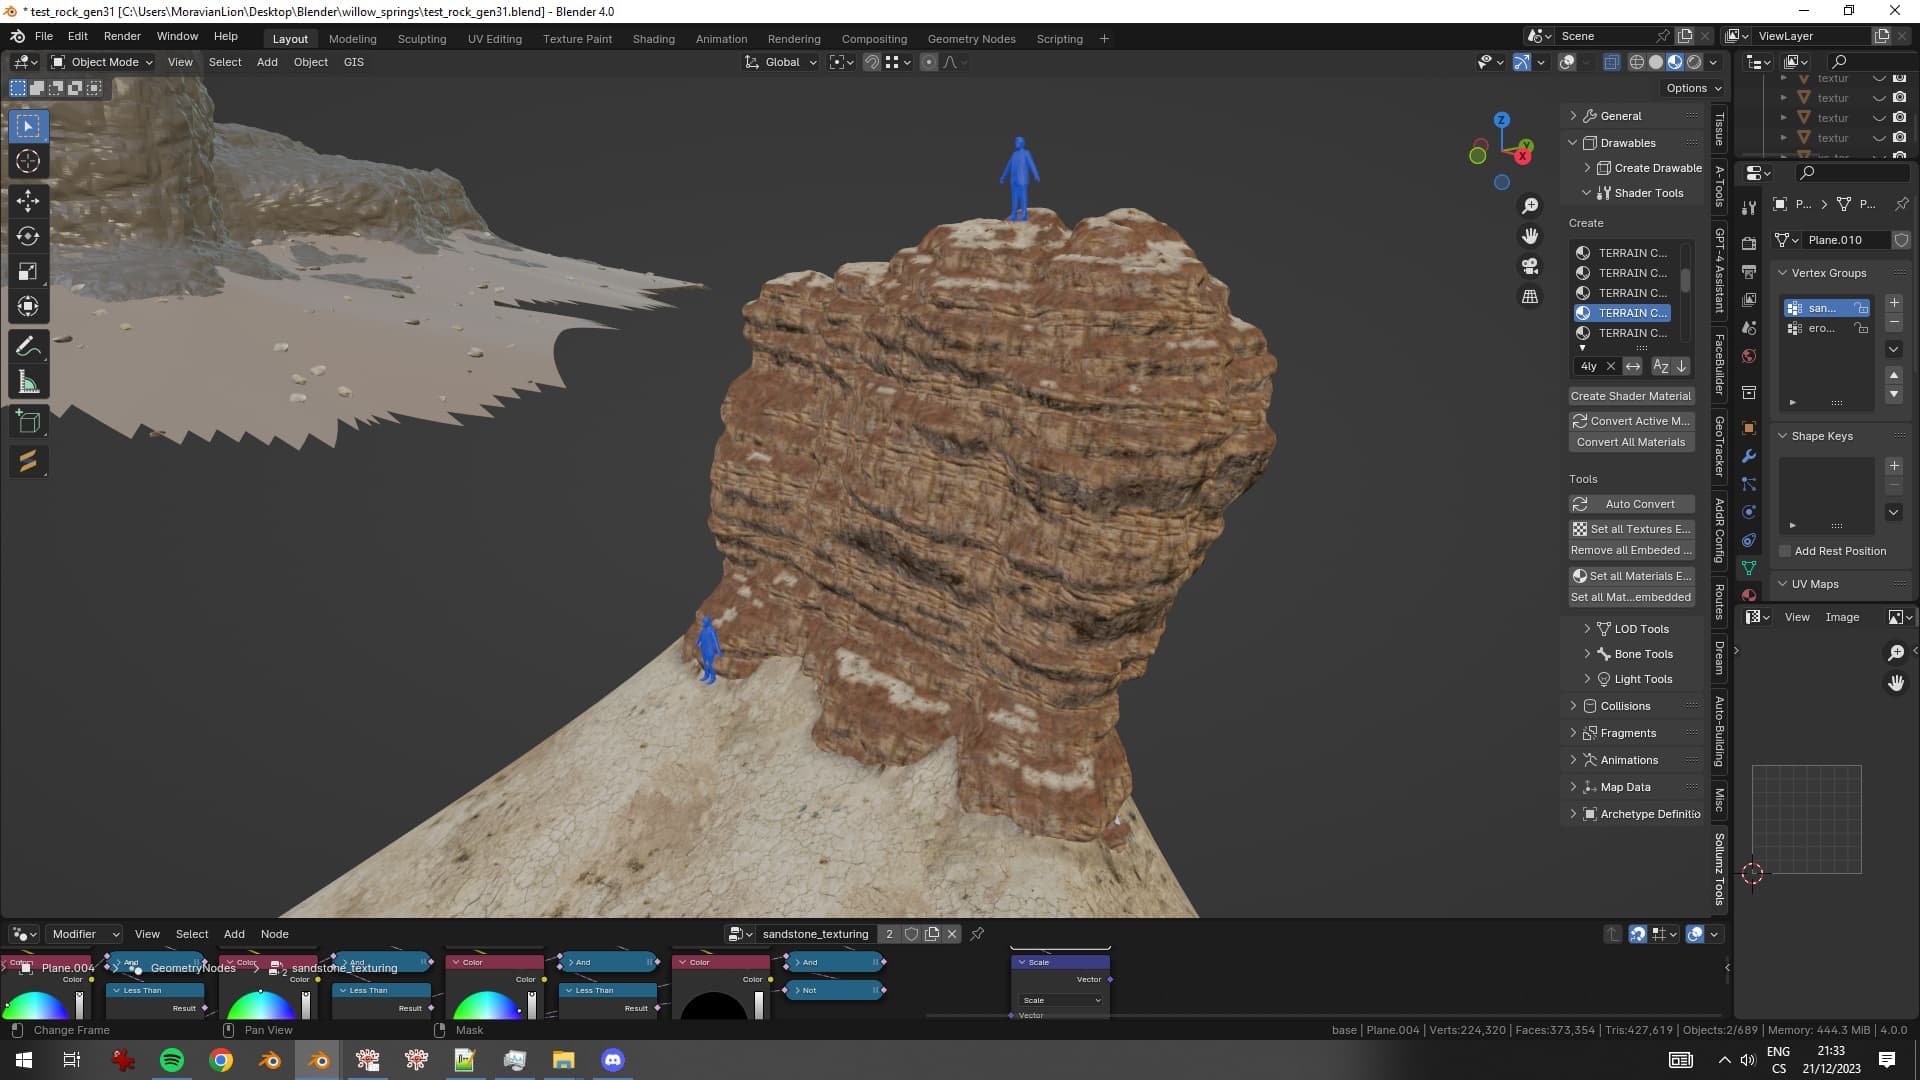
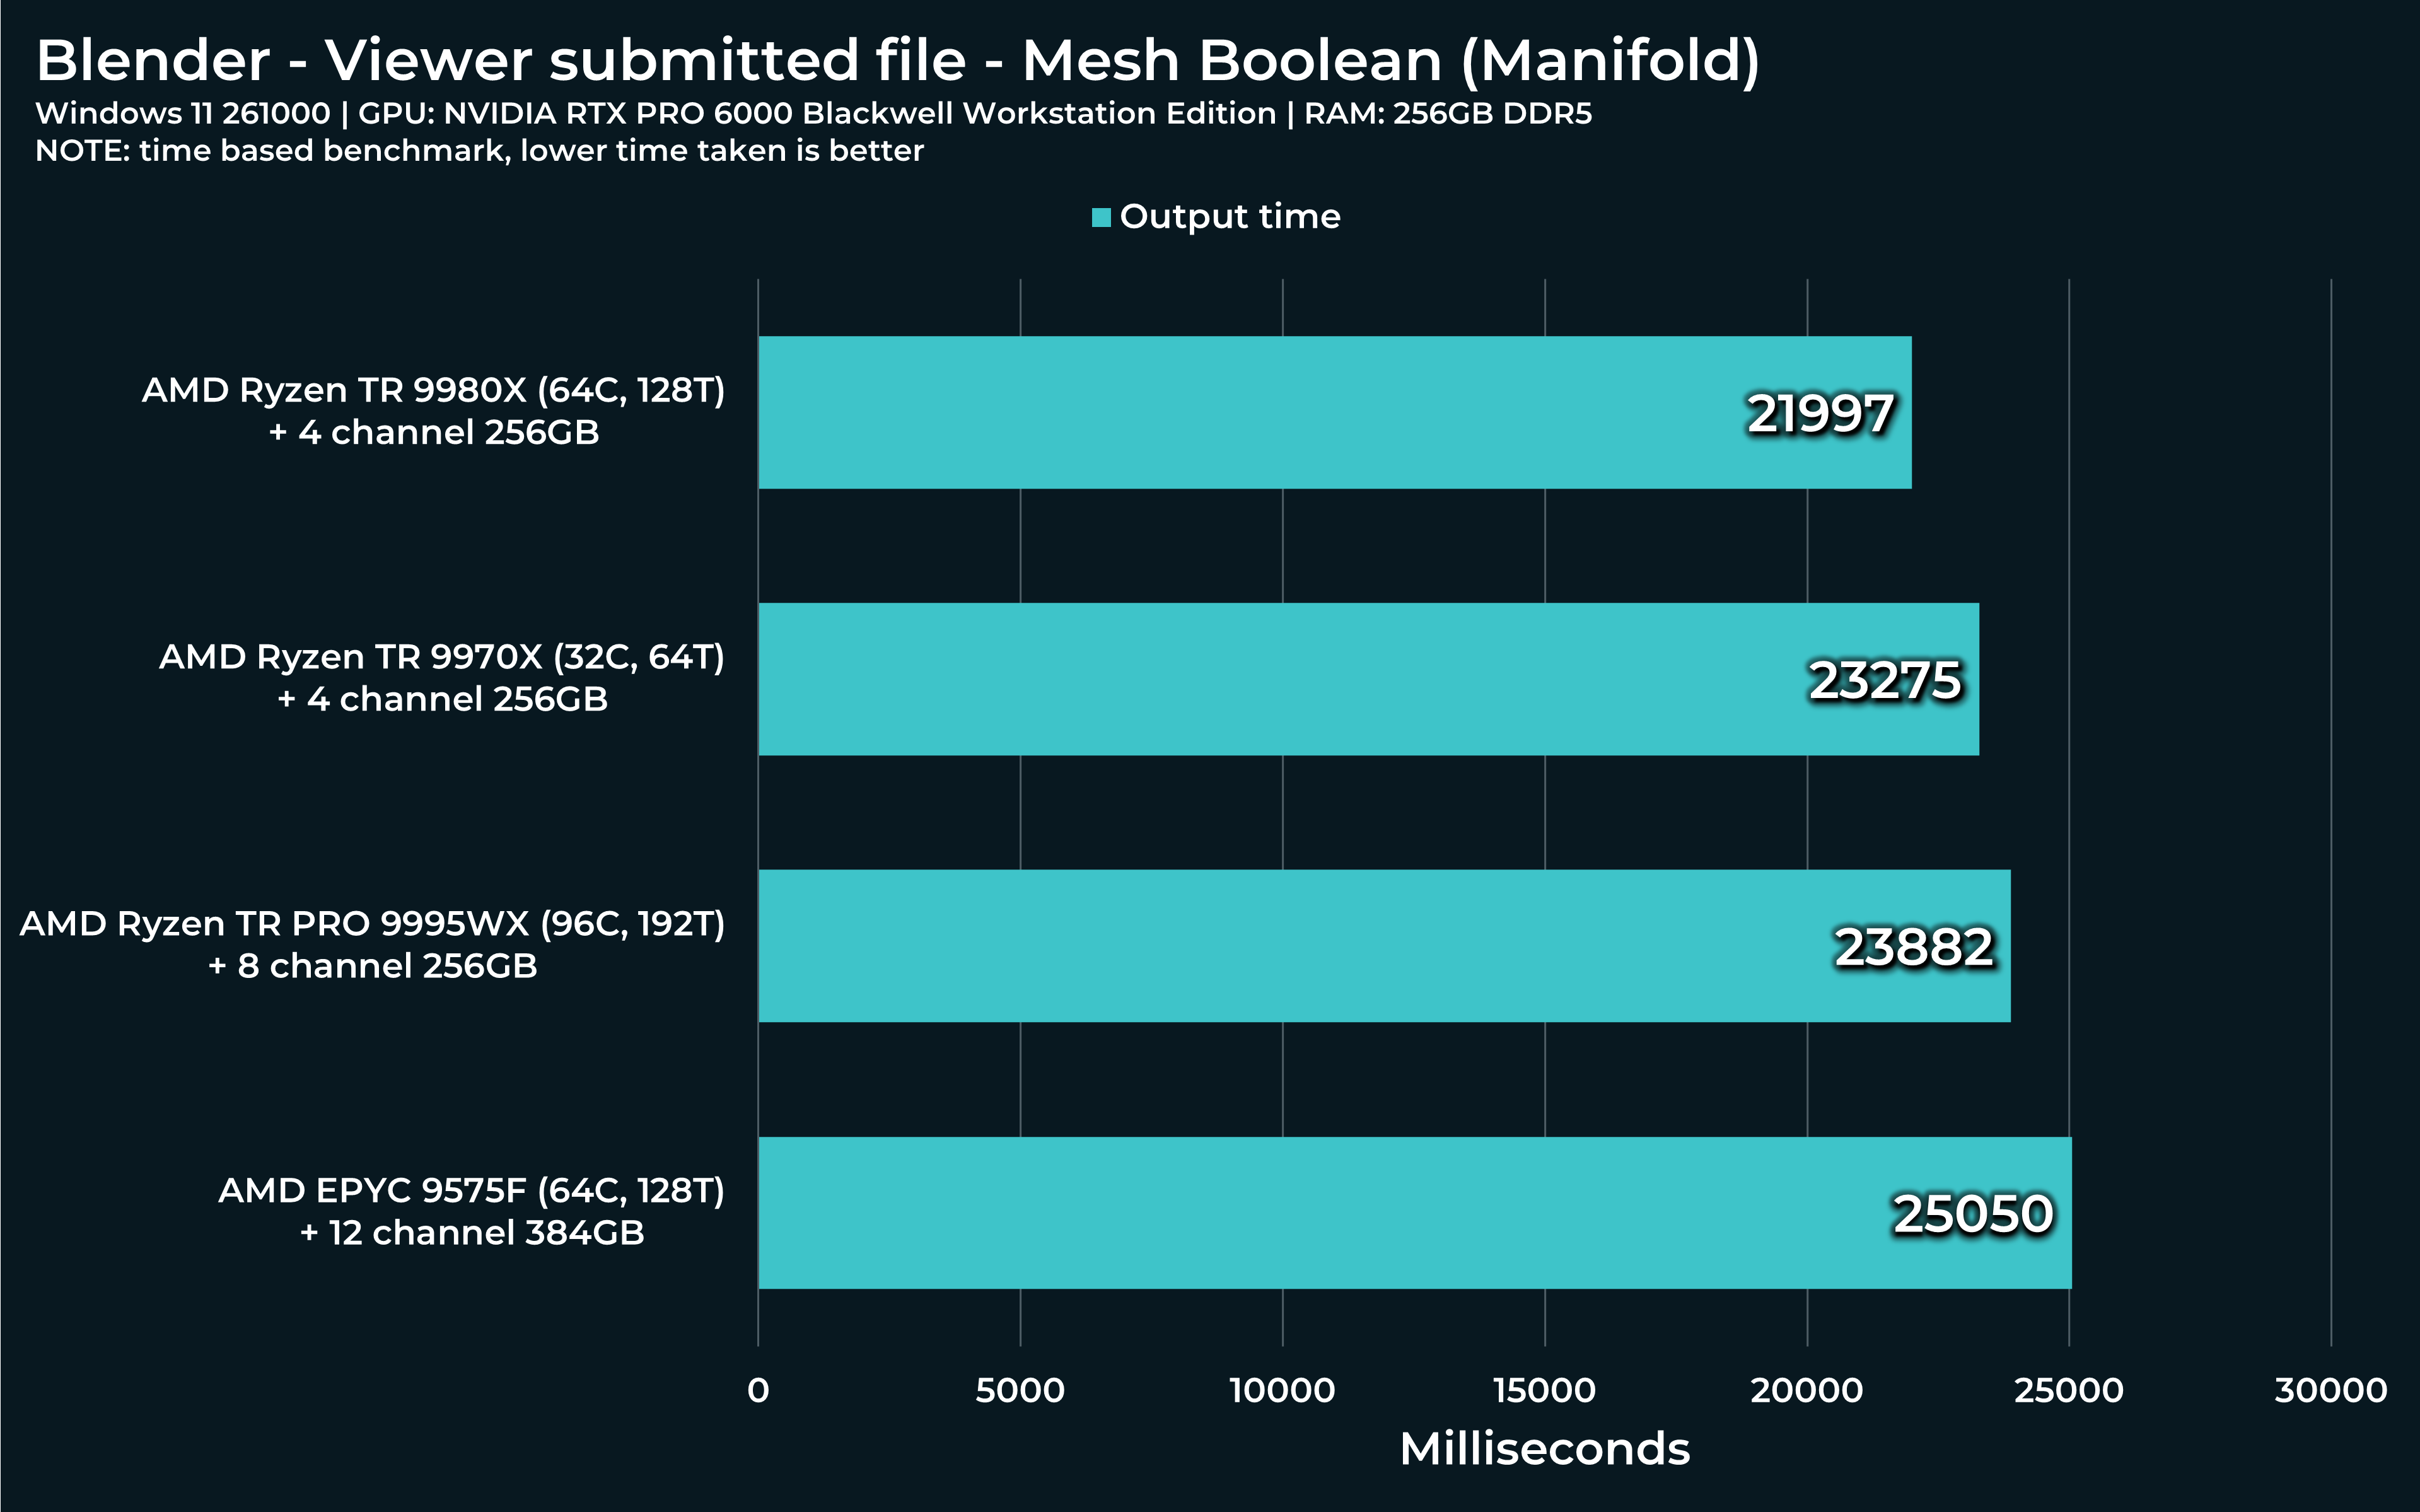
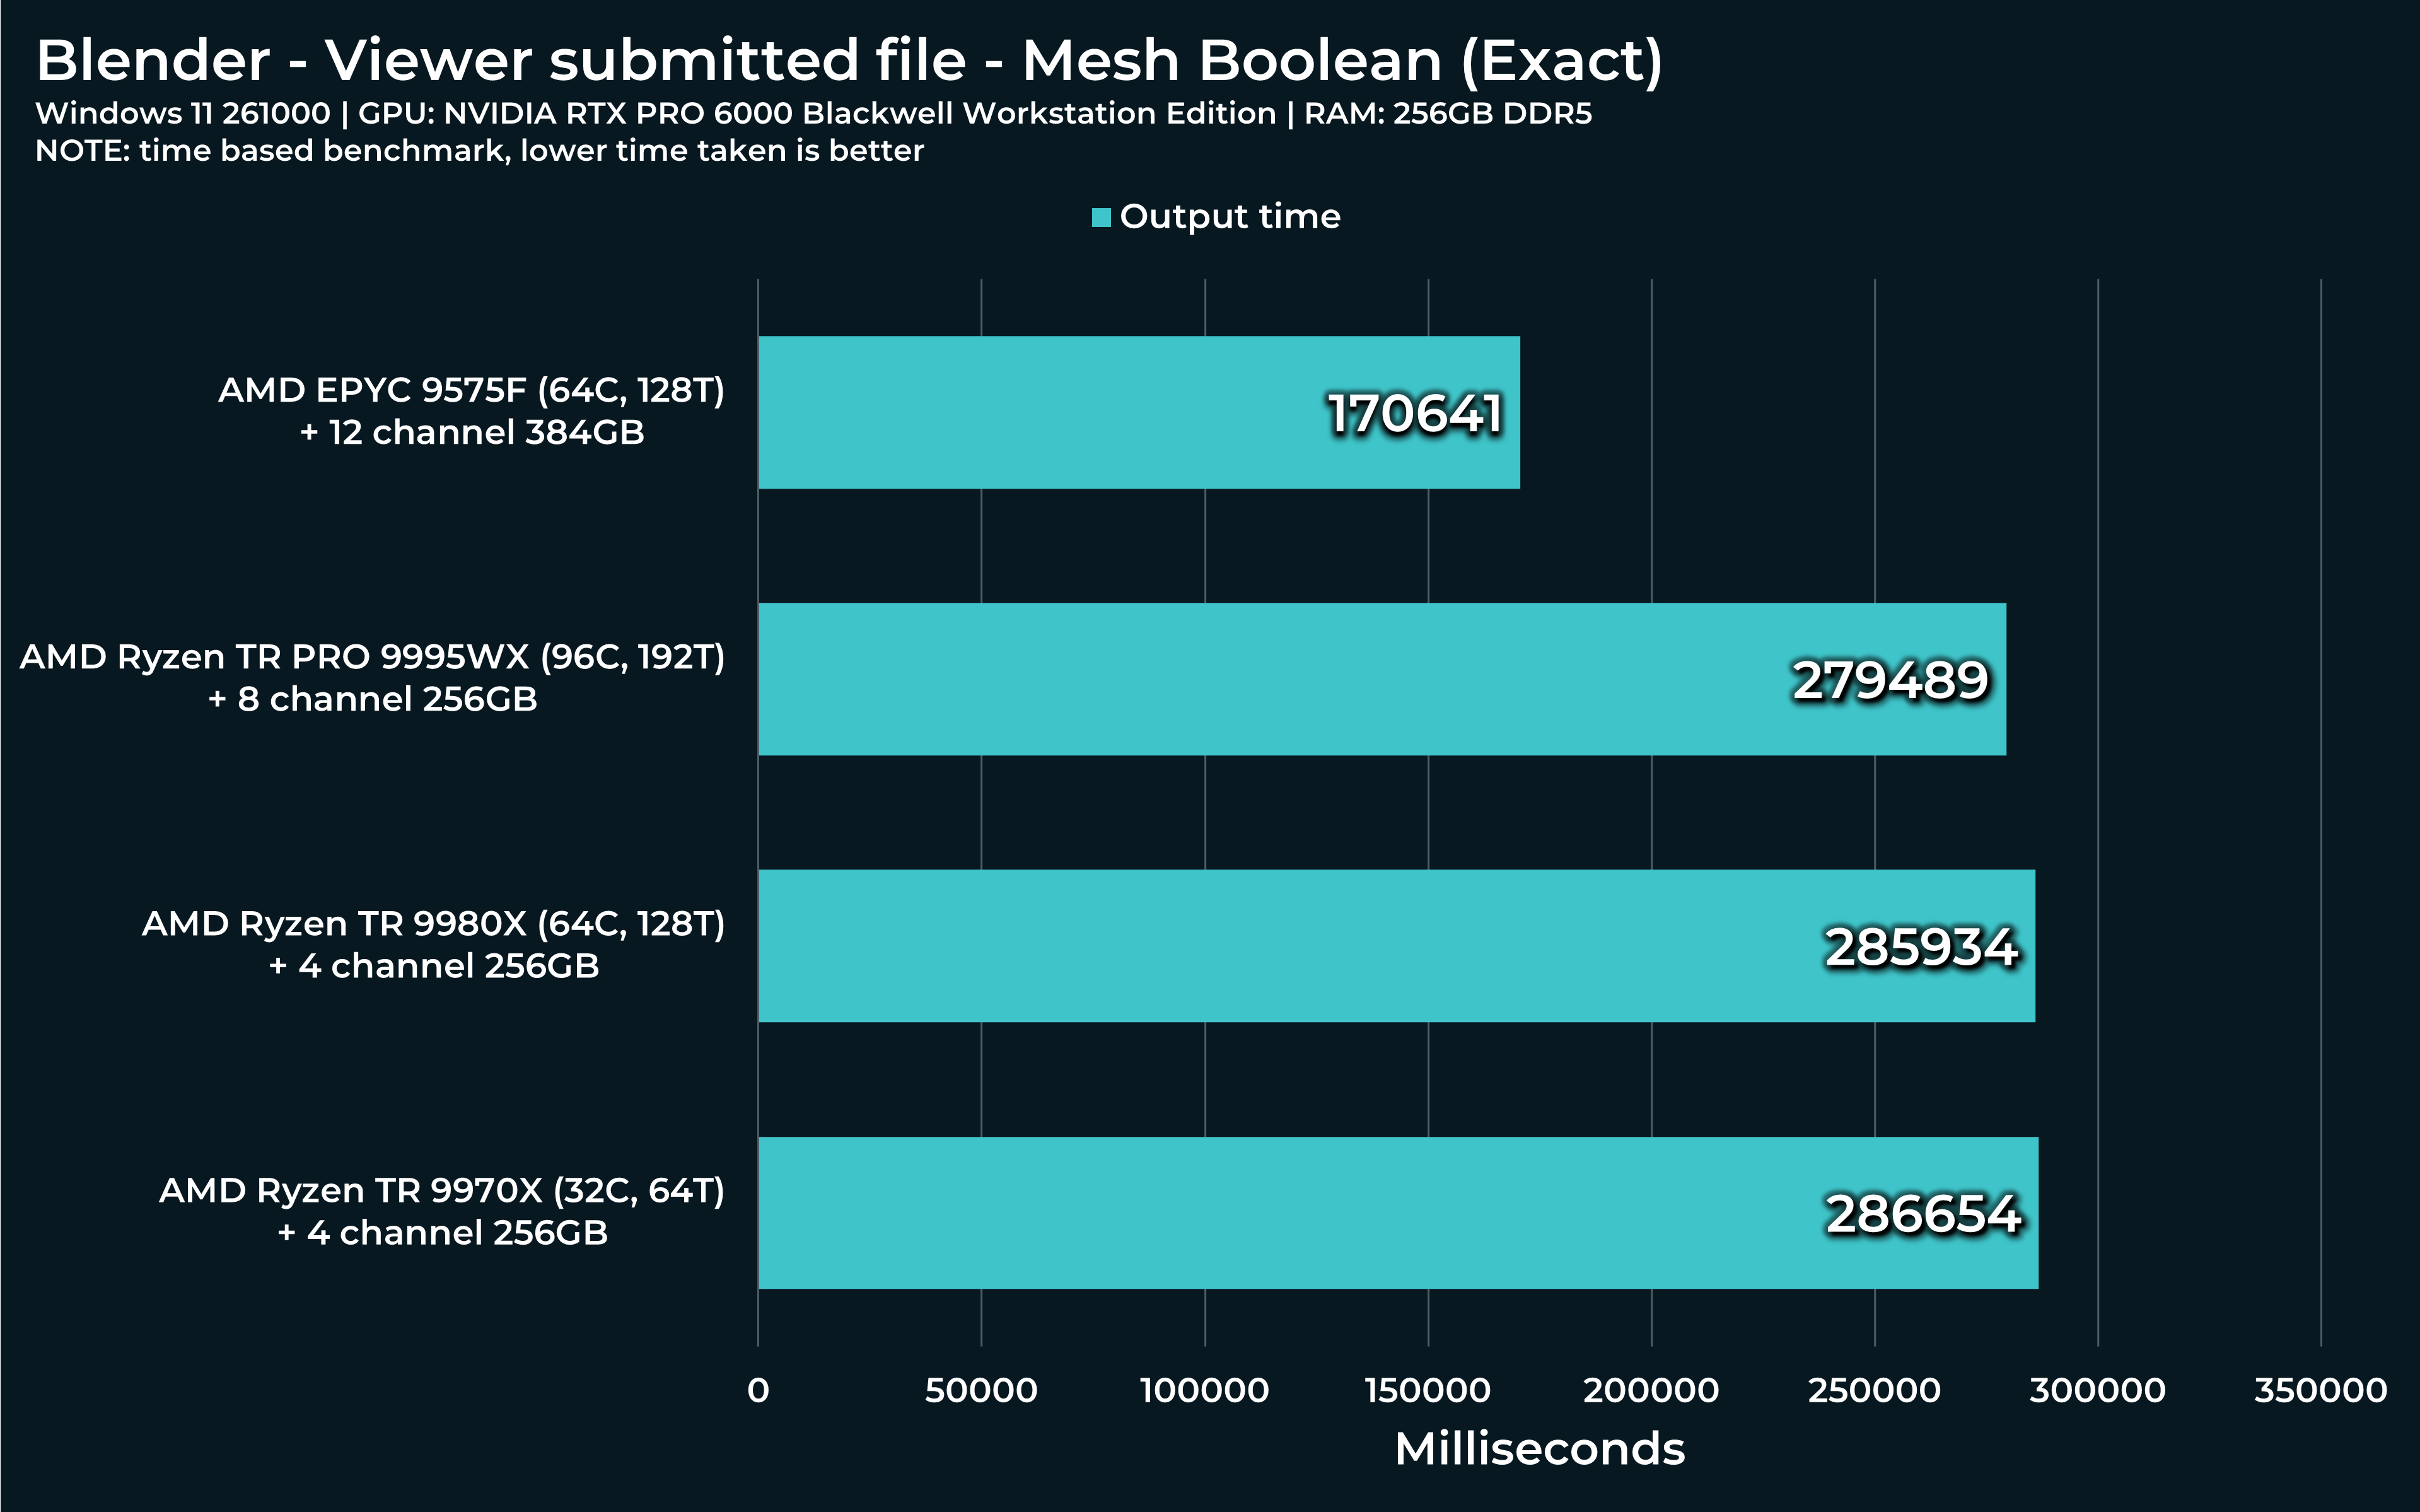
Next two “Mesh boolean” calculations consist of “Manifold” and “Exact” variants. First is very fast (and new) and other… Very slow, but precise.
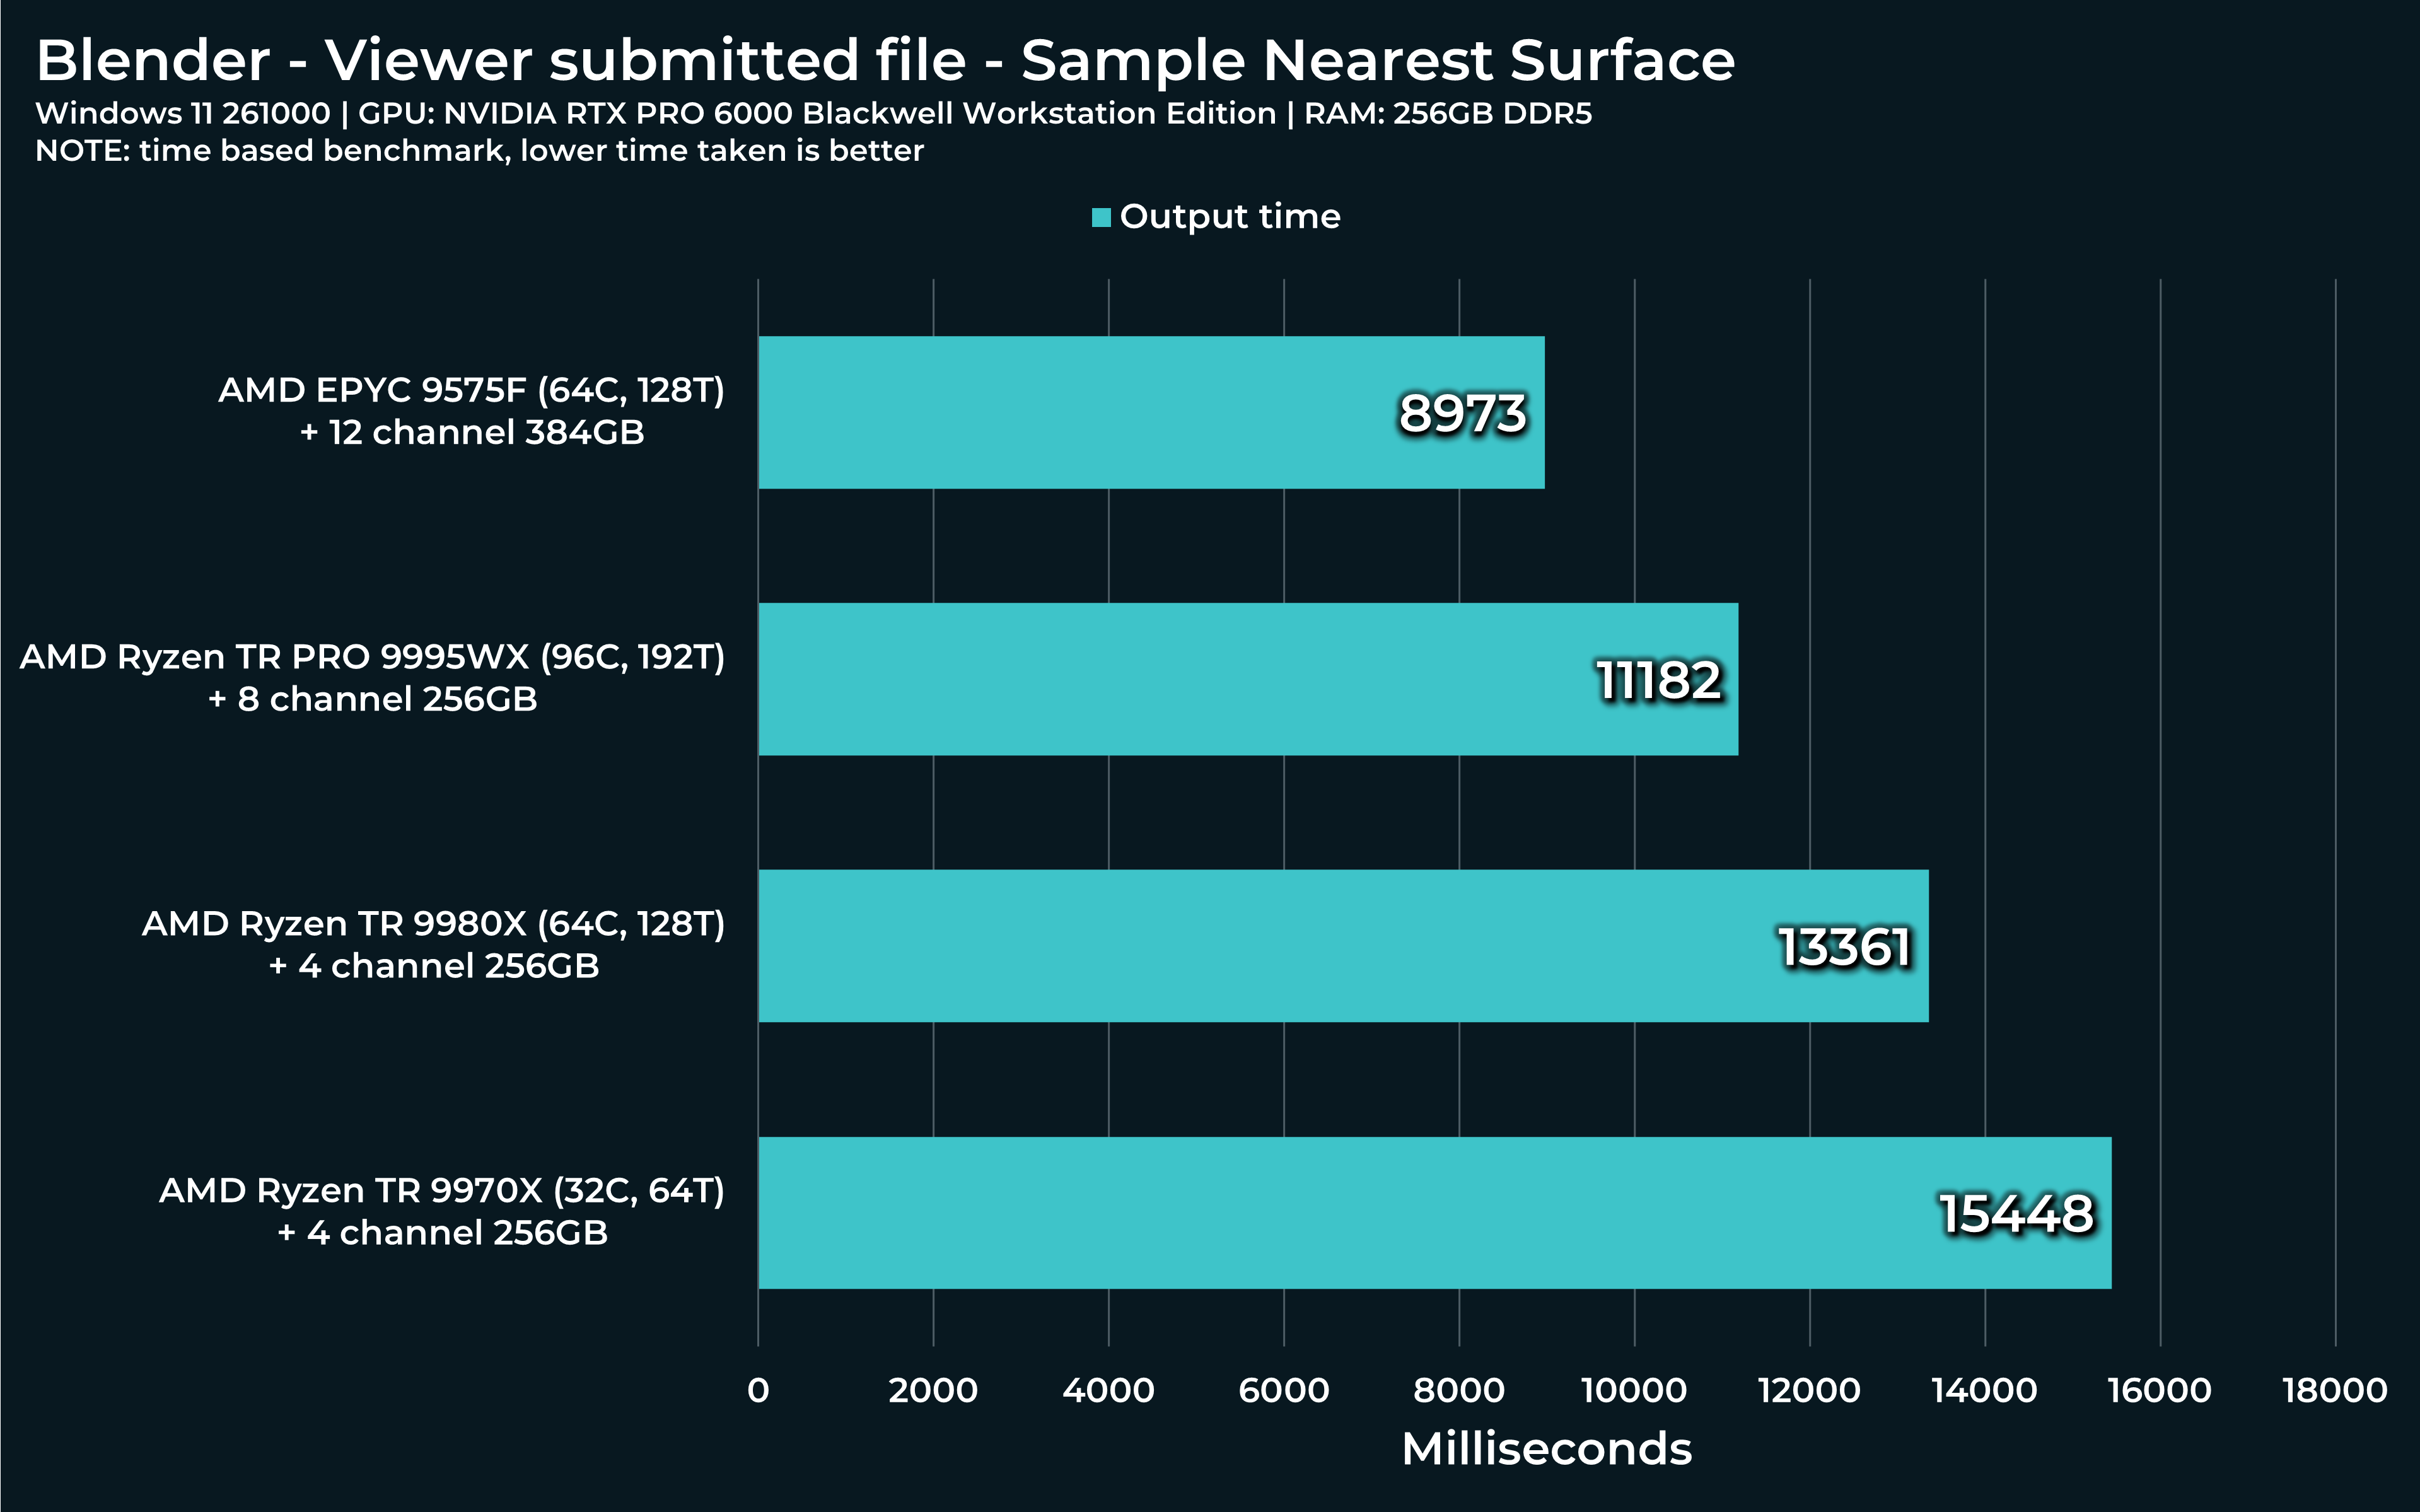
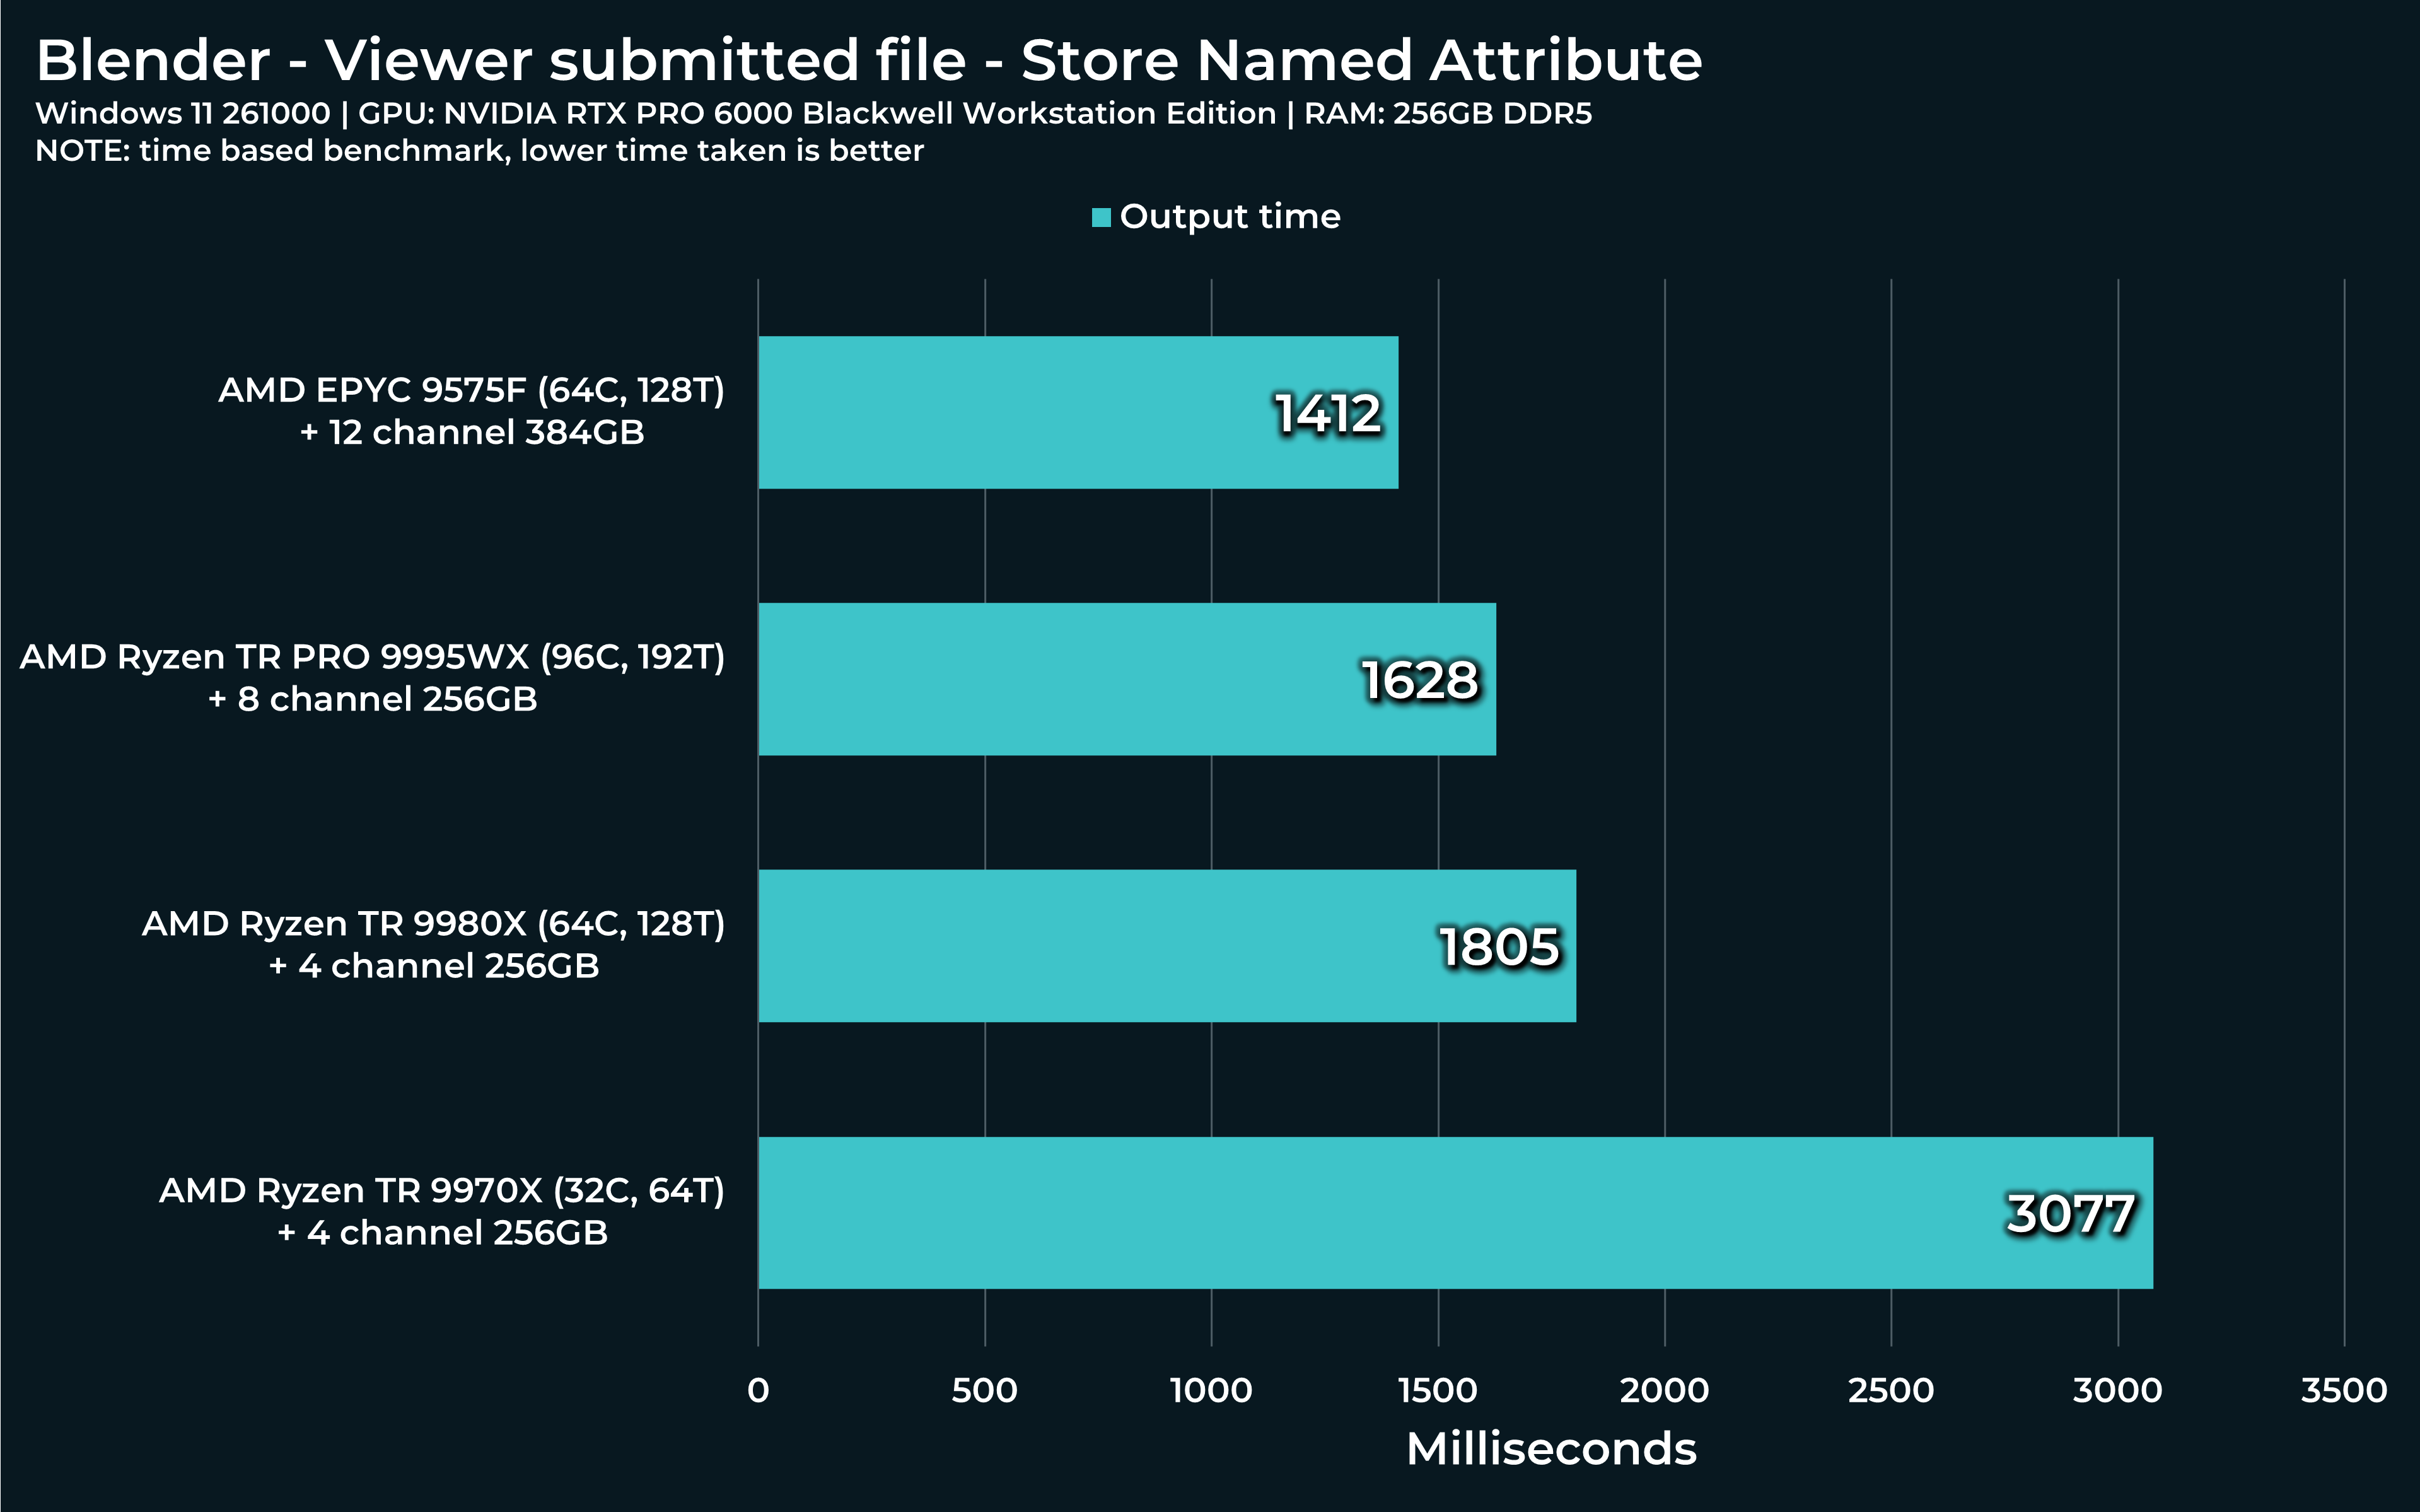
“Sample nearest surface” and “Store named attribute” are nodes I often use for transferring UV maps between models, for example. Very handy, but also pretty demanding. Especially, if used in tandem or on multiple objects at once.
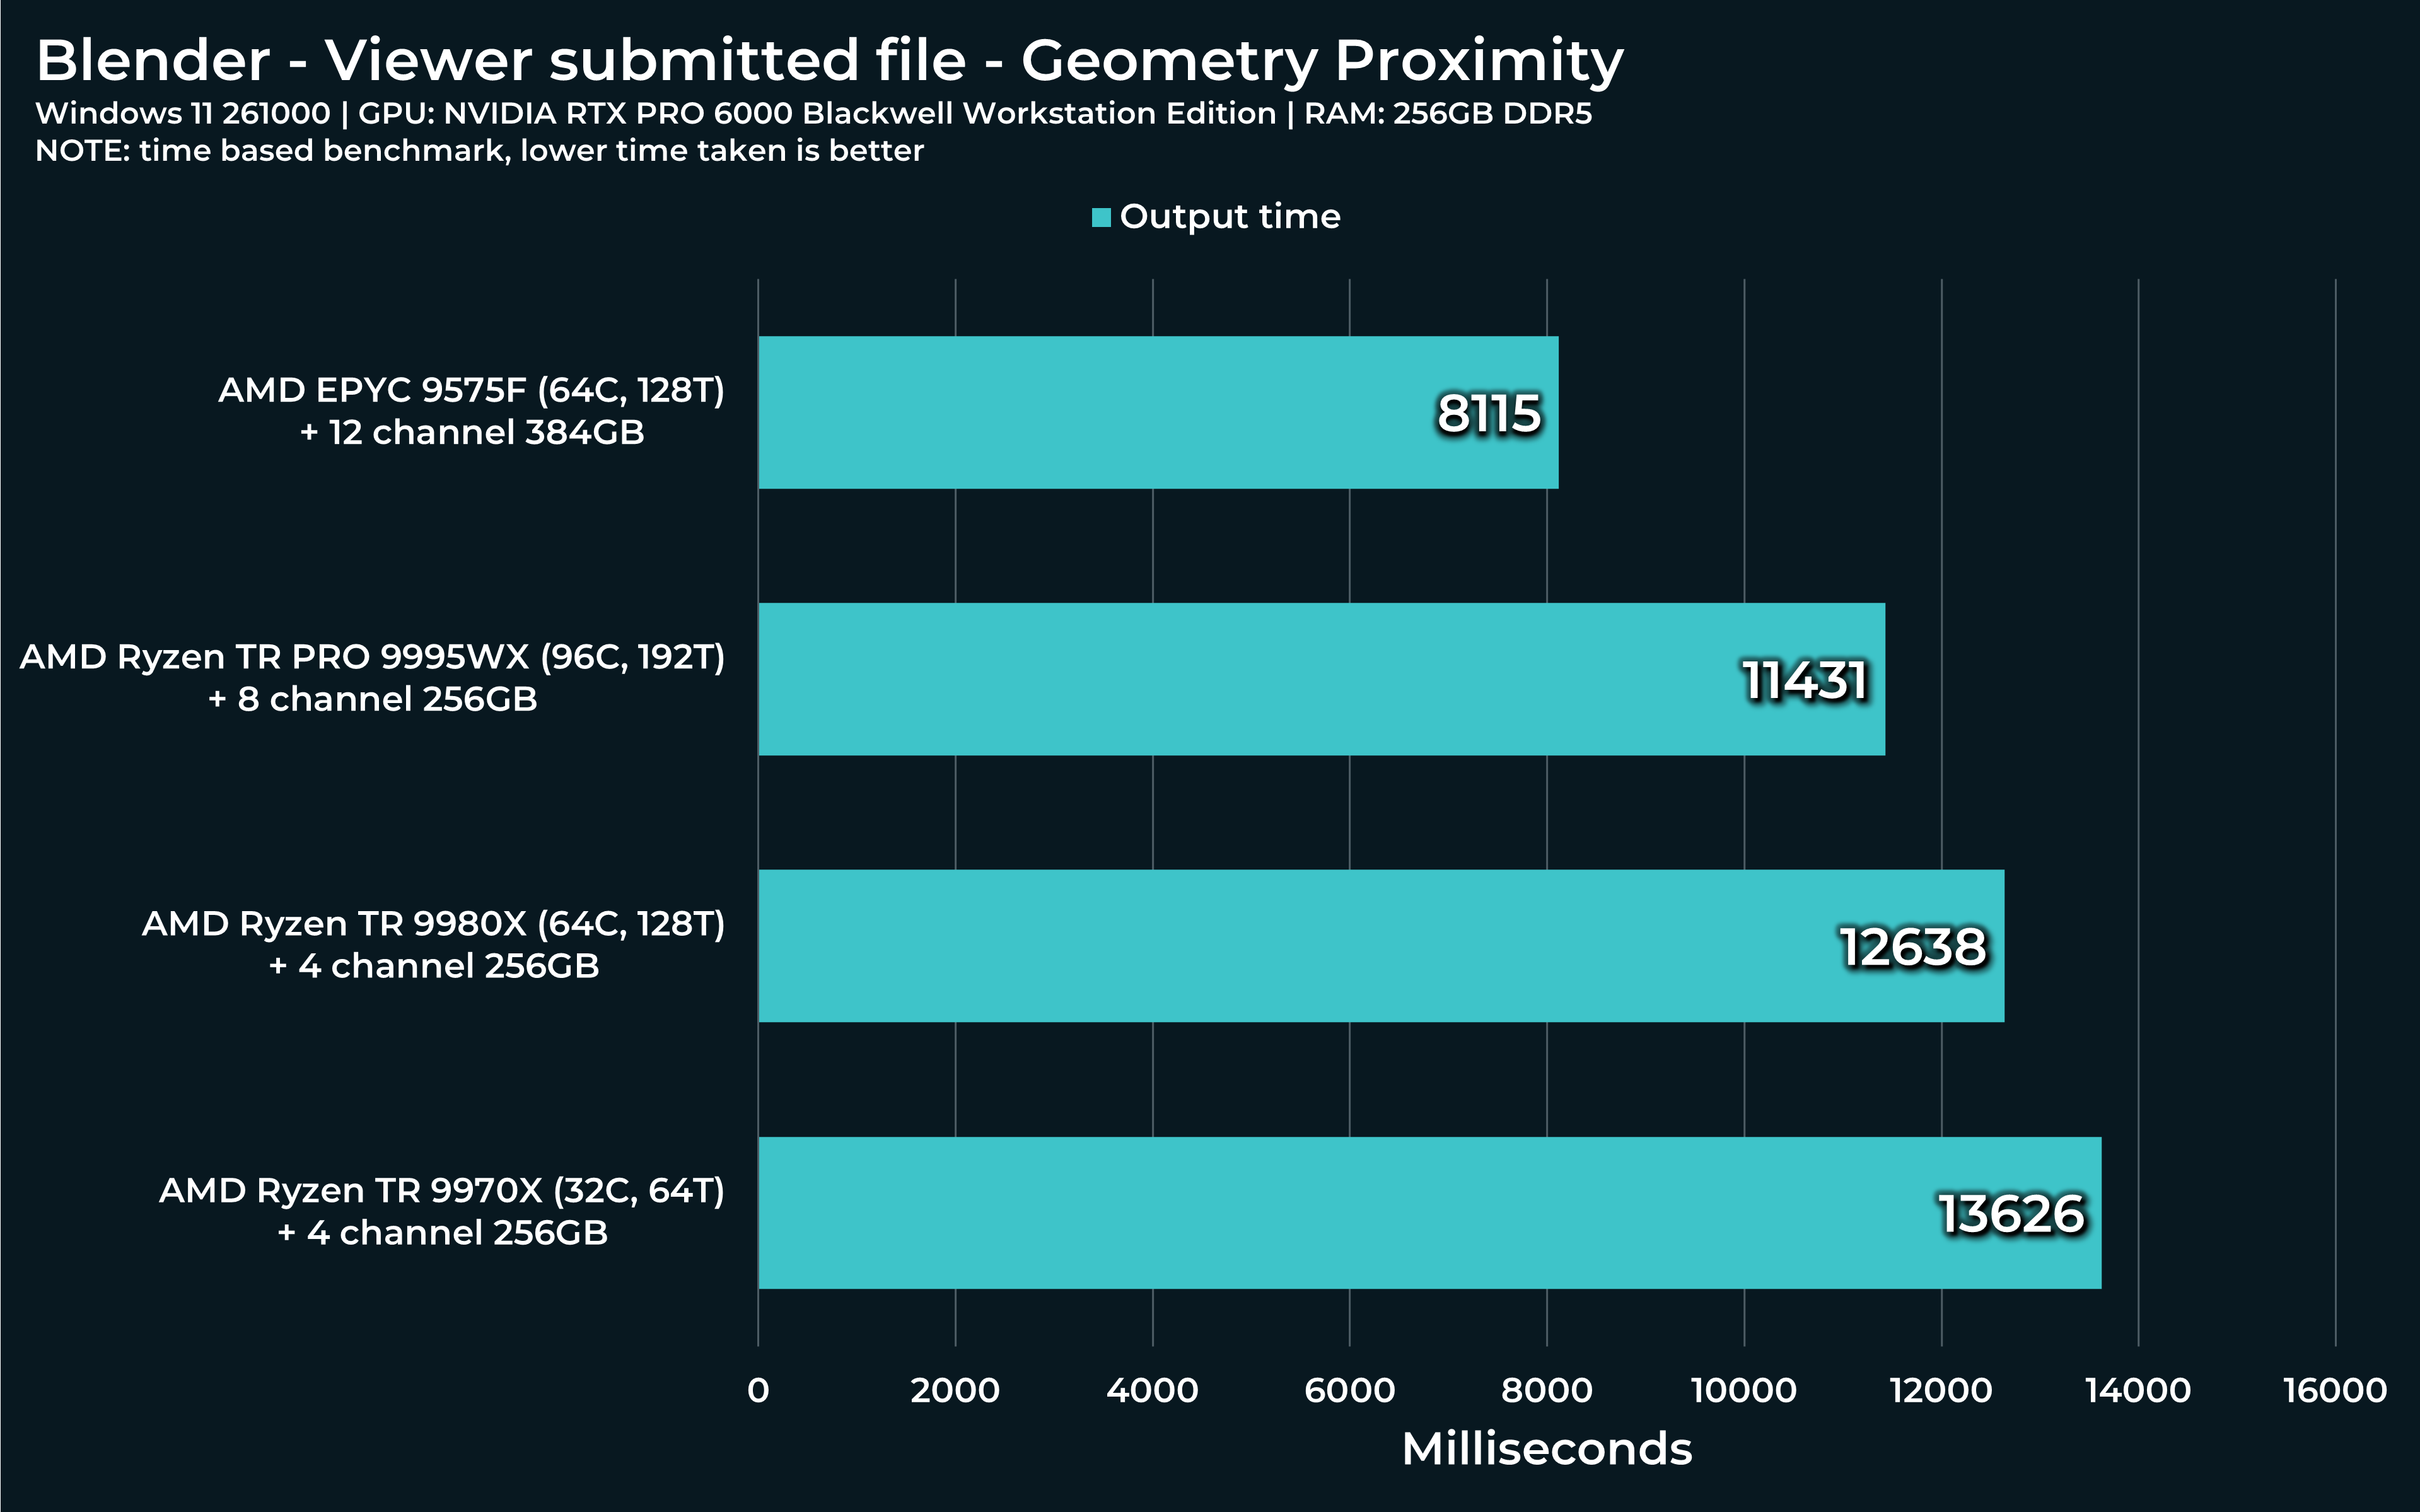
“Geometry proximity” is another useful tool to have. Speaks for itself, I hope. In this use case, highlighted “Set position” node is where this load will show on.
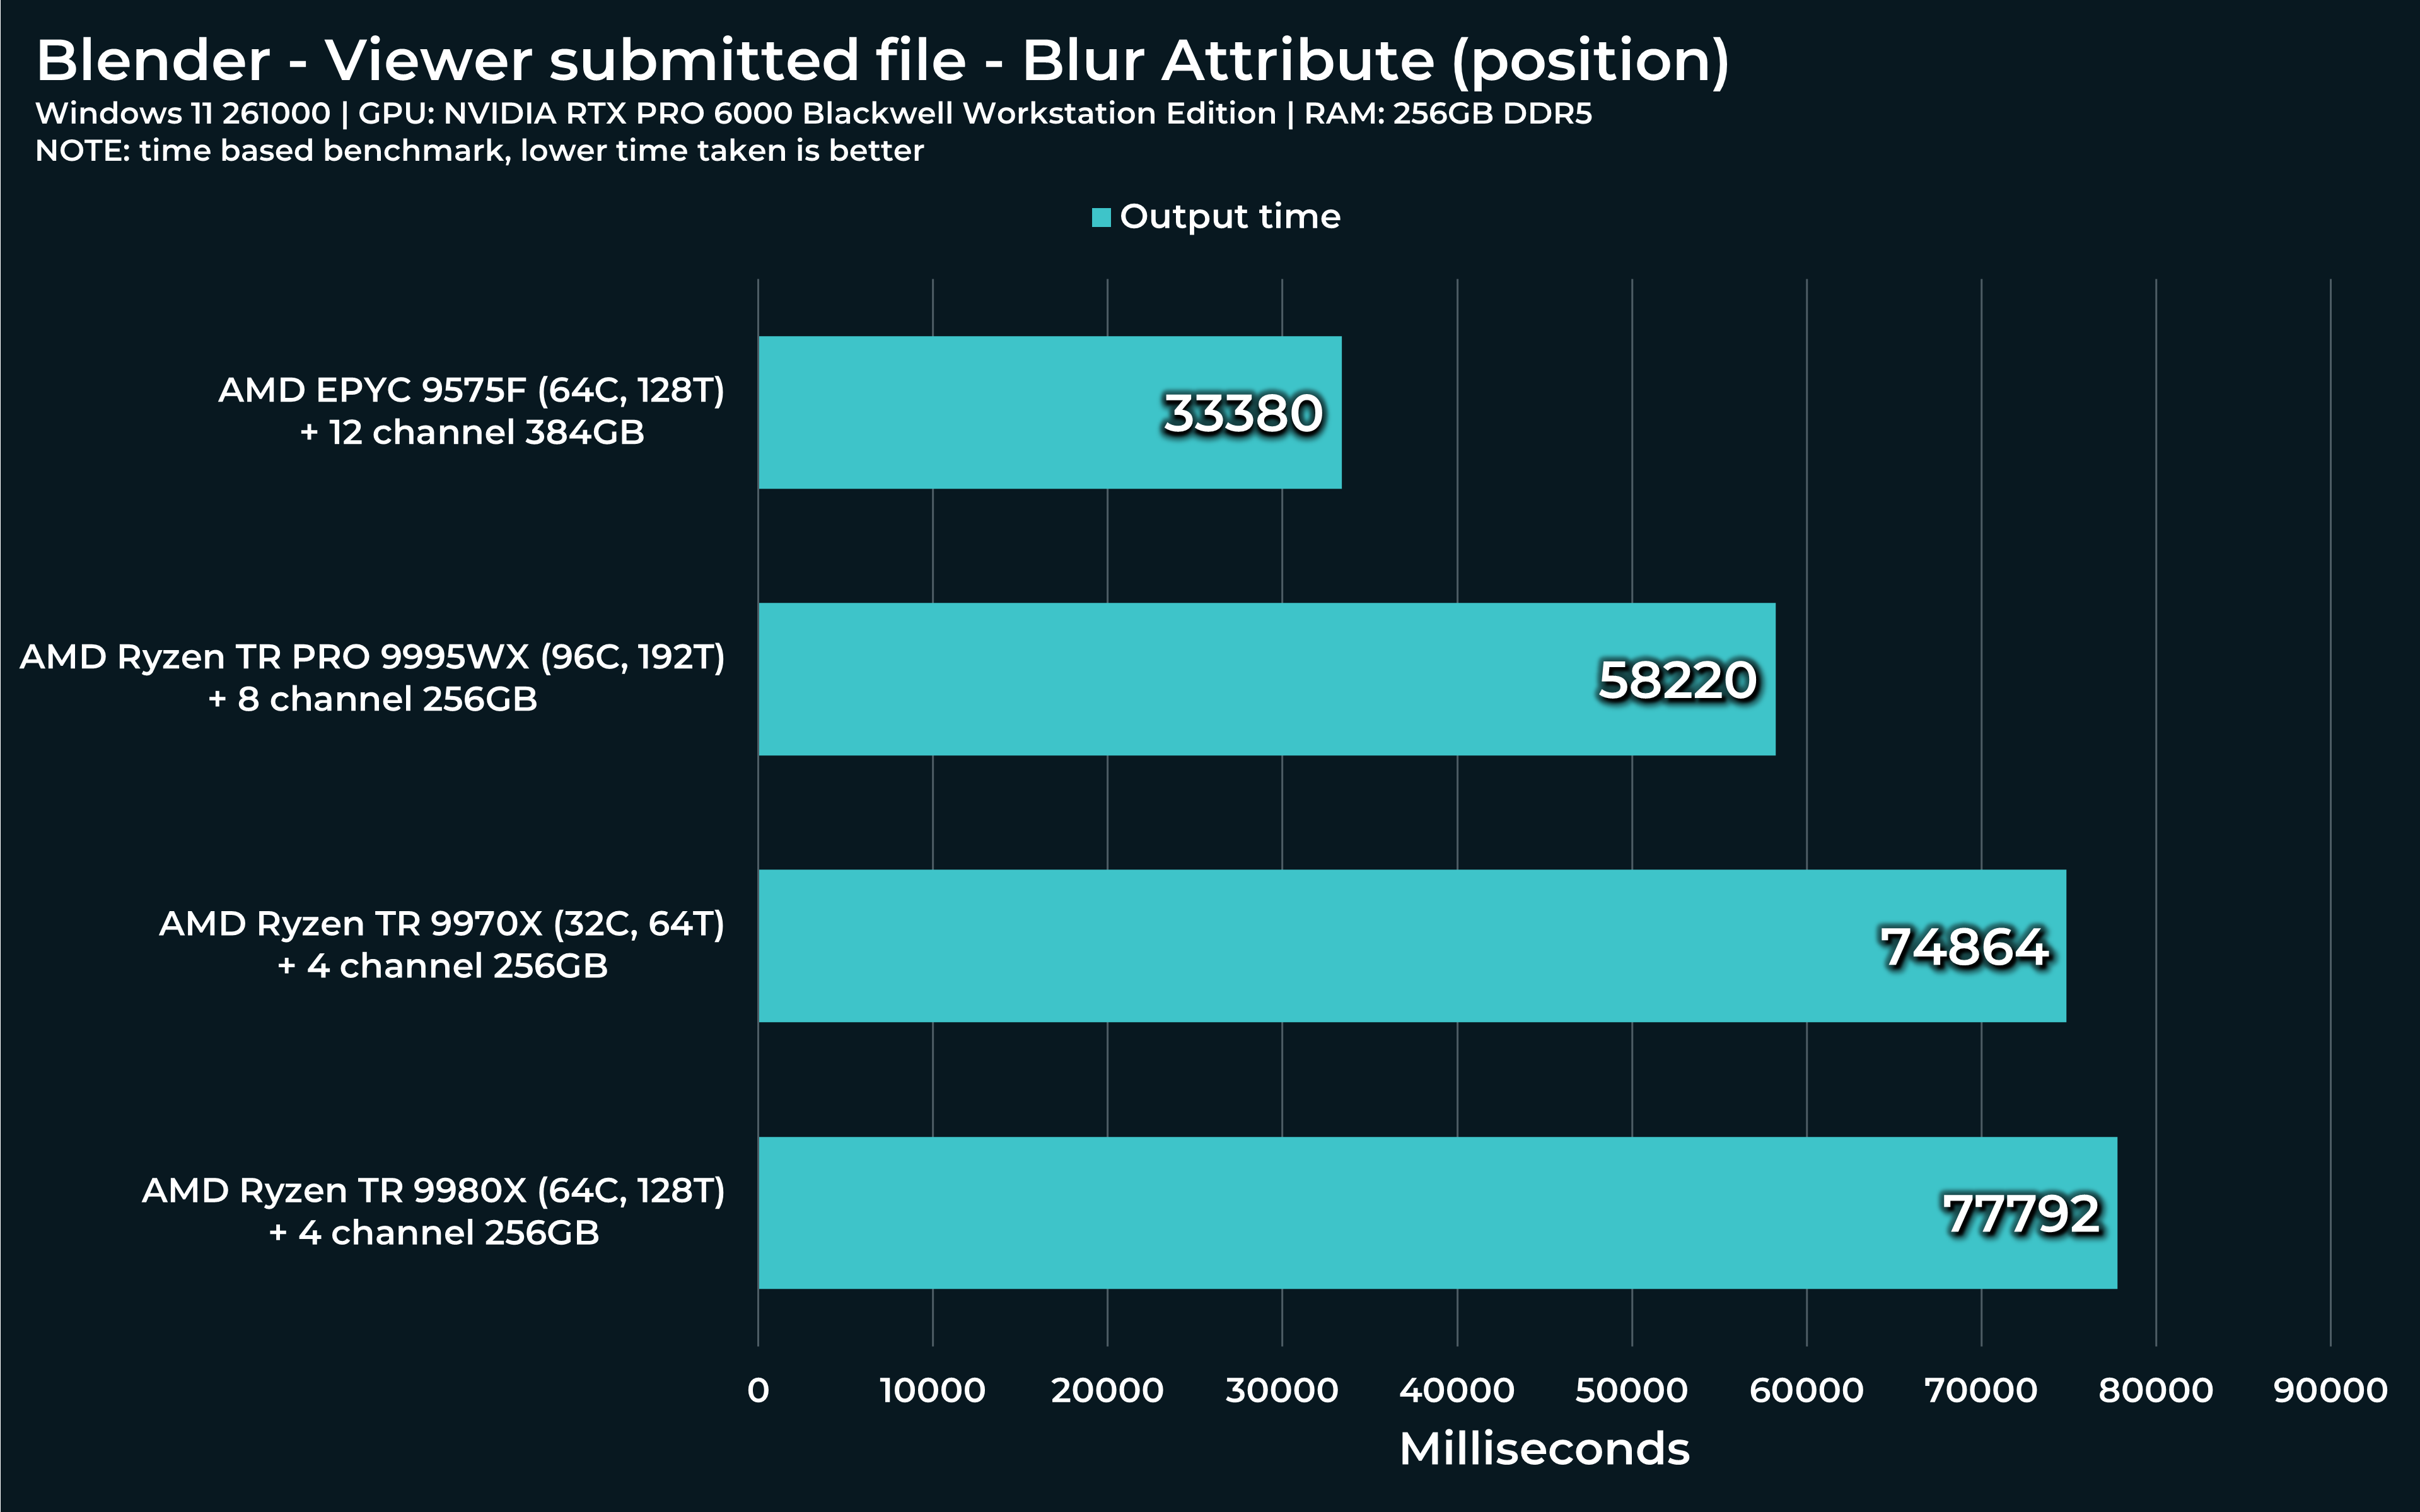
“Blur attribute” is like Swiss knife. Can be used to countless things. In this case, I used it for relaxing out object’s vertices. This is often useful, if you want to smooth out objects in various ways, with weight masks applied etc.
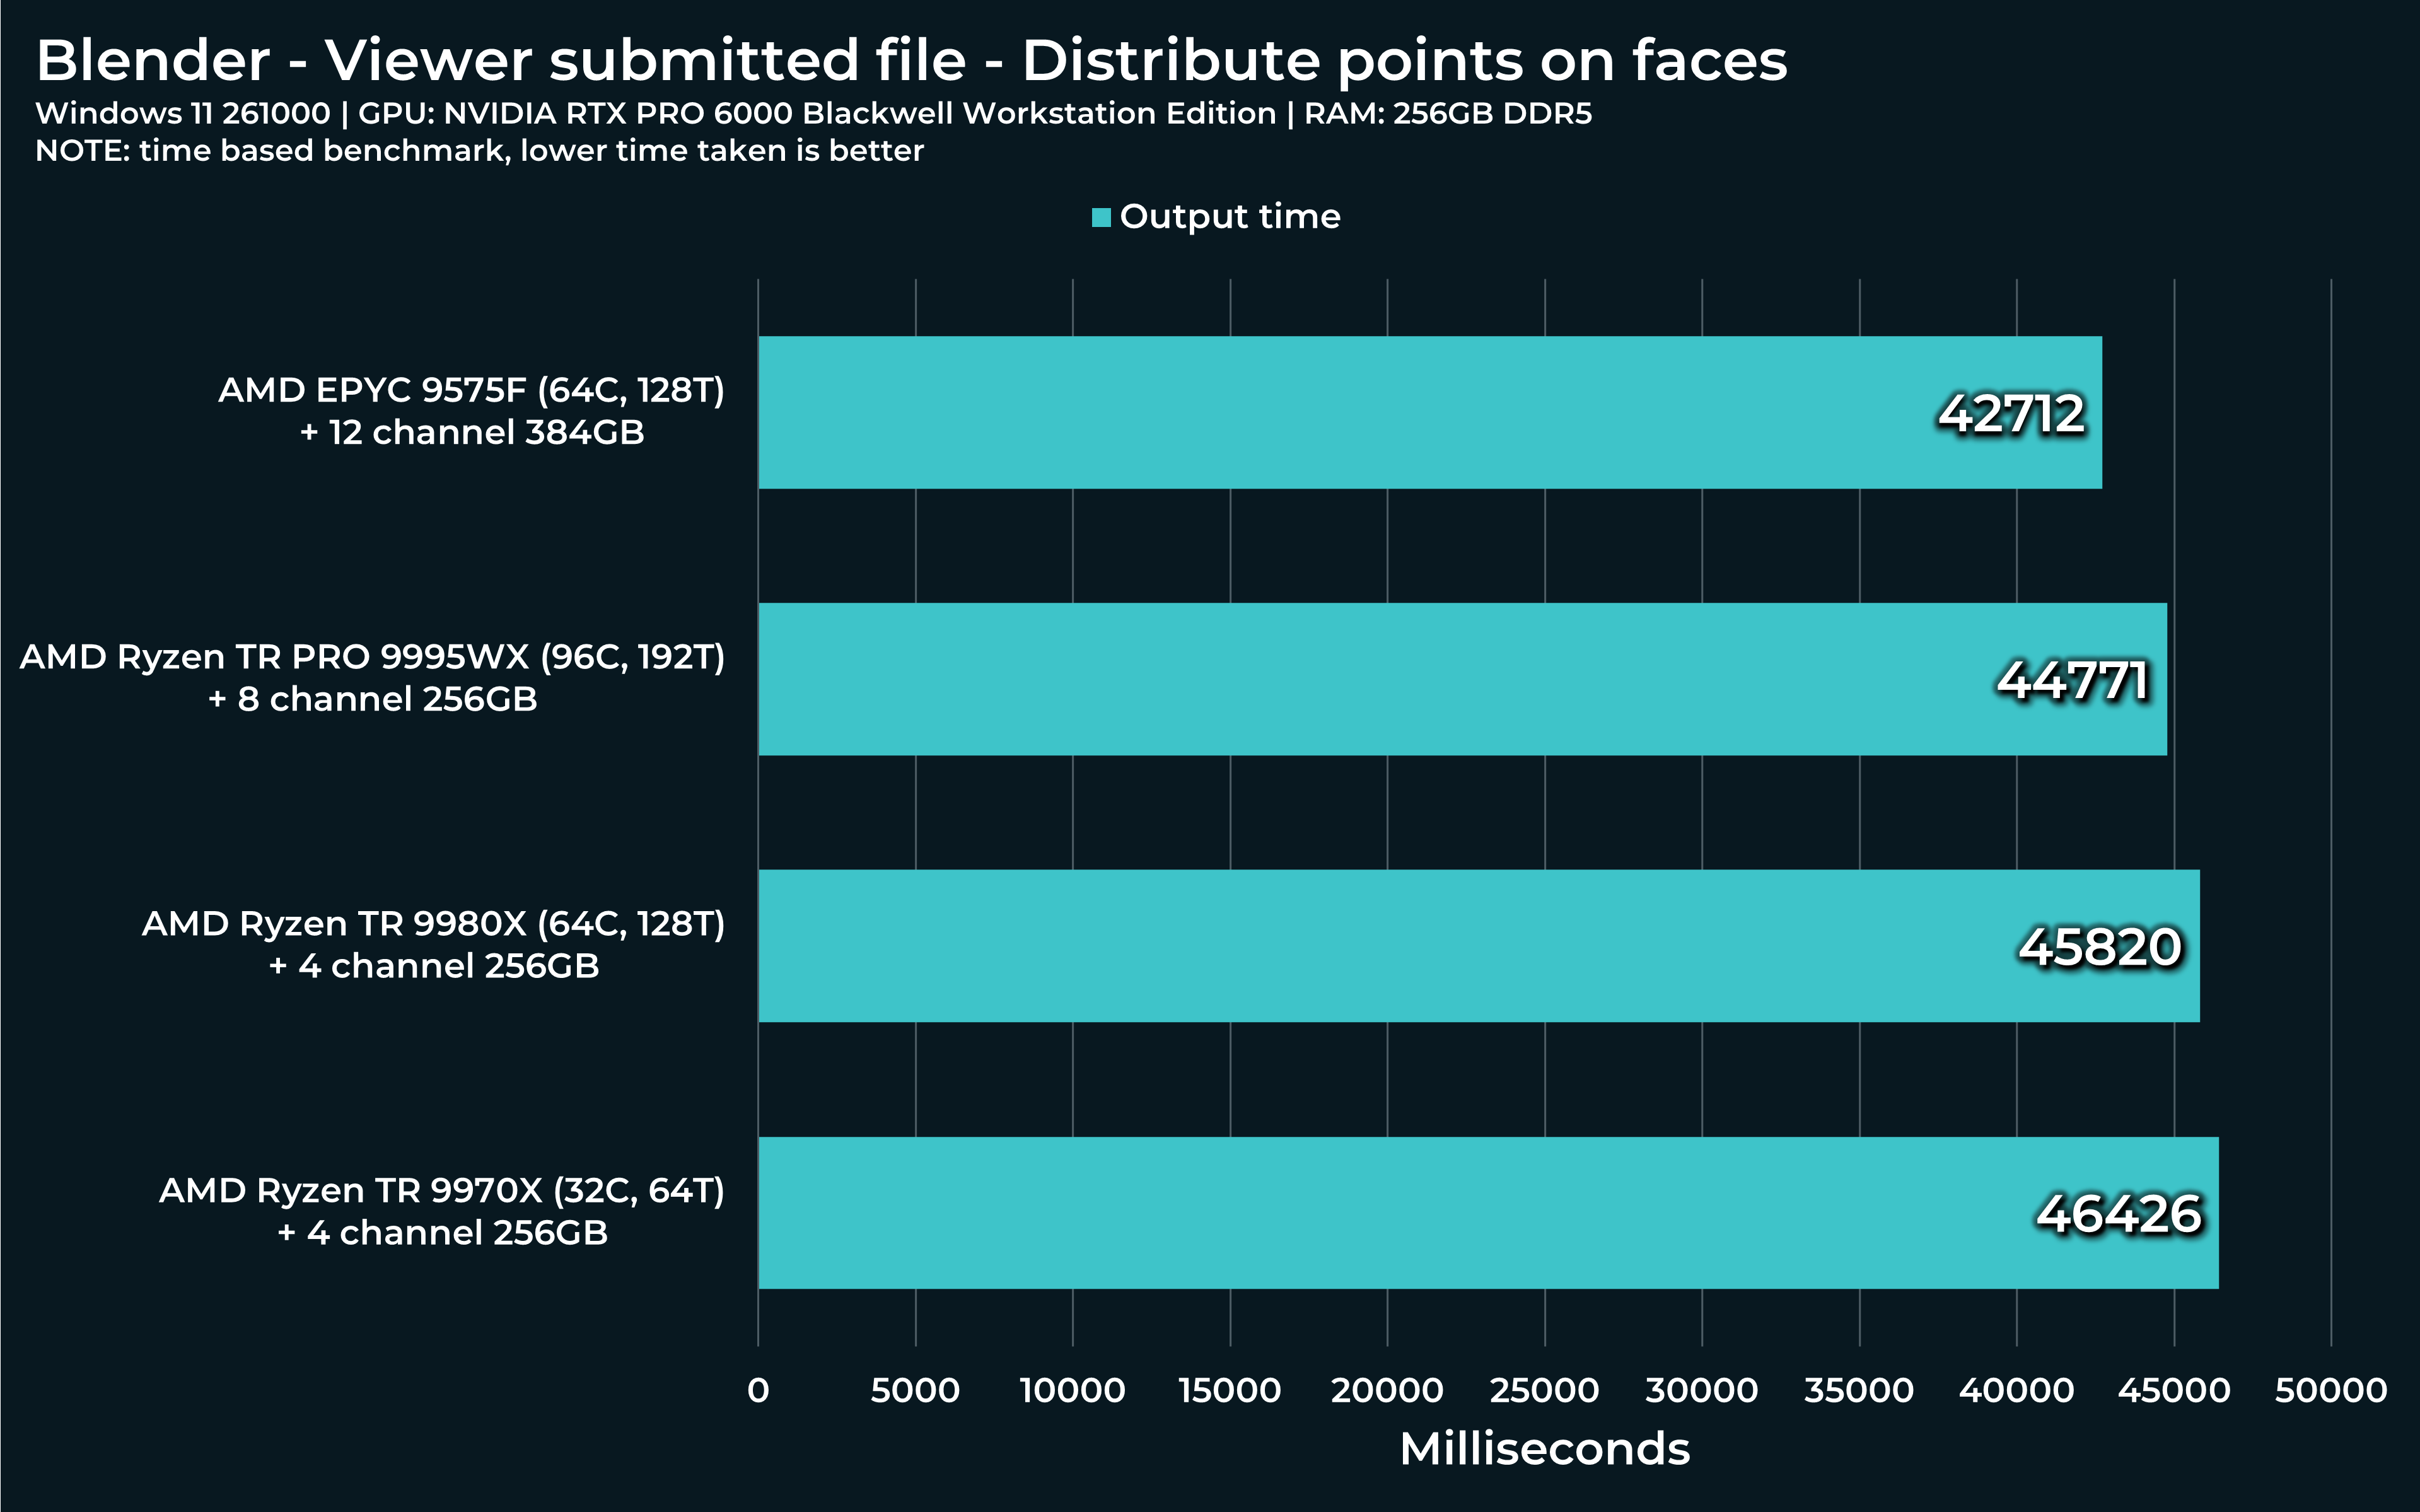
“Distribute points on faces” seems to be running only on a single thread. I wonder how Threadripper will manage? Faster? Slower?
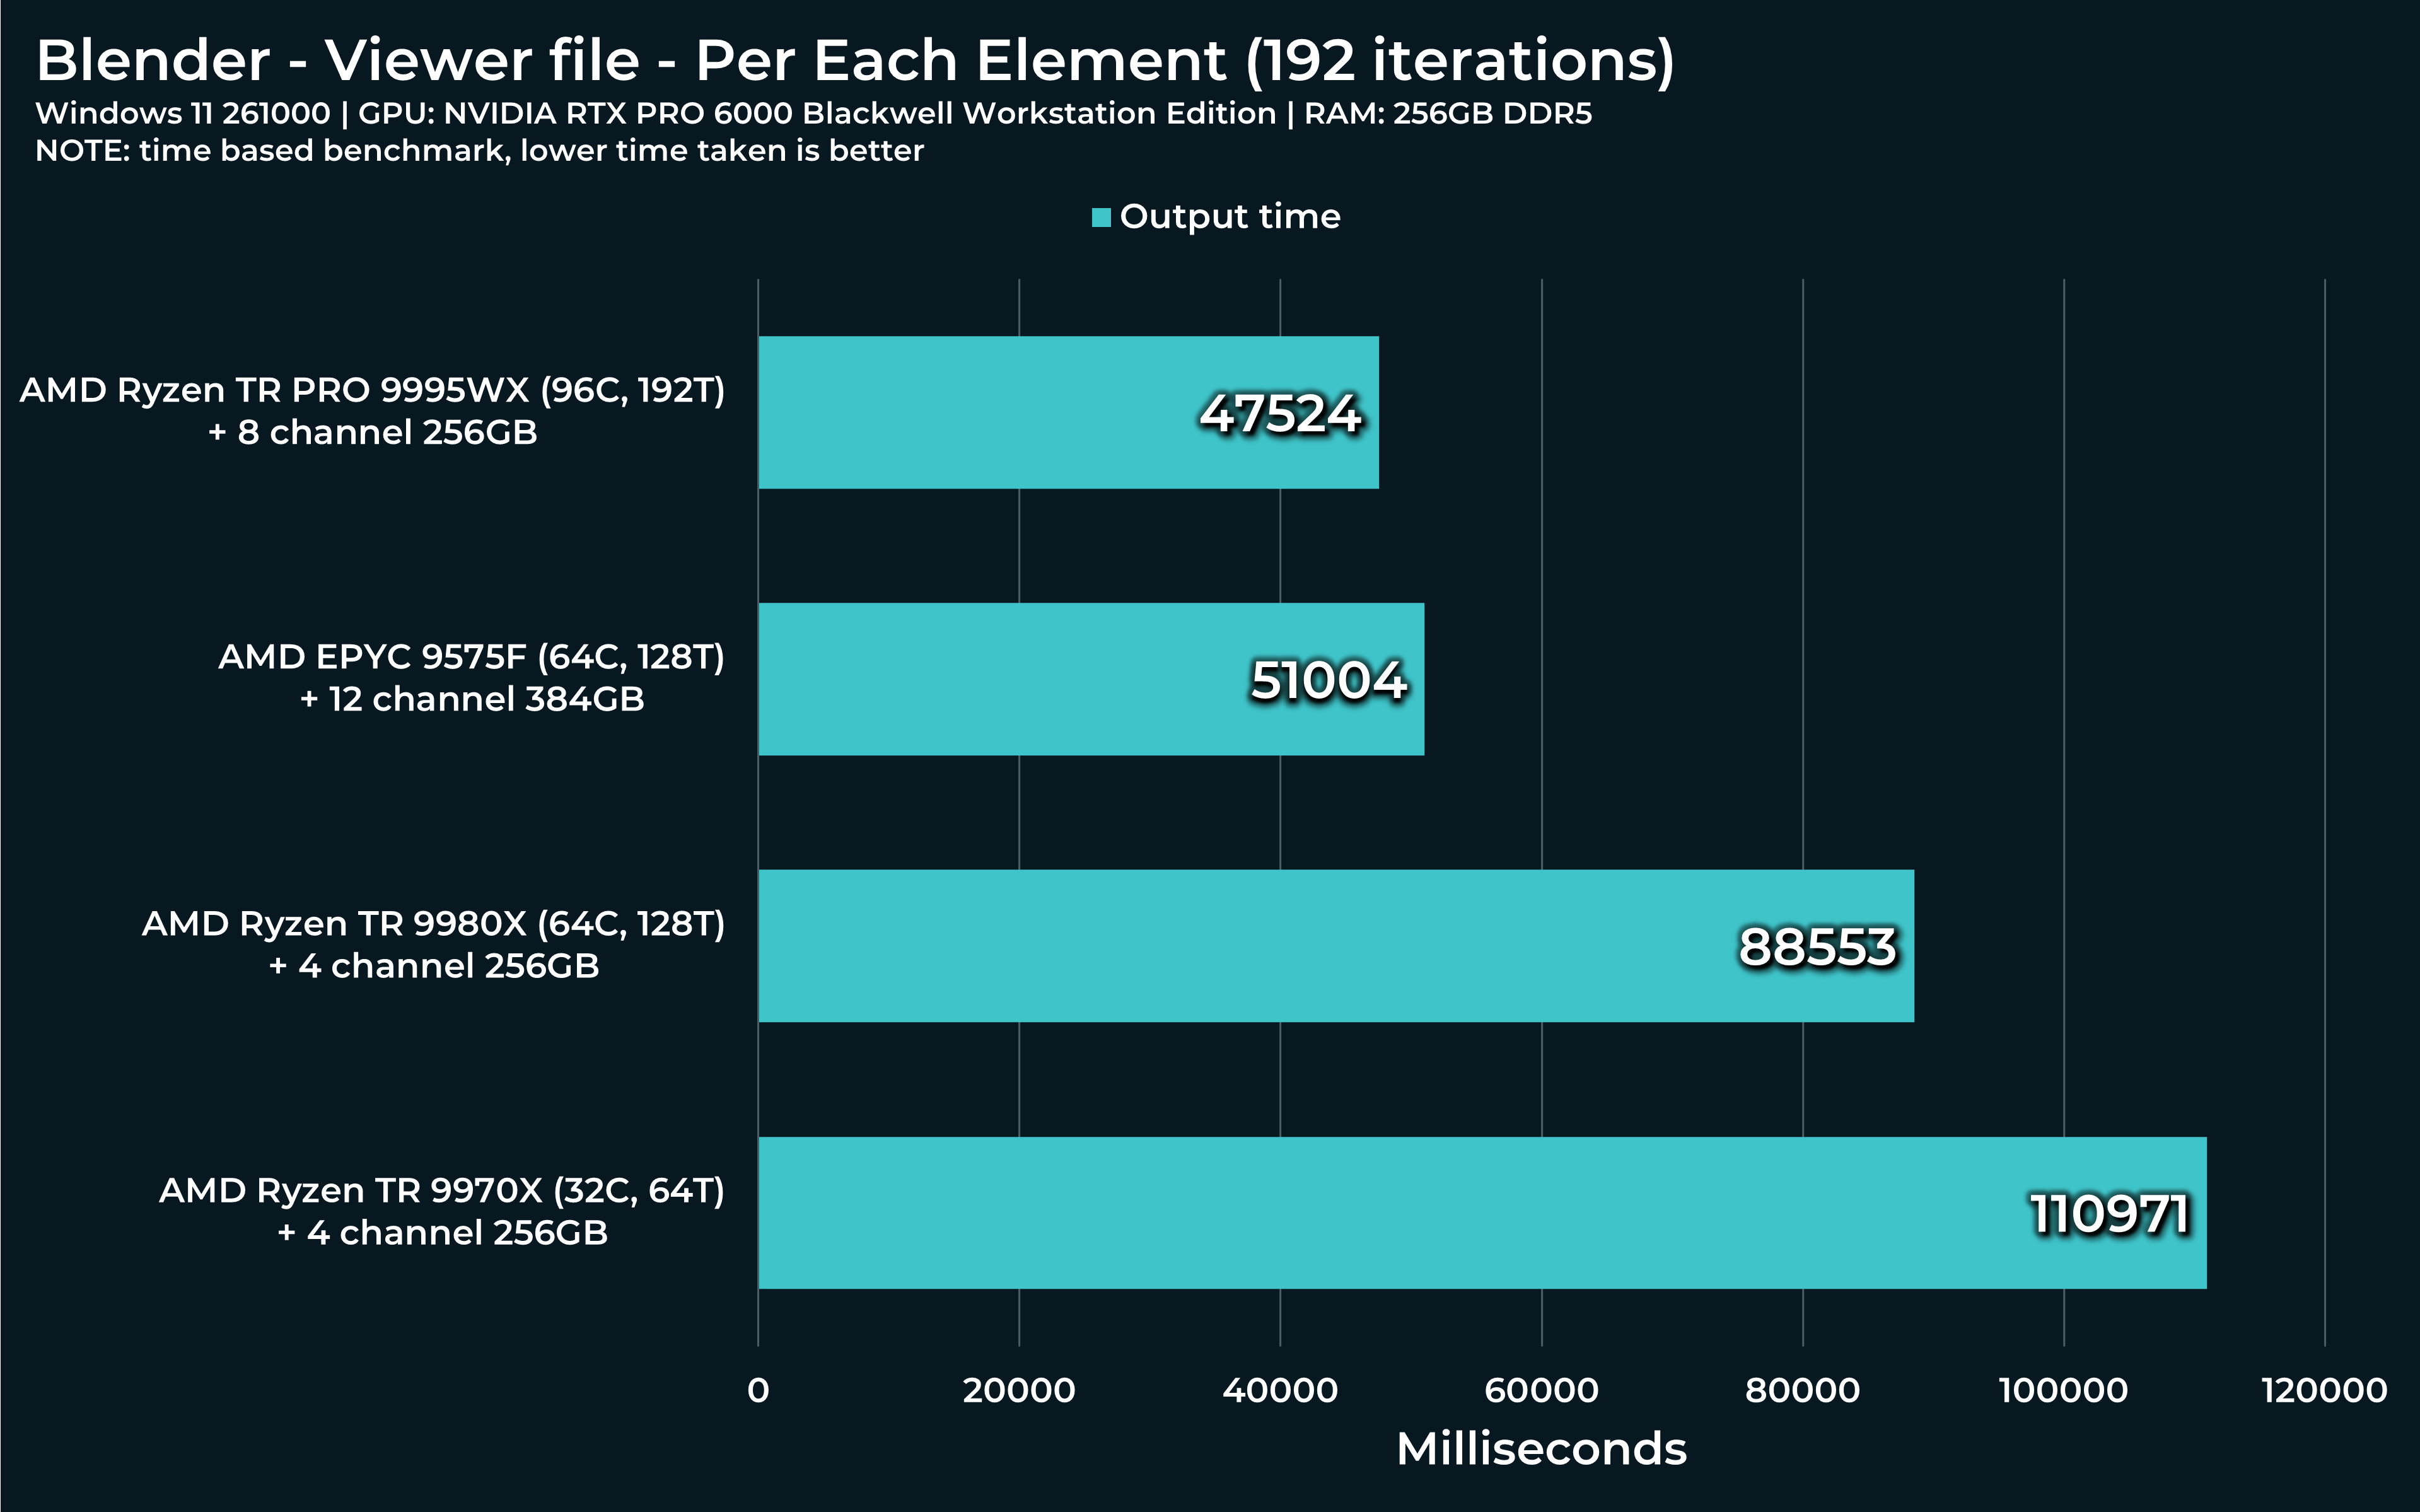
“Per each element” - this can take single threaded nodes, like “Distribute points on faces” and make them work in paralel, it seems! Can all 96 Threadripper cores be under full load? By default, number of runs is set to 192. On my system, when running only one iteration, it jumps to ~10% of CPU load and jumps around 2-3% with each additional iteration.
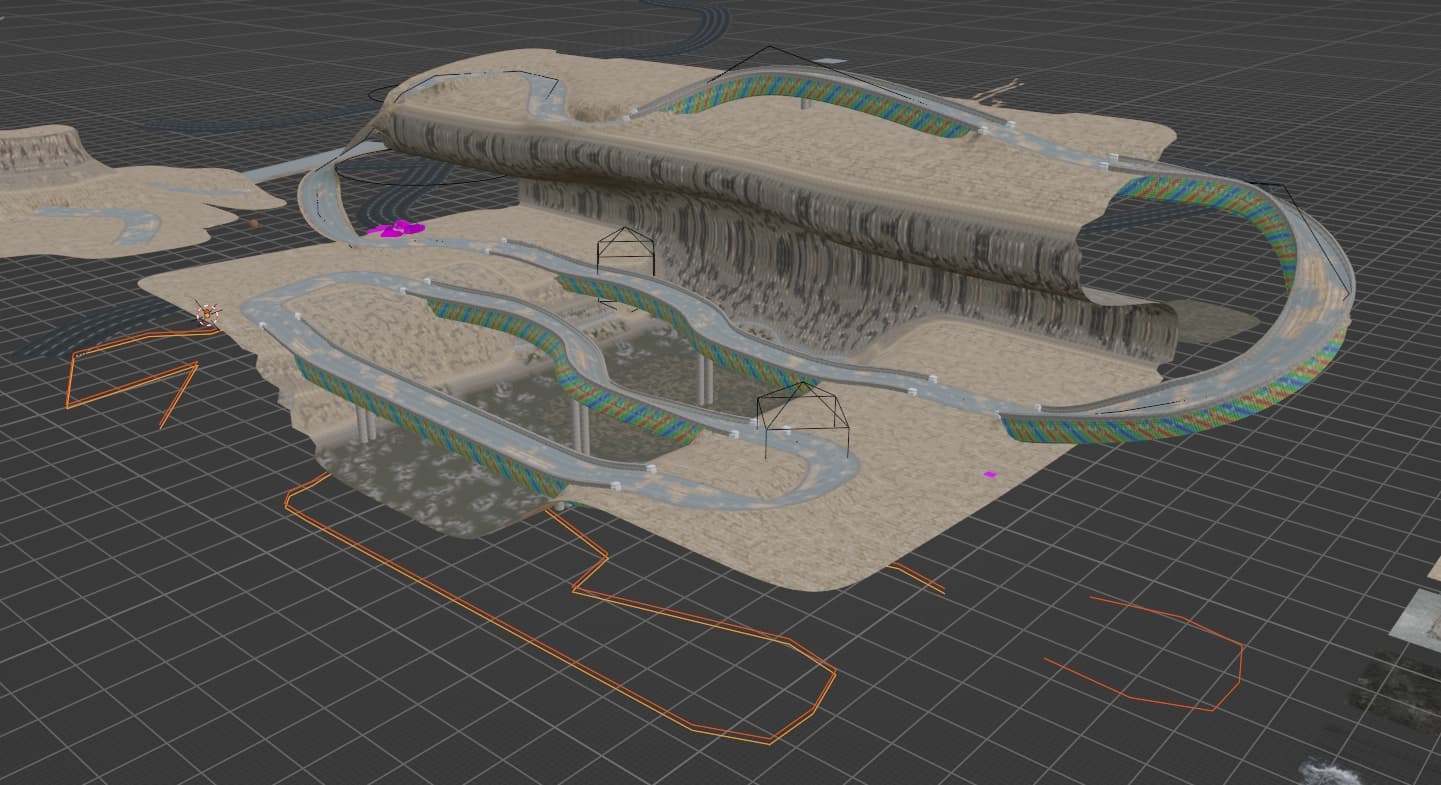
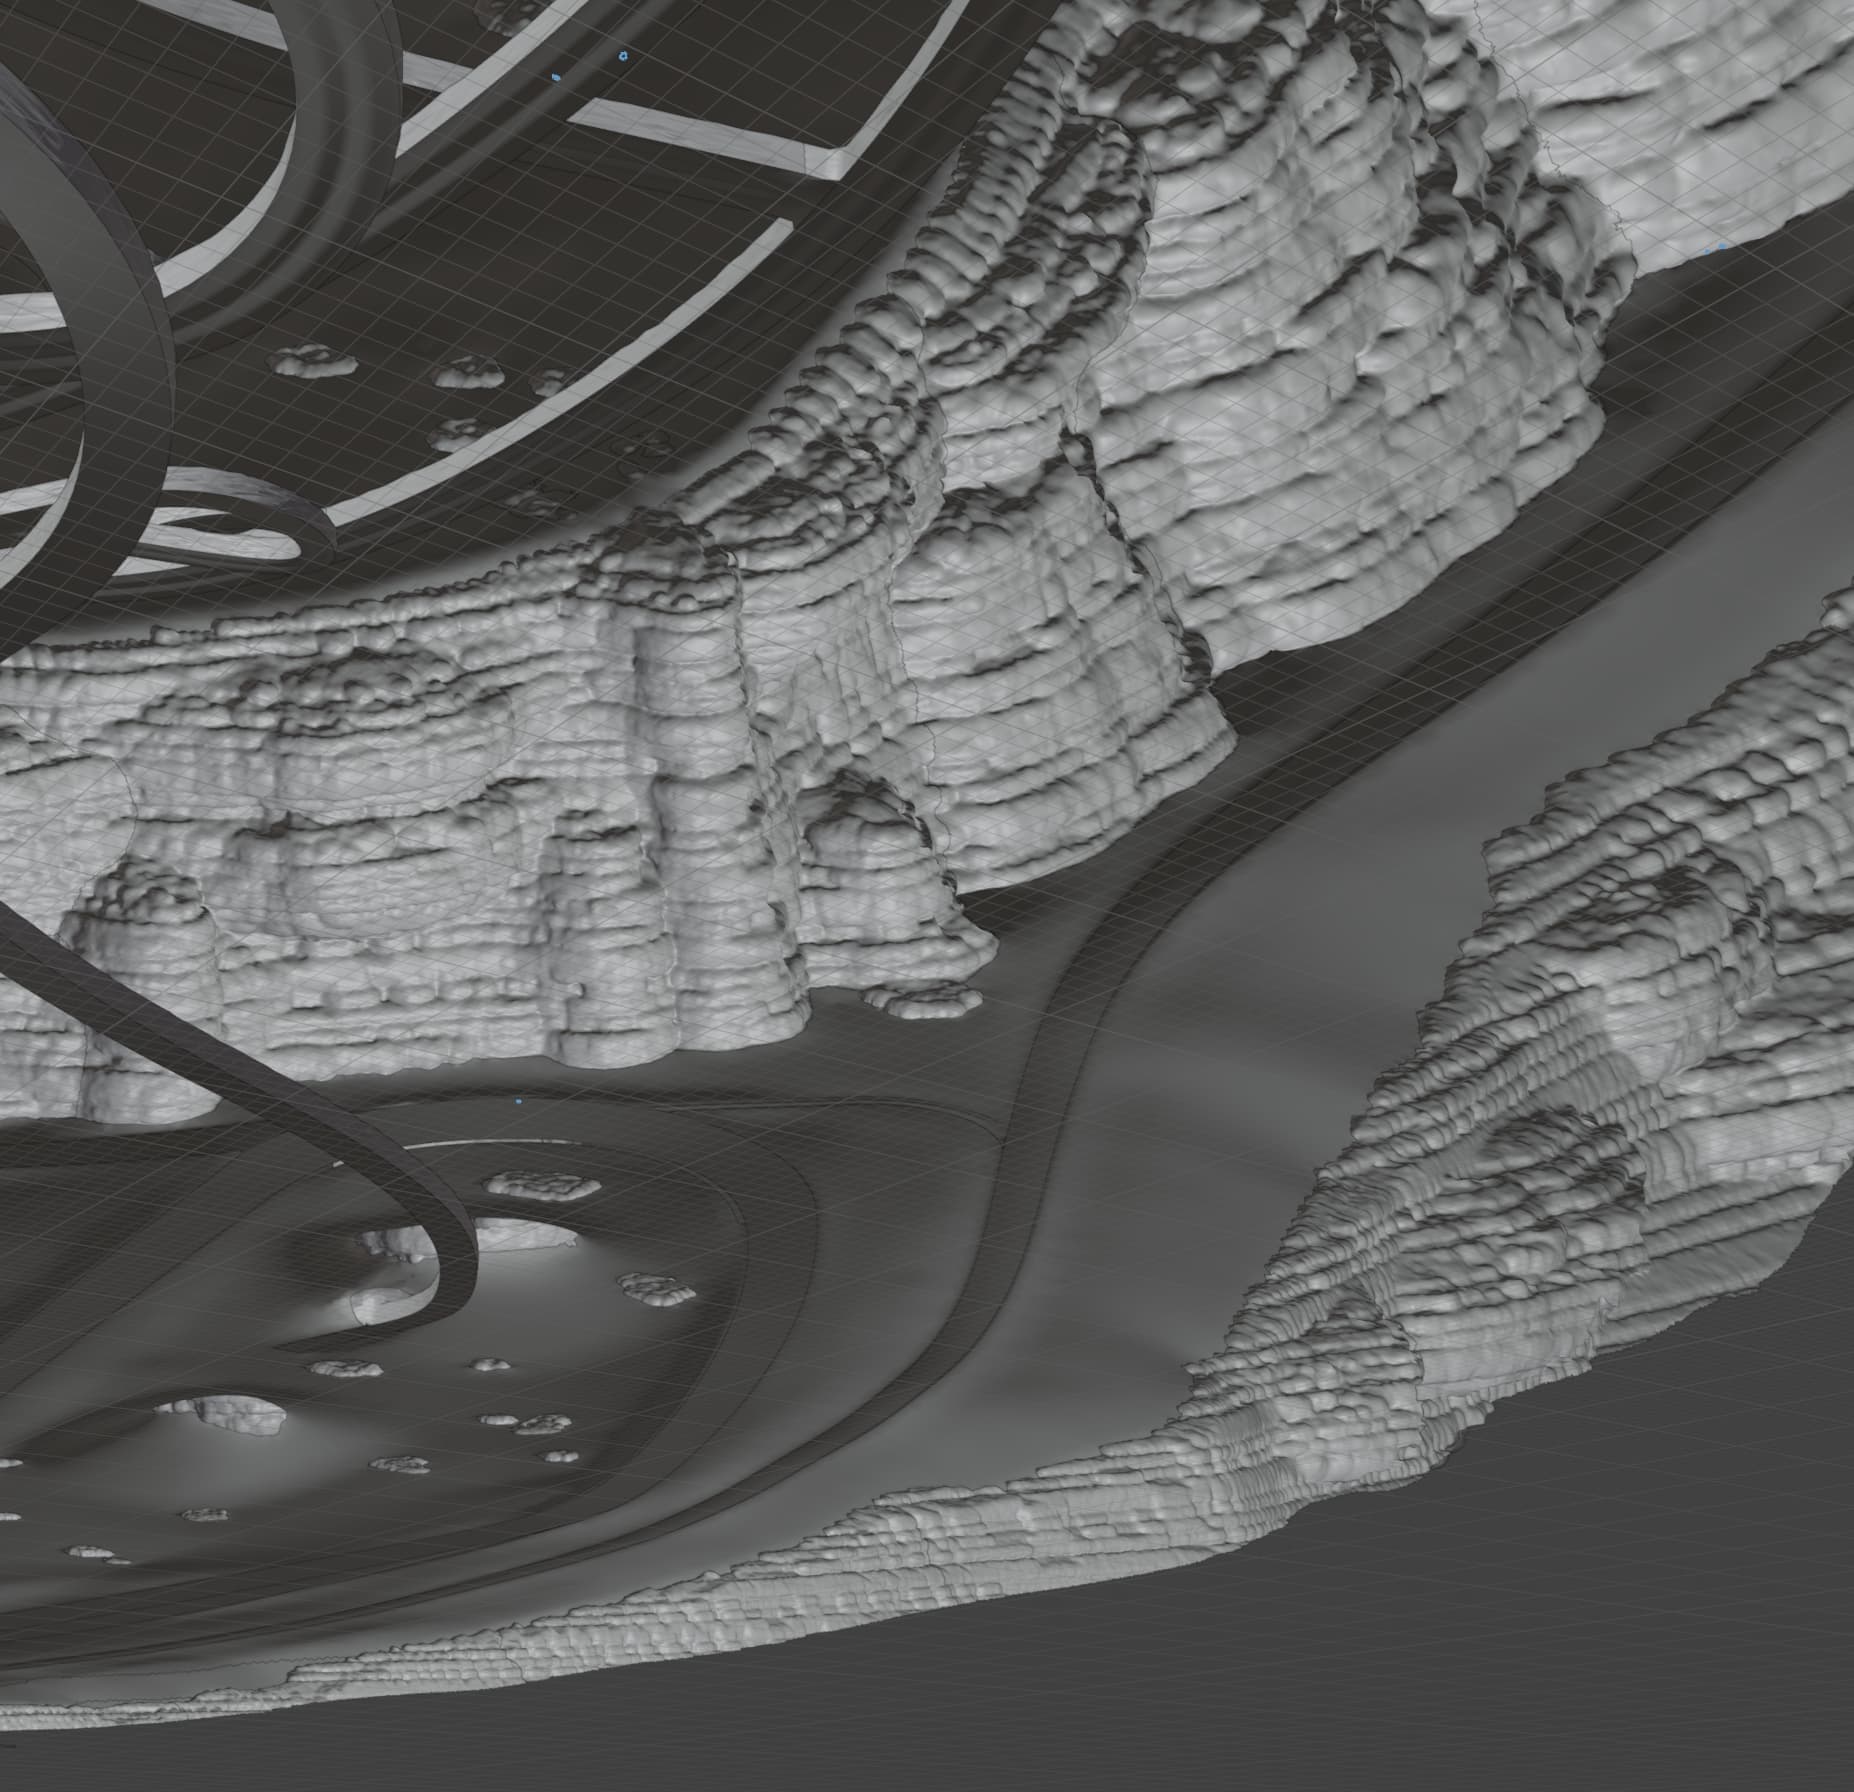
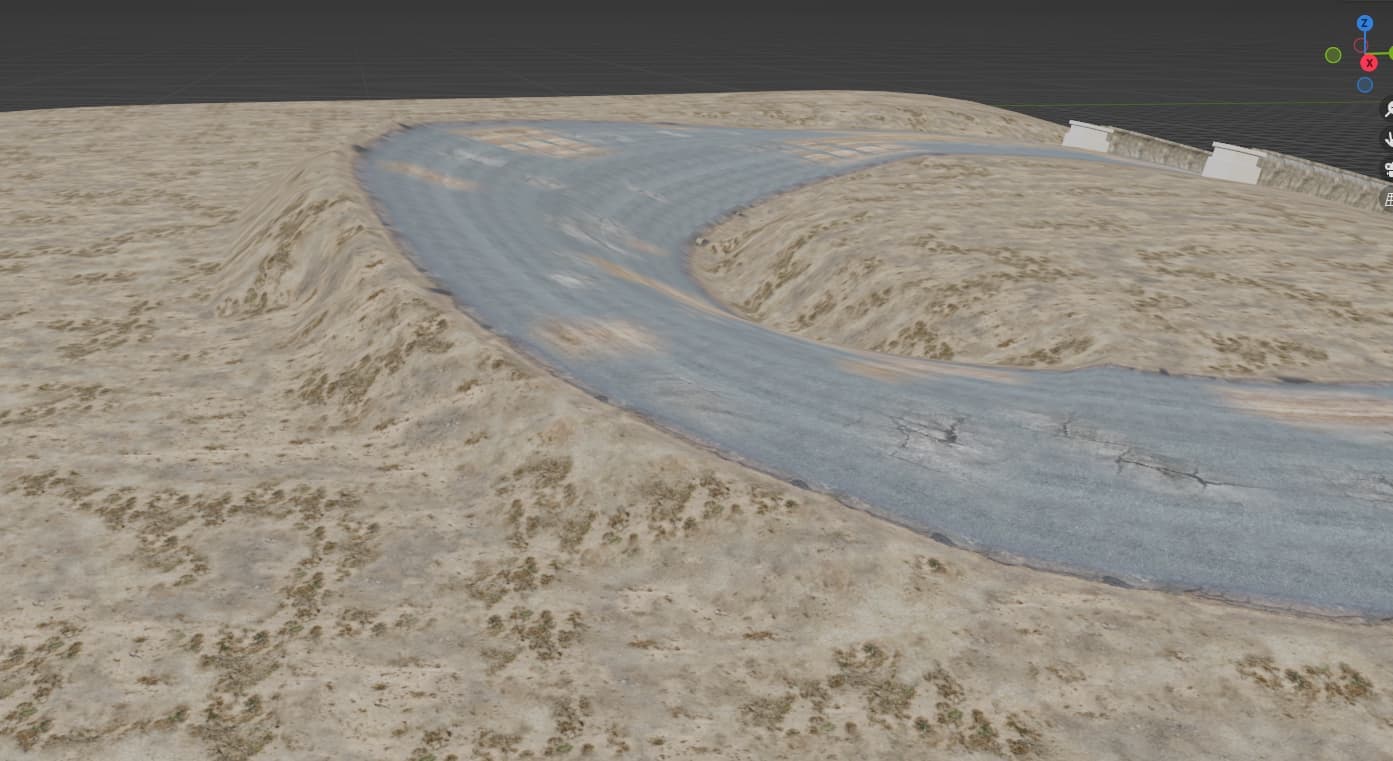
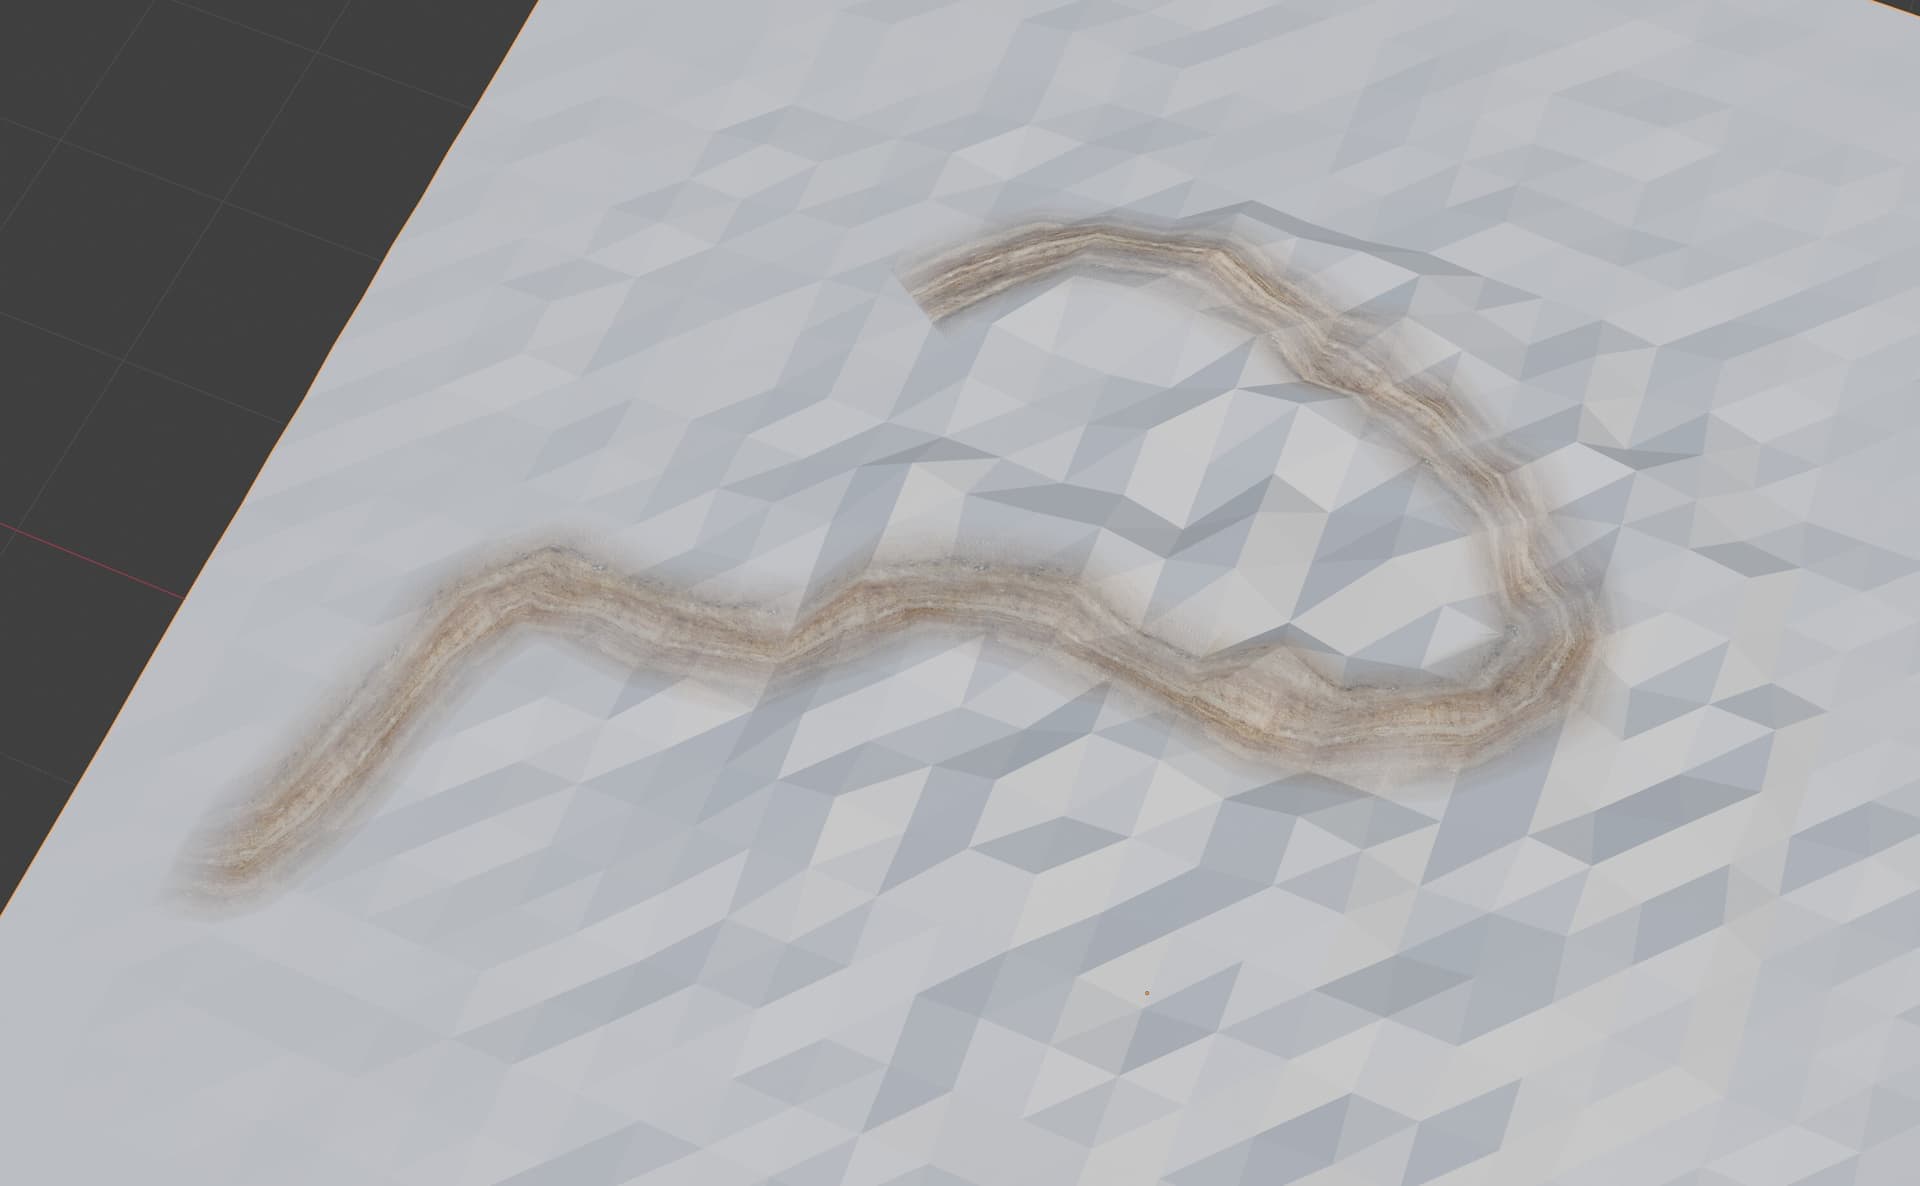
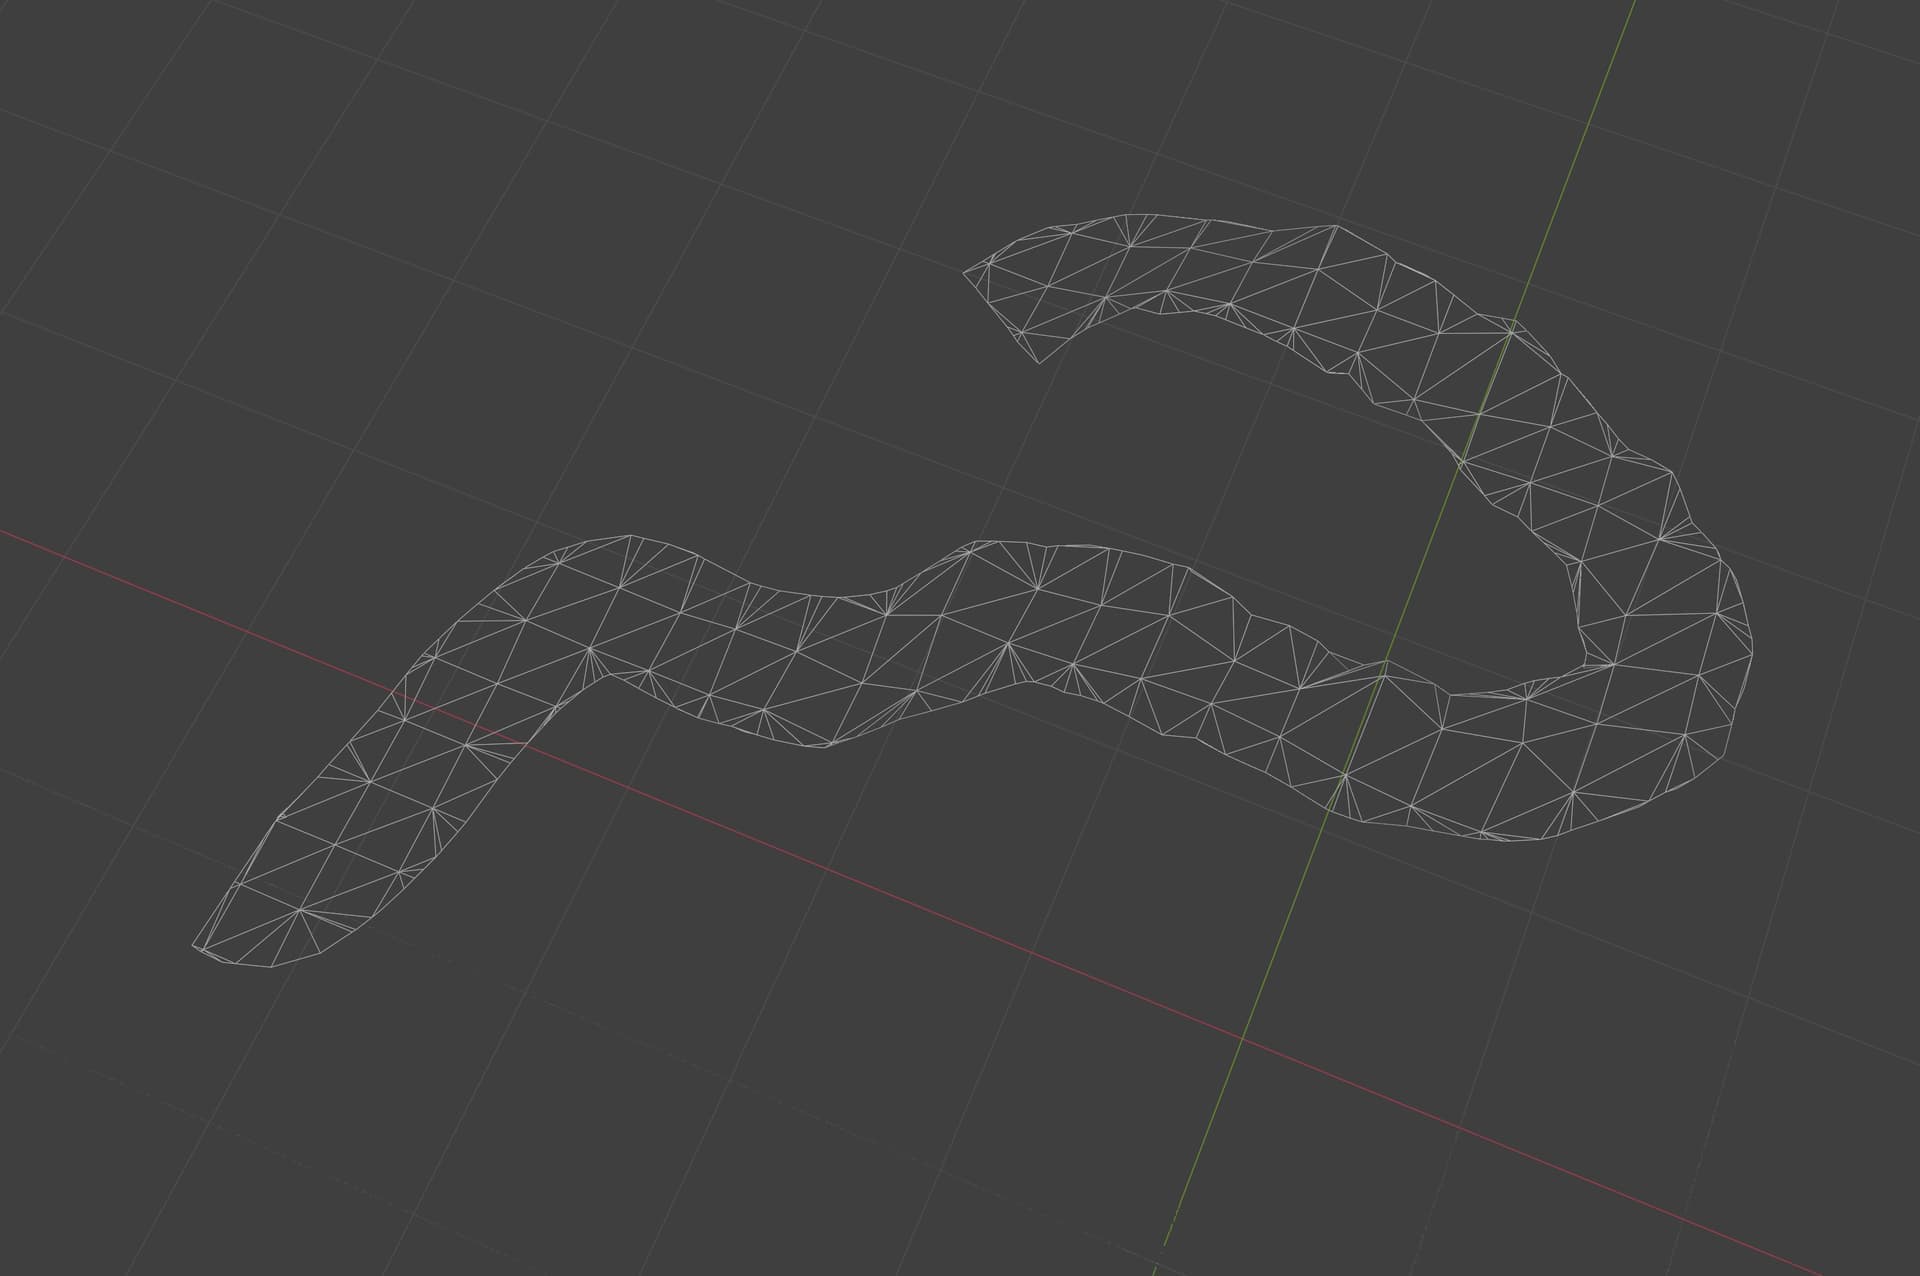
Here’s an example of first two computations and the Menu switch for choosing between them.
Extra notes from within the file (with timings for anyone interested enough to check):
I took some time to gather all ideas I hope will be relatively easily digestable for you. But I also have to admit I suffer from tunnel vision. For me, many things are quite natural as this is my daily environment. So, if you’ll get stuck on something, please, let me know. I appreciate your time!