Solidigm Linux support

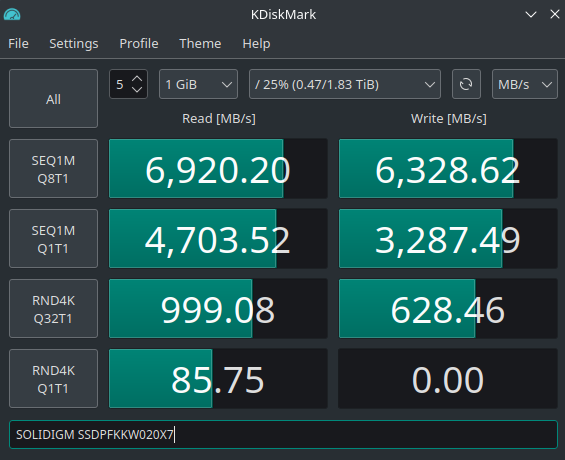
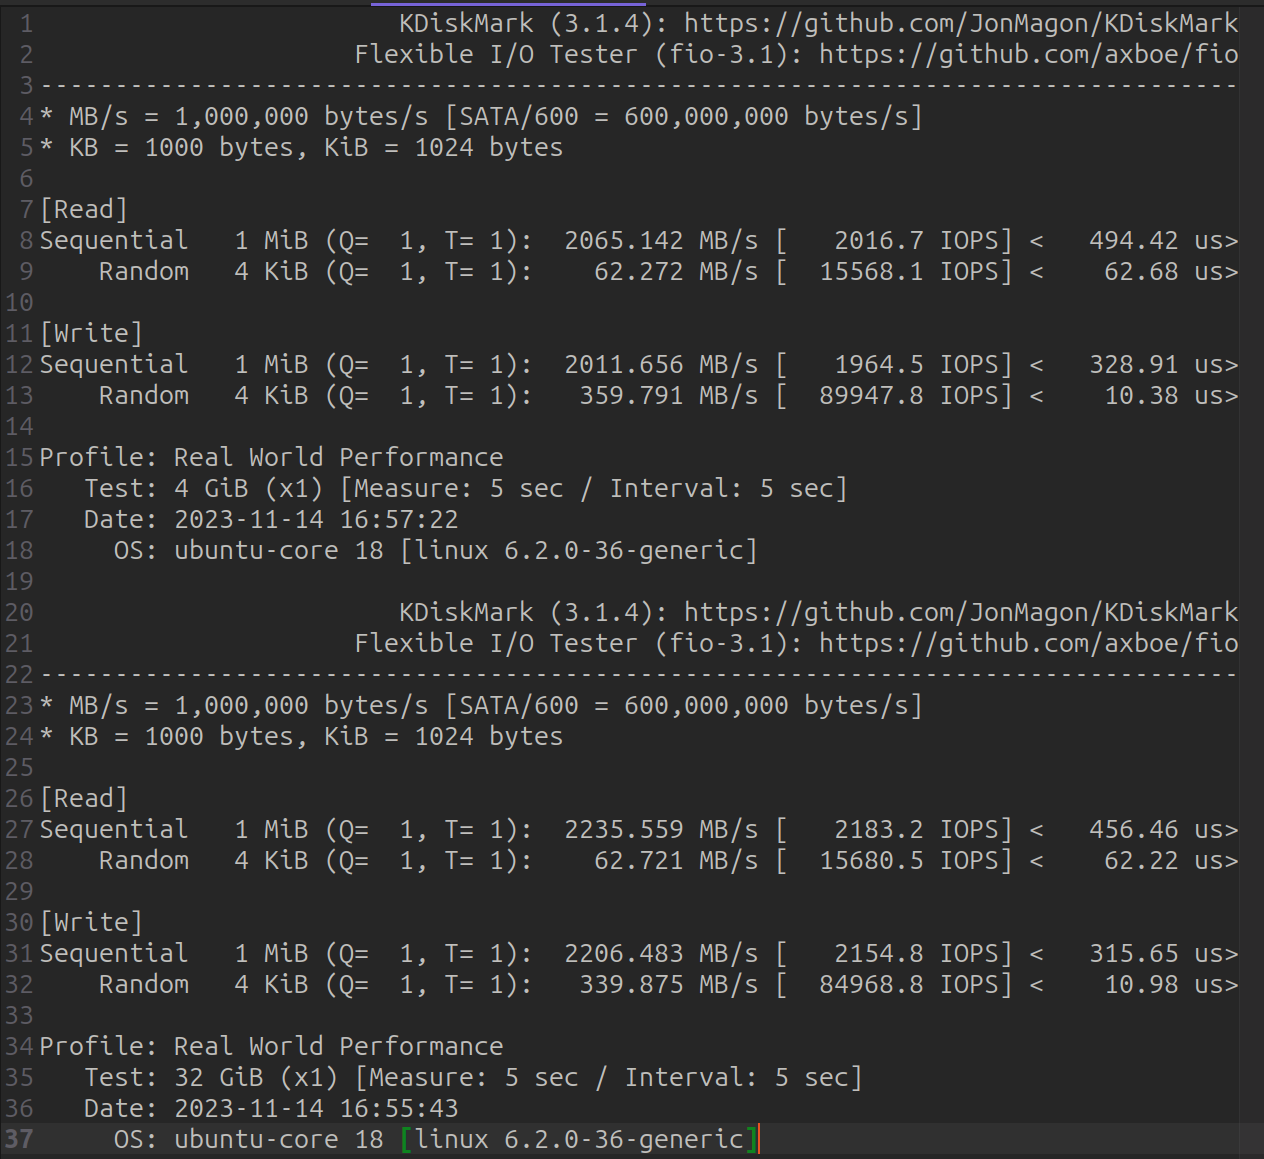
The new video about Solidigm was released today. Very interesting… I want to know how well they work in Linux. Here is what I found when I searched:

Here are the questions I still have:

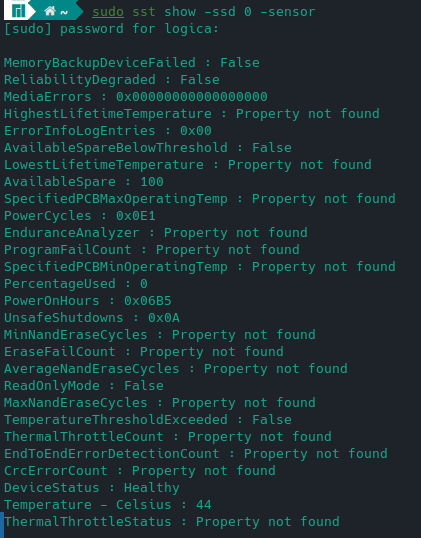
  • Do these devices have Power Loss Protection?

  • How well do they work when using LUKS or other encryption types? I remember some very early SSD controllers (sandforce maybe?) did some tricks to improve performance and reduce wear, like block deduplication, Windows specific things, etc (this was all pre-TRIM I think) but those fell down in the face of writing essentially random data. Still, the firmware could probably still optimize around which blocks seem to get used the most…

  • Is there any plan for an upstreamed Linux driver?

4 Likes

I am using the P44 Pro 2TB on Arch with my T14s Gen3 AMD.

So far everything works perfectly fine but I wonder if the “special windows solidigm driver” is available in Linux as well?

@taggart Thank you you kind soul I have four of these bad boys and was going to make a few posts on them.

My write speed is poopy, now I have something to start chewing on.

I am wondering this too about the driver. Just picked one up for the new build

Hm I cant really see a speed difference between Arch vs Win10. You guys got benchmarks that show differences?

One of the things that was mentioned on the L1 show was that you may not necessarily see a performance gain you are getting in a typical benchmark. The special Windows driver is supposed to be able to prefetch additional data during something like a game load where the game keeps requesting a bunch of tiny data bits, but the addresses are all sequential, the driver will start grabbing a larger sequential block to improve performance and keep the extra data cached to give it to the game as those next addresses keep coming up. A benchmark wont show that because sequential load is already sequential and random load is fully random and not a bunch of “randoms” at sequential addresses. It would be interesting to see this added to a benchmark like Crystal Disk to simulate what some drives can do with their software side vs others that dont have a software component.

1 Like

Which benchmark are you using. I get really crappy sustained RW but researching if it’s for a separate reason.

KDEDiskMark and CrystalDiskMark

Has anyone had luck fine tuning their drive in Linux. Looking for tips given my performance is subpar

what sorts of numbers should we be expecting?


KDiskMark is giving me some trouble:
‘Benchmark could not be prepared. Bad FIO output’
Screenshot_20231102_235207

got it to go:
Screenshot_20231102_235047

sst output:
sst show -ssd

-sensor for PowerOnHours or Temperature.
sst show -ssd 0 -sensor
Screenshot_20231103_000301

I got FIO errors on some Linux 6.5 versions, and had to skip those. Check if you’re on a revision of 6.5.3 or later, and see if there’s an update. I think 6.5.8 it was resolved by then.

thanks. updated kernel. No longer gets FIO error, but overall slightly worse numbers on this run. same default settings.

Screenshot_20231103_005654

and KDiskMark still seems to be struggling to finish runs

check sudo dmesg, FIO may still be crashing out and just not pushing the error.

Use FIO in the command line. If there is an error, FIO tells you what it is all about. KDiskmark is a nice GUI tool if you’re lazy with typing and looks very similar to CrystalDiskmark. I still miss some flags I occasionally use.

86-92 MB/s on 4k randwrite QD=1…that’s really good

correct you are. dmesg says:

[75580.222231] fio[162402]: segfault at 0 ip 0000000000000000 sp 00007ffcb7309d48 error 14 in fio[563f98278000+1b000] likely on CPU 16 (core 4, socket 0)
[75580.222239] Code: Unable to access opcode bytes at 0xffffffffffffffd6.
[75602.197847] kdiskmark_helpe (162466): drop_caches: 1
[75602.755596] kdiskmark_helpe (162466): drop_caches: 1
[75603.317846] kdiskmark_helpe (162466): drop_caches: 1
[75603.872592] kdiskmark_helpe (162466): drop_caches: 1
[75604.438325] kdiskmark_helpe (162466): drop_caches: 1
[75604.464101] fio[162606]: segfault at 0 ip 0000000000000000 sp 00007fff68f75e78 error 14 in fio[55672c6da000+1b000] likely on CPU 17 (core 5, socket 0)
[75604.464109] Code: Unable to access opcode bytes at 0xffffffffffffffd6.

What are some sensible defaults to test? I just ran this based on a search:

fio --name=random-write --ioengine=posixaio --rw=randwrite --bs=4k --numjobs=1 --size=4g --iodepth=1 --runtime=60 --time_based --end_fsync=1

Summary
random-write: (g=0): rw=randwrite, bs=(R) 4096B-4096B, (W) 4096B-4096B, (T) 4096B-4096B, ioengine=posixaio, iodepth=1
fio-3.35
Starting 1 process
random-write: Laying out IO file (1 file / 4096MiB)
Jobs: 1 (f=1): [w(1)][100.0%][w=270MiB/s][w=69.1k IOPS][eta 00m:00s]
random-write: (groupid=0, jobs=1): err= 0: pid=169102: Sun Nov  5 17:23:34 2023
  write: IOPS=69.0k, BW=270MiB/s (283MB/s)(15.9GiB/60491msec); 0 zone resets
    slat (nsec): min=411, max=95480, avg=941.39, stdev=349.24
    clat (nsec): min=271, max=7285.5k, avg=12151.65, stdev=8615.97
     lat (usec): min=9, max=7286, avg=13.09, stdev= 8.67
    clat percentiles (nsec):
     |  1.00th=[ 9792],  5.00th=[10048], 10.00th=[10432], 20.00th=[10688],
     | 30.00th=[10944], 40.00th=[11456], 50.00th=[11840], 60.00th=[12480],
     | 70.00th=[12864], 80.00th=[13376], 90.00th=[14272], 95.00th=[14912],
     | 99.00th=[16768], 99.50th=[18048], 99.90th=[28544], 99.95th=[33536],
     | 99.99th=[45312]
   bw (  KiB/s): min=23200, max=357624, per=100.00%, avg=290699.16, stdev=51811.67, samples=114
   iops        : min= 5800, max=89406, avg=72674.77, stdev=12952.91, samples=114
  lat (nsec)   : 500=0.01%
  lat (usec)   : 10=4.34%, 20=95.38%, 50=0.27%, 100=0.01%, 250=0.01%
  lat (usec)   : 500=0.01%, 750=0.01%
  lat (msec)   : 4=0.01%, 10=0.01%
  cpu          : usr=10.09%, sys=25.97%, ctx=4175471, majf=0, minf=20
  IO depths    : 1=100.0%, 2=0.0%, 4=0.0%, 8=0.0%, 16=0.0%, 32=0.0%, >=64=0.0%
     submit    : 0=0.0%, 4=100.0%, 8=0.0%, 16=0.0%, 32=0.0%, 64=0.0%, >=64=0.0%
     complete  : 0=0.0%, 4=100.0%, 8=0.0%, 16=0.0%, 32=0.0%, 64=0.0%, >=64=0.0%
     issued rwts: total=0,4175222,0,0 short=0,0,0,0 dropped=0,0,0,0
     latency   : target=0, window=0, percentile=100.00%, depth=1

Run status group 0 (all jobs):
  WRITE: bw=270MiB/s (283MB/s), 270MiB/s-270MiB/s (283MB/s-283MB/s), io=15.9GiB (17.1GB), run=60491-60491msec

Disk stats (read/write):
  nvme0n1: ios=59/1827256, merge=0/5068, ticks=92/215704, in_queue=215873, util=15.61%

I’m not sure what exactly I am looking at, but anecdotally I am happy with the overall performance of my machine so far during regular use.

Will run any benchmarks and post results for comparison.

1 Like

Getting crummy numbers on bench marking. I don’t know where to start. Can anyone shed some light on this.