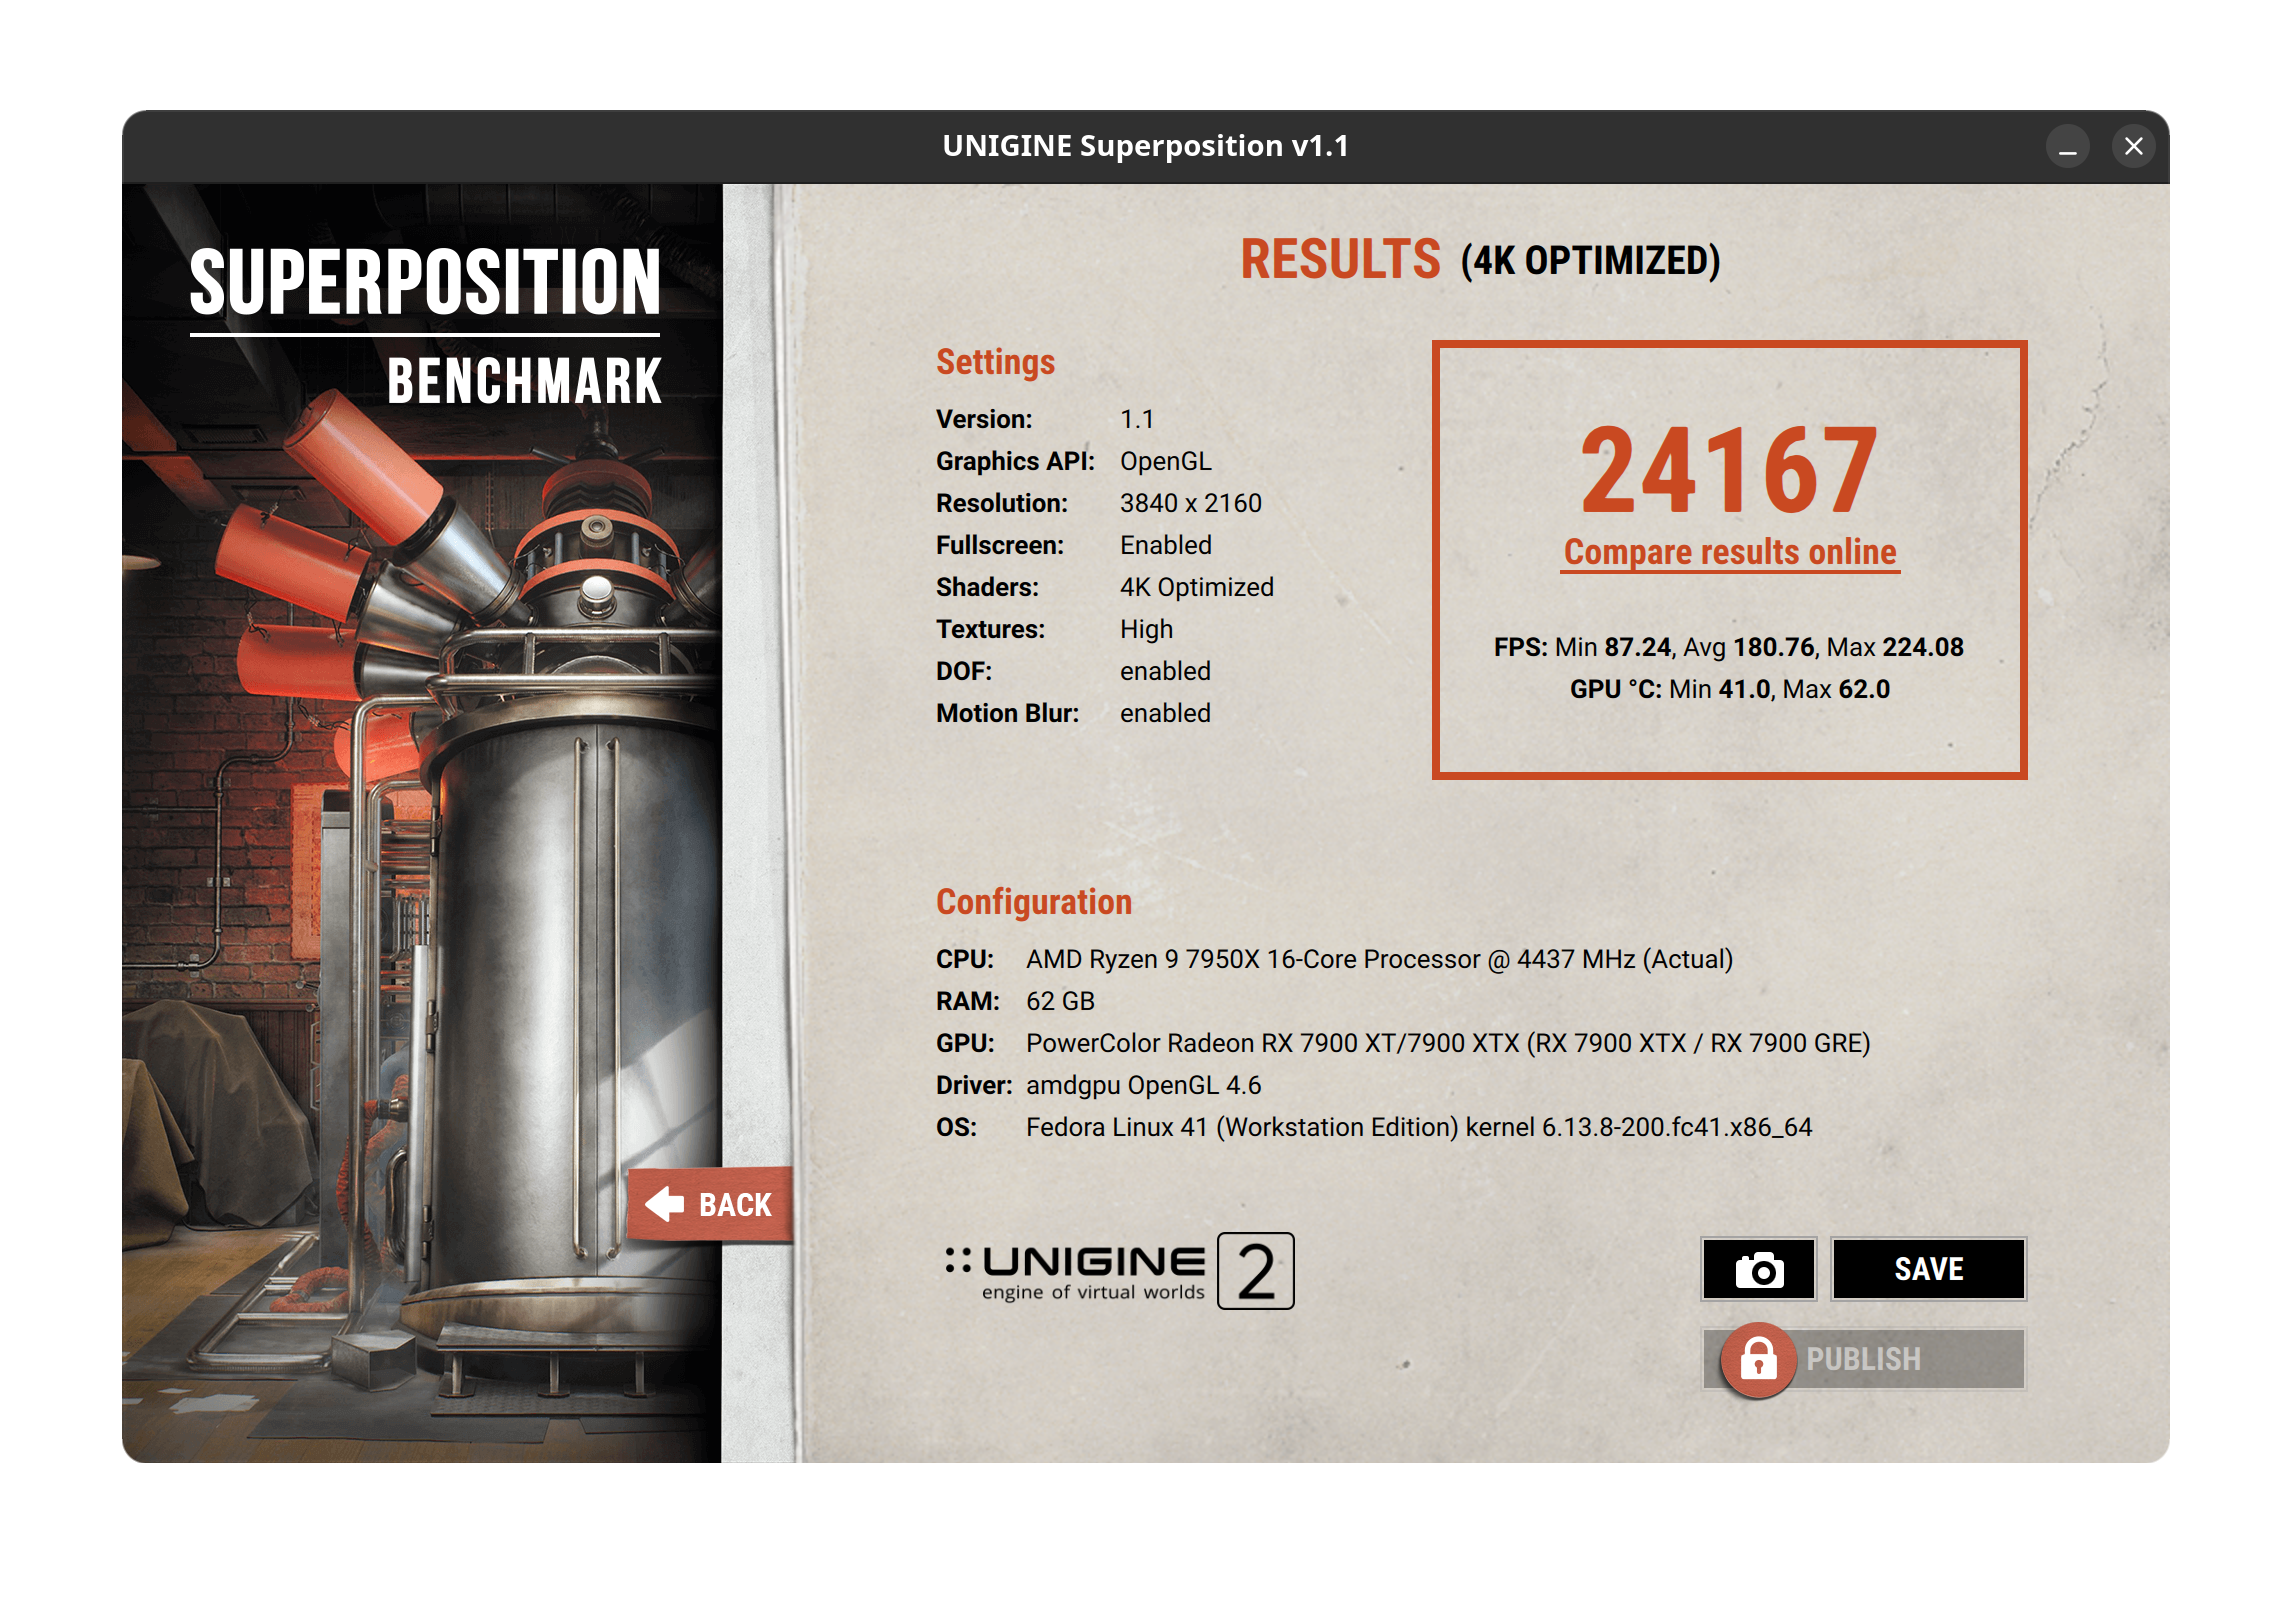
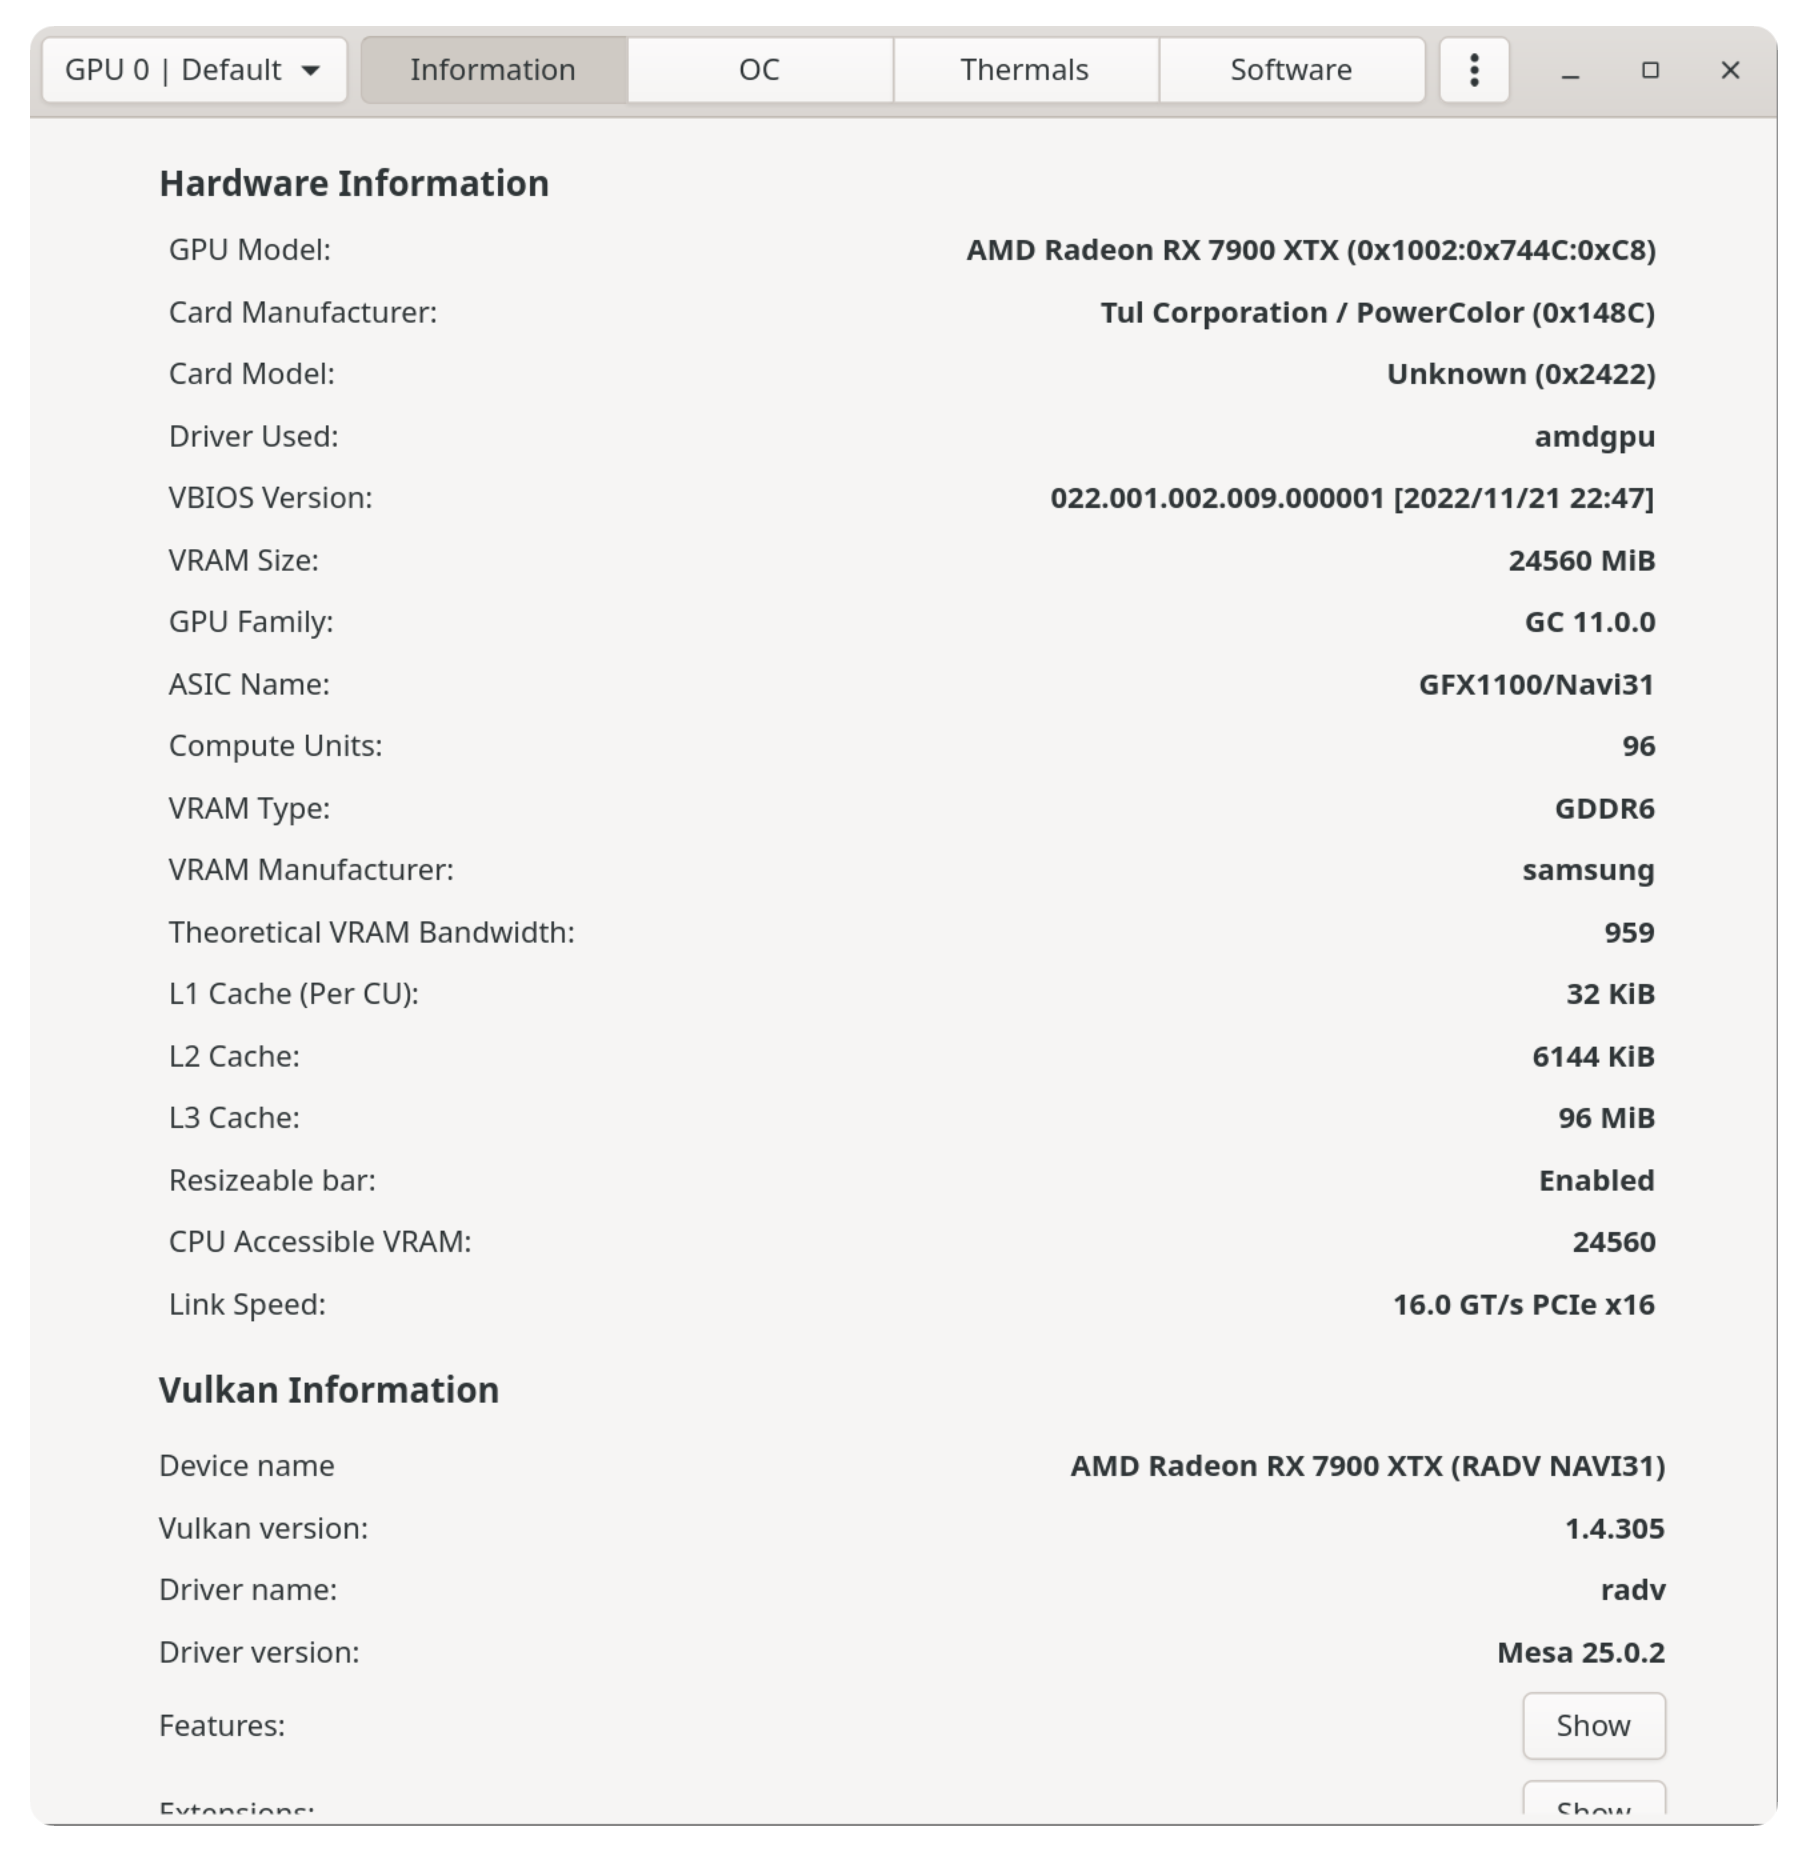
So, every time Fedora updates the kernel, or Mesa, I run Unigine Superposition to see if it made a difference. I ran one again just a bit ago and received the highest score I have personally seen on my machine. However…, it really isn’t that great when looking at the scores, or an identical score and the specs of that machine versus my machine. Granted, I have a very conservative “overclock” of my GPU and nothing to overclock the CPU or RAM other than PBO/ AI Overclocking on my motherboard, and the EXPO profile of my RAM.
My specs are as follows
7950X
RX 7900XTX Powercolor Red Devil
64GB of CL30 DDR5 6000 RAM
Screenshots follow. If you have ideas, I would be happy to hear them.
Ok, so why do you expect a better score on a gpu benchmark when both benchmarks are using the same gpu?
There are multiple cases of over overclocking a gpu can actually worsen a benchmark score, have you benchmarked standard clocks and maybe a few steps in-between, to verify your overclock.
i guess the other big difference would be the benchmark your comparing to was run from windows 11, do you have the ability to benchmark your sytem from windows 11 for comparison?
Minor kernel release is not likely to introduce any changes that will improve your performance, unless there is bugfix for something that affected you.
Composite score improved by so little 24167 —> 24234 +0,27% , its more likely randomness in play.
If you want actionable data, you must performs battery of test for the same configuration and get a normal range of values.
Conf A: sample size 20 , score ( min 24120 , av 2199, max 24235 )
Only singificant deviation outside of that are true improvements or regressions.