I ran some R code (training ML models) from an old project previously run on an i7 4710HQ Windows 7 laptop years ago, and was shocked to find that the 2700X with Fedora 28 runs it ~20% more slowly! Even though it has twice the cores and is ~1GHz faster.
I ran a bunch of scenarios on the 2700X, varying the number of threads, CPB, SMT:
user
system
elapsed
OS
CPU
Threads
Turbo/CPB
HT/SMT
Load average
126.421
0.532
2275.998
Fedora 28
R7 2700X
8
ON
OFF
>42
126.583
0.541
2324.118
Fedora 28
R7 2700X
7
ON
OFF
?
136.636
0.574
2433.931
Fedora 28
R7 2700X
7
OFF
OFF
?
221.49
7.48
2679.77
Windows 7
i7 4710HQ
7
ON
ON
?
155.427
0.555
3233.690
Fedora 28
R7 2700X
15
ON
ON
>100
168.859
0.609
3247.277
Fedora 28
R7 2700X
15
ON
ON
?
173.312
0.650
3250.313
Fedora 28
R7 2700X
16
ON
ON
>70
161.403
0.611
3270.098
Fedora 28
R7 2700X
14
ON
ON
?
162.120
0.540
3442.758
Fedora 28
R7 2700X
7
ON
ON
?
Note that in some cases the computers were being used for other moderate tasks, so consider these ballpark figures with a generous margin of error.
Uncontrolled variables include:
Windows 7 vs Fedora 28.
R version R-3.5.0-4.fc28 from repo (no custom optimized libraries etc) vs don’t remember whatever the current version was years ago
versions of various packages called in the code. current now vs years ago
In summary, disabling SMT got the 2700X to complete more quickly, but still not as quickly as I would expect.
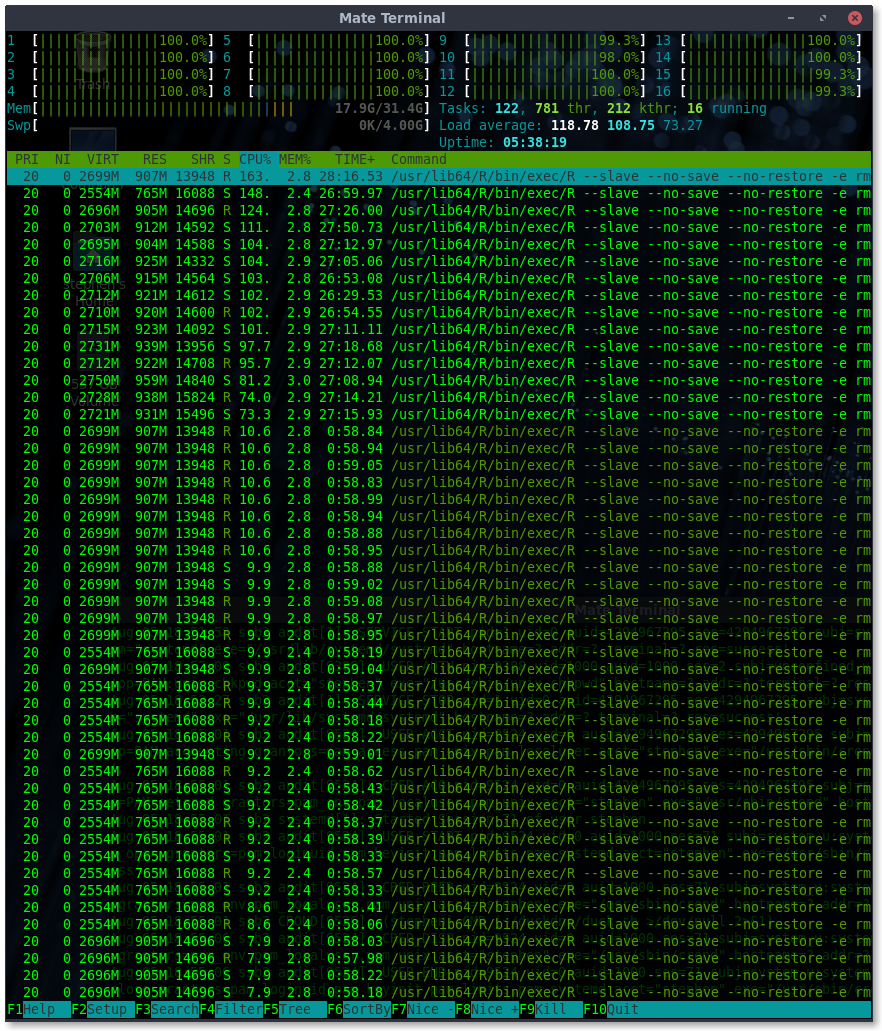
During a few runs I had htop/glances open and happened to notice that the load averages were very high, i.e. much more than 16 or 8. Death of performance by context switching?
Considering that you where using an entirely older different version of R (+ associated libraries) in the past for the 4710HQ makes it relatively difficult and unrealistic to compare these results.
The software may have changed substantially over time. So it’s really an apples to oranges comparison.
There may be hardware processing differences and software performance regressions, particularly somewhere in the external libraries code.
Without a more current test for the 4710 one can’t and shouldn’t use this data to make conclusions or future decisions based on this data.
Turning off SMT shouldn’t even be a factor in speeding things up. But since it does I suspect a more software optimization related problem.
@tkoham R is single threaded, but there are packages like doParallel to create a parallelized backend. Some packages implement parallelized code which can then take advantage of this.
If the IPC of both CPUs is around the same, then why would the one with double the cores and 15-50% faster clock speed still be slower?
@catsay Yes, I wish I could run the test again on the 4710HQ. That wasn’t my machine though. I’ll try to get them to run it again.
What is it about SMT that would impact performance so badly?
What does it mean when htop lists processes in a darker color? glances did not list those.
When running for n cores, there are n processes listed in both htop and glances, but htop lists an additional n^2 processes in a dark color.
If those n^2 are real processes, it might explain the high load averages, the overloading of the system, and the slow performance. Pure speculation: maybe some packages parallelize by default or badly and end up “double parallelizing” each already-parallelized thread?
EDIT: Seems the dark entries are process threads. n^2 threads running doesn’t sound good for performance. Now to figure out why this happens and why SMT would make it worse.
train, rfe, sbf, bag and avNNet were given an additional argument in their respective control files called allowParallel that defaults to TRUE. When TRUE, the code will be executed in parallel if a parallel backend (e.g. doMC) is registered. When allowParallel = FALSE, the parallel backend is always ignored. The use case is when rfe or sbf calls train. If a parallel backend with P processors is being used, the combination of these functions will create P^2 processes.
My code does use caret though not the functions mentioned, but this seems to be exactly what is happening.
Since it is squared, a higher core count CPU will get vastly more overloaded, and apparently in a way that hits SMT hard. At least that’s a plausible explanation.
Now I need to find what model/function is causing the nested parallelism. It wasn’t all of them and I had to watch htop to notice the squared processes show up.