AI Disclosure:
I used Claude to walk me through some troubleshooting steps I otherwise didn’t expect. For instance, Tailscale does not initialize normally for Prometheus and Grafana in the Unraid UI, so Tailscale had to be created and linked as a separate Docker container. Or, when the Miktotik switch would not work I asked Claude to help me with a custom user for scraping. I also periodically sanity-checked with Claude to make sure I was on the right track to avoid hours of frustration. Otherwise, I wanted to understand well how everything links together.
I’ve wanted better all-in-one monitoring for my Unraid server, plex server, pihole, OPNsense box, dad’s pc, mikrotik switch, etc. for a while now since it’s just cool to have, but never got around to it since it would be a sizable chunk of work to figure out something I’ve never used before… Then I realized what better time than Devember??  naturally, all of these platofrms have great monitoring systems I can individually go to, but we’re making the one-stop-shop for whatever I want to know.
Not done. WIP. Will update my list periodically. Once said and done with things talking correctly, I will customize my dashboards and probably upload the custom board for people to download. I will also be adding more and more pictures over time for other visual learners like me.
Progress
| Status | Machine | OS | Exporter | Port |
|---|---|---|---|---|
 |
big-boss | Unraid | node_exporter, smartctl_exporter, cAdvisor | 9100, 8088, 9633 |
|
little-boss | Ubuntu | node_exporter | 9100 |
 |
little-boss nvidia dash | Ubuntu | node_exporter? | ? |
 |
plex | Ubuntu (Docker) | plex-exporter | 32400 |
|
tautilli | Ubuntu (Docker) | tautulli-exporter | 9595 |
|
tdarr | Ubtuntu (Docker) | tdarr-exporter | 9596 |
|
amber-pc-win11 | Windows 11 | windows_exporter | 9182 |
|
dads-pc-win11 | Windows 11 | windows_exporter | 9182 |
|
raspberrypi-pihole | Linux | node_exporter | 9100 |
|
opnsense | FreeBSD | node_exporter plugin | 9100 |
|
mikrotik 2.5G switch | RouterOS | mktxp | 9115 |
|
xbox series x (1) | n/a | ping | 9115 |
|
xbox series x (2) | n/a | ping | 9115 |
|
cyberpower ups | n/a | apcupsd | 9162 |
prometheus setup
-todo add pics-
ts-prometheus container
-todo add pics-
link prometheus to container
-todo add pics-
permissions issue
Unraid assigns Prometheus a dummy user ID of 99:100 by default, but it doesn’t have proper permissions to access the appdata folder. This has to be fixed so it can initialize.
docker stop prometheus
chown -R 65534:65534 /mnt/user/appdata/prometheus/data
Then we just delete --user from Extra Parameters of the container.
basic prometheus.yml for us to configure slowly
global:
  scrape_interval: 15s

scrape_configs:
  - job_name: prometheus
    static_configs:
      - targets: ['localhost:9090']

  - job_name: node
    static_configs:
      - targets: ['LOCAL-IP:9100']   # Unraid
        labels:
          host: unraid

  - job_name: cadvisor
    static_configs:
      - targets: ['LOCAL-IP:8080']   # per-container stats
grafana setup
default permissions:
admin | admin
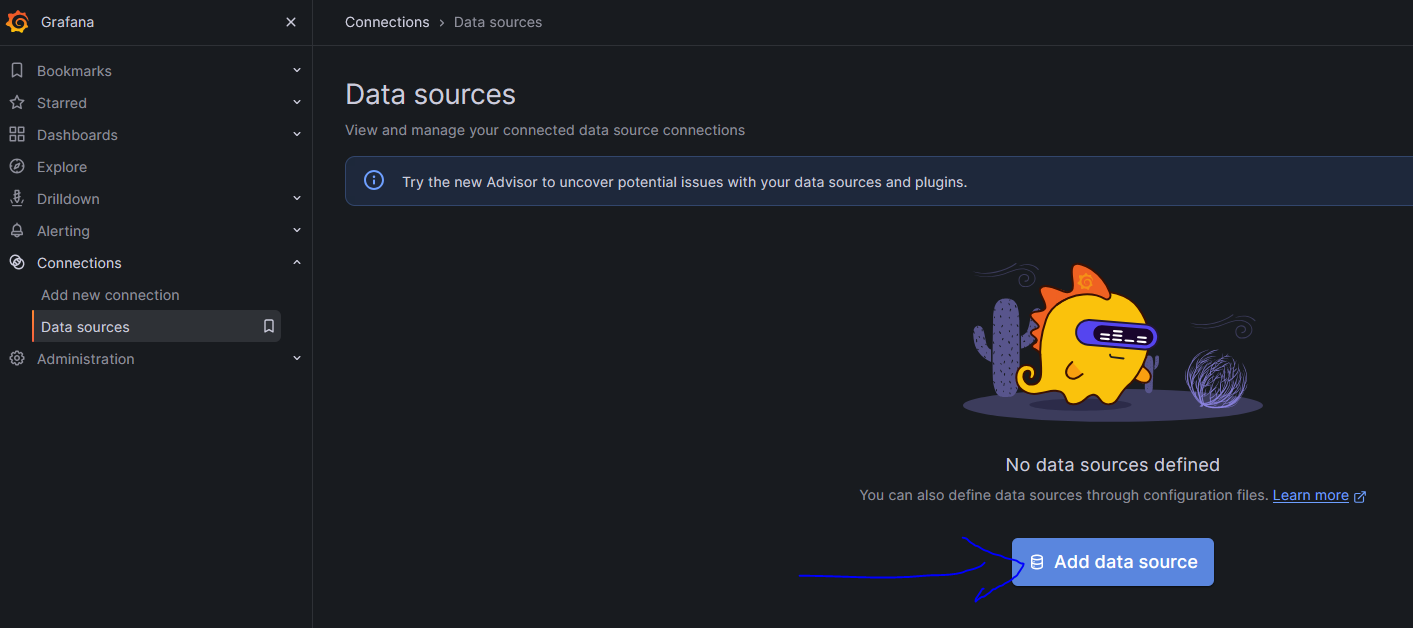
add data source (prometheus)

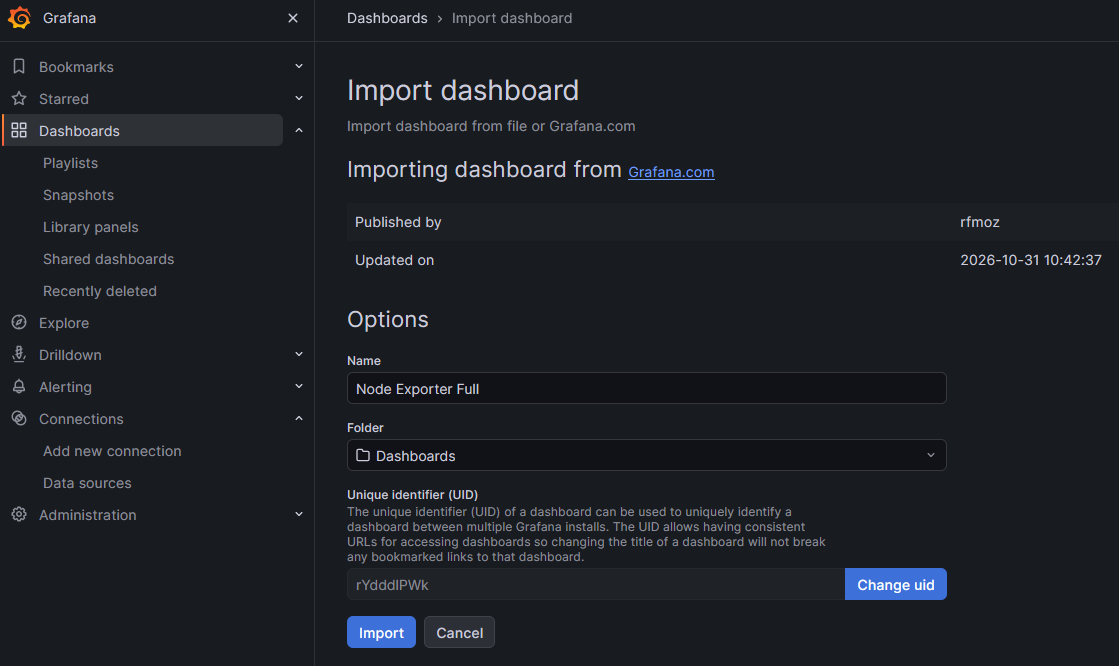
Load 1860 (Node Exporter)
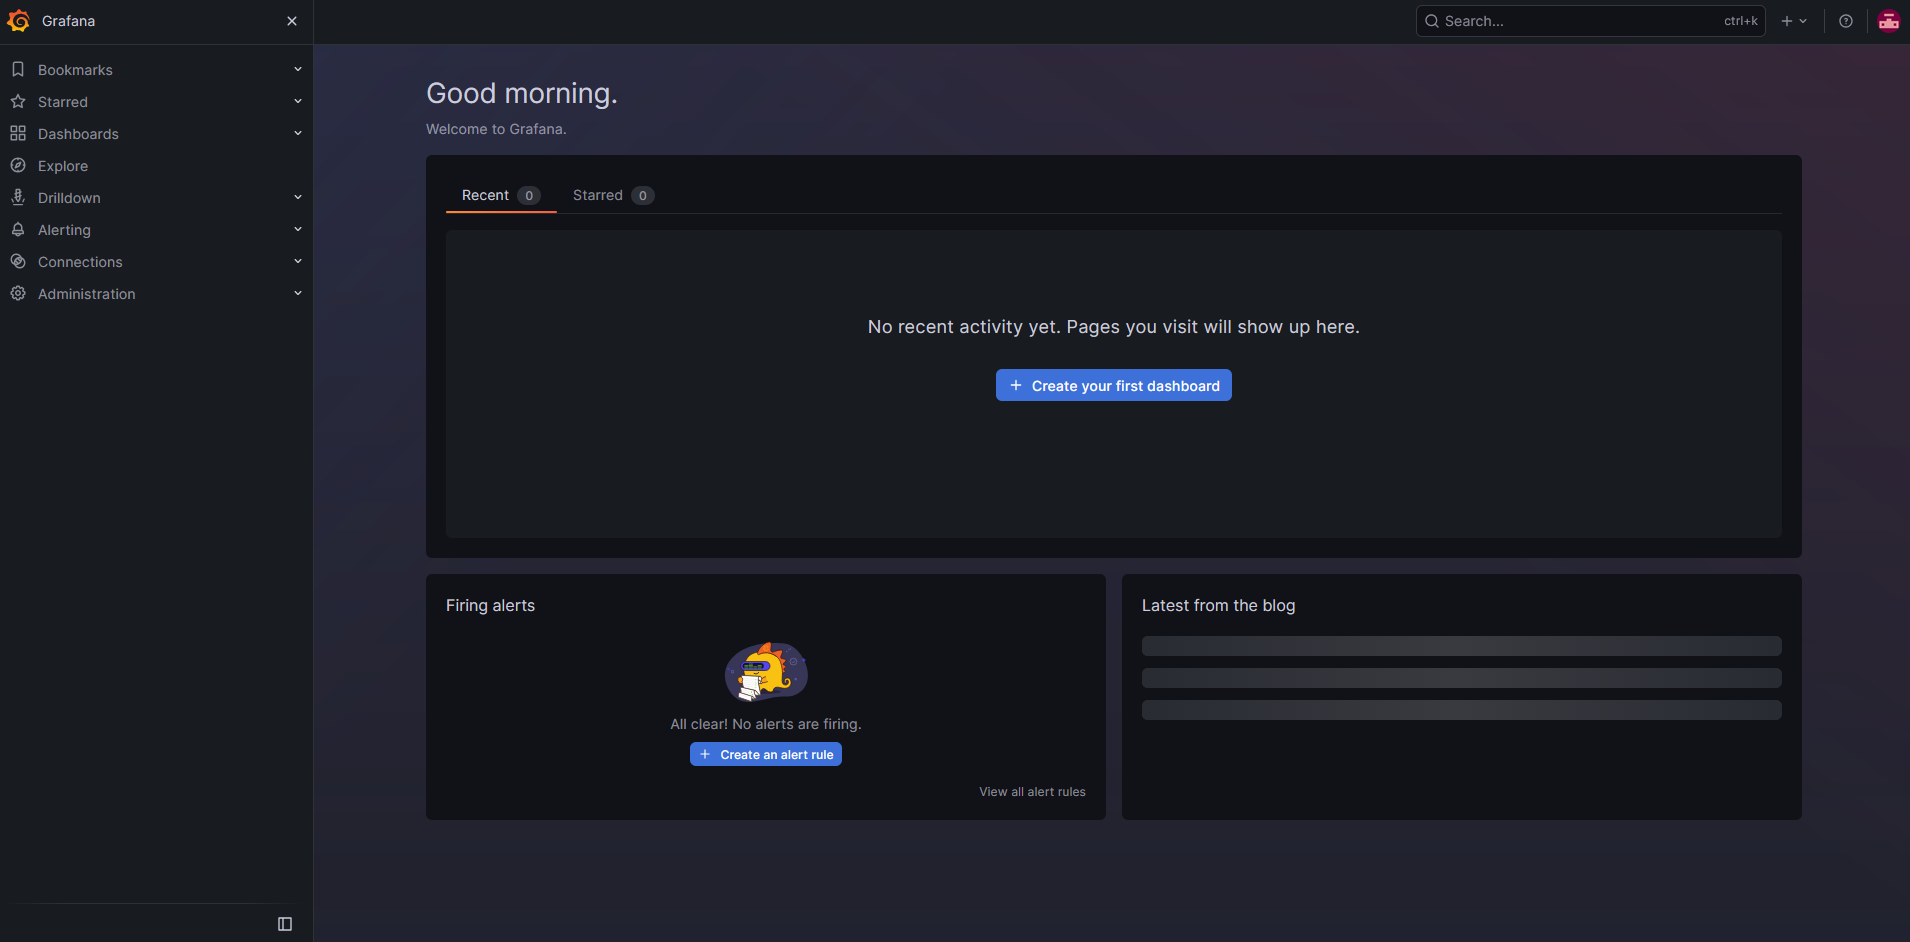
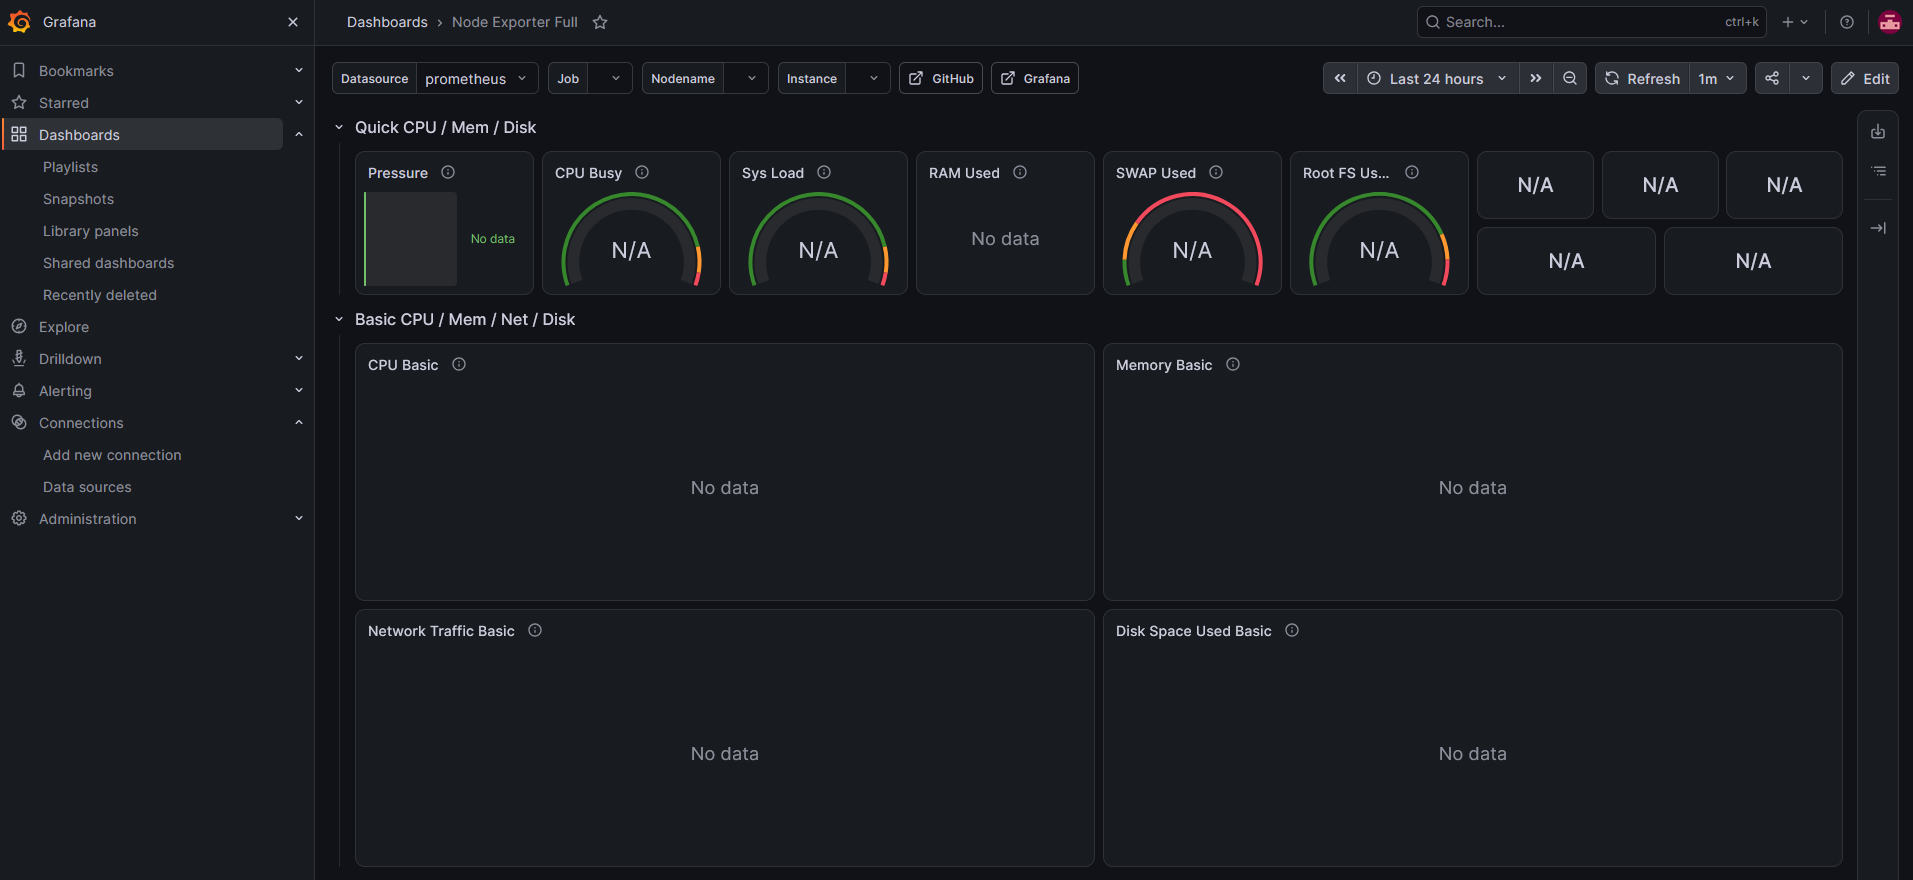
empty grafana, let’s configure!
prometheus is itself a tailnet node, so it can scrape the 100.x addresses directly. They don’t change, which suits Windows PCs on DHCP. Then, I used the LAN address for little-boss because it’s on the same network.
scraping
scrape localhost data
Node Exporter Plugin Installs
  - job_name: node
    static_configs:
      - targets: ['TAILSCALE-IP:9100']
        labels: {host: big-boss}
      - targets: ['TAILSCALE-IP:9100']
        labels: {host: little-boss}
      - targets: ['TAILSCALE-IP:9100']
        labels: {host: raspberrypi}
      - targets: ['TAILSCALE-IP:9100']
        labels: {host: opnsense}

  - job_name: windows
    static_configs:
      - targets: ['TAILSCALE-IP-IP:9182']
        labels: {host: amber-pc-win11}

  - job_name: cadvisor
    static_configs:
      - targets: ['TAILSCALE-IP:8088']
        labels: {host: big-boss}
that’s great and all, but the devices are not scraping and sending data yet
UPS
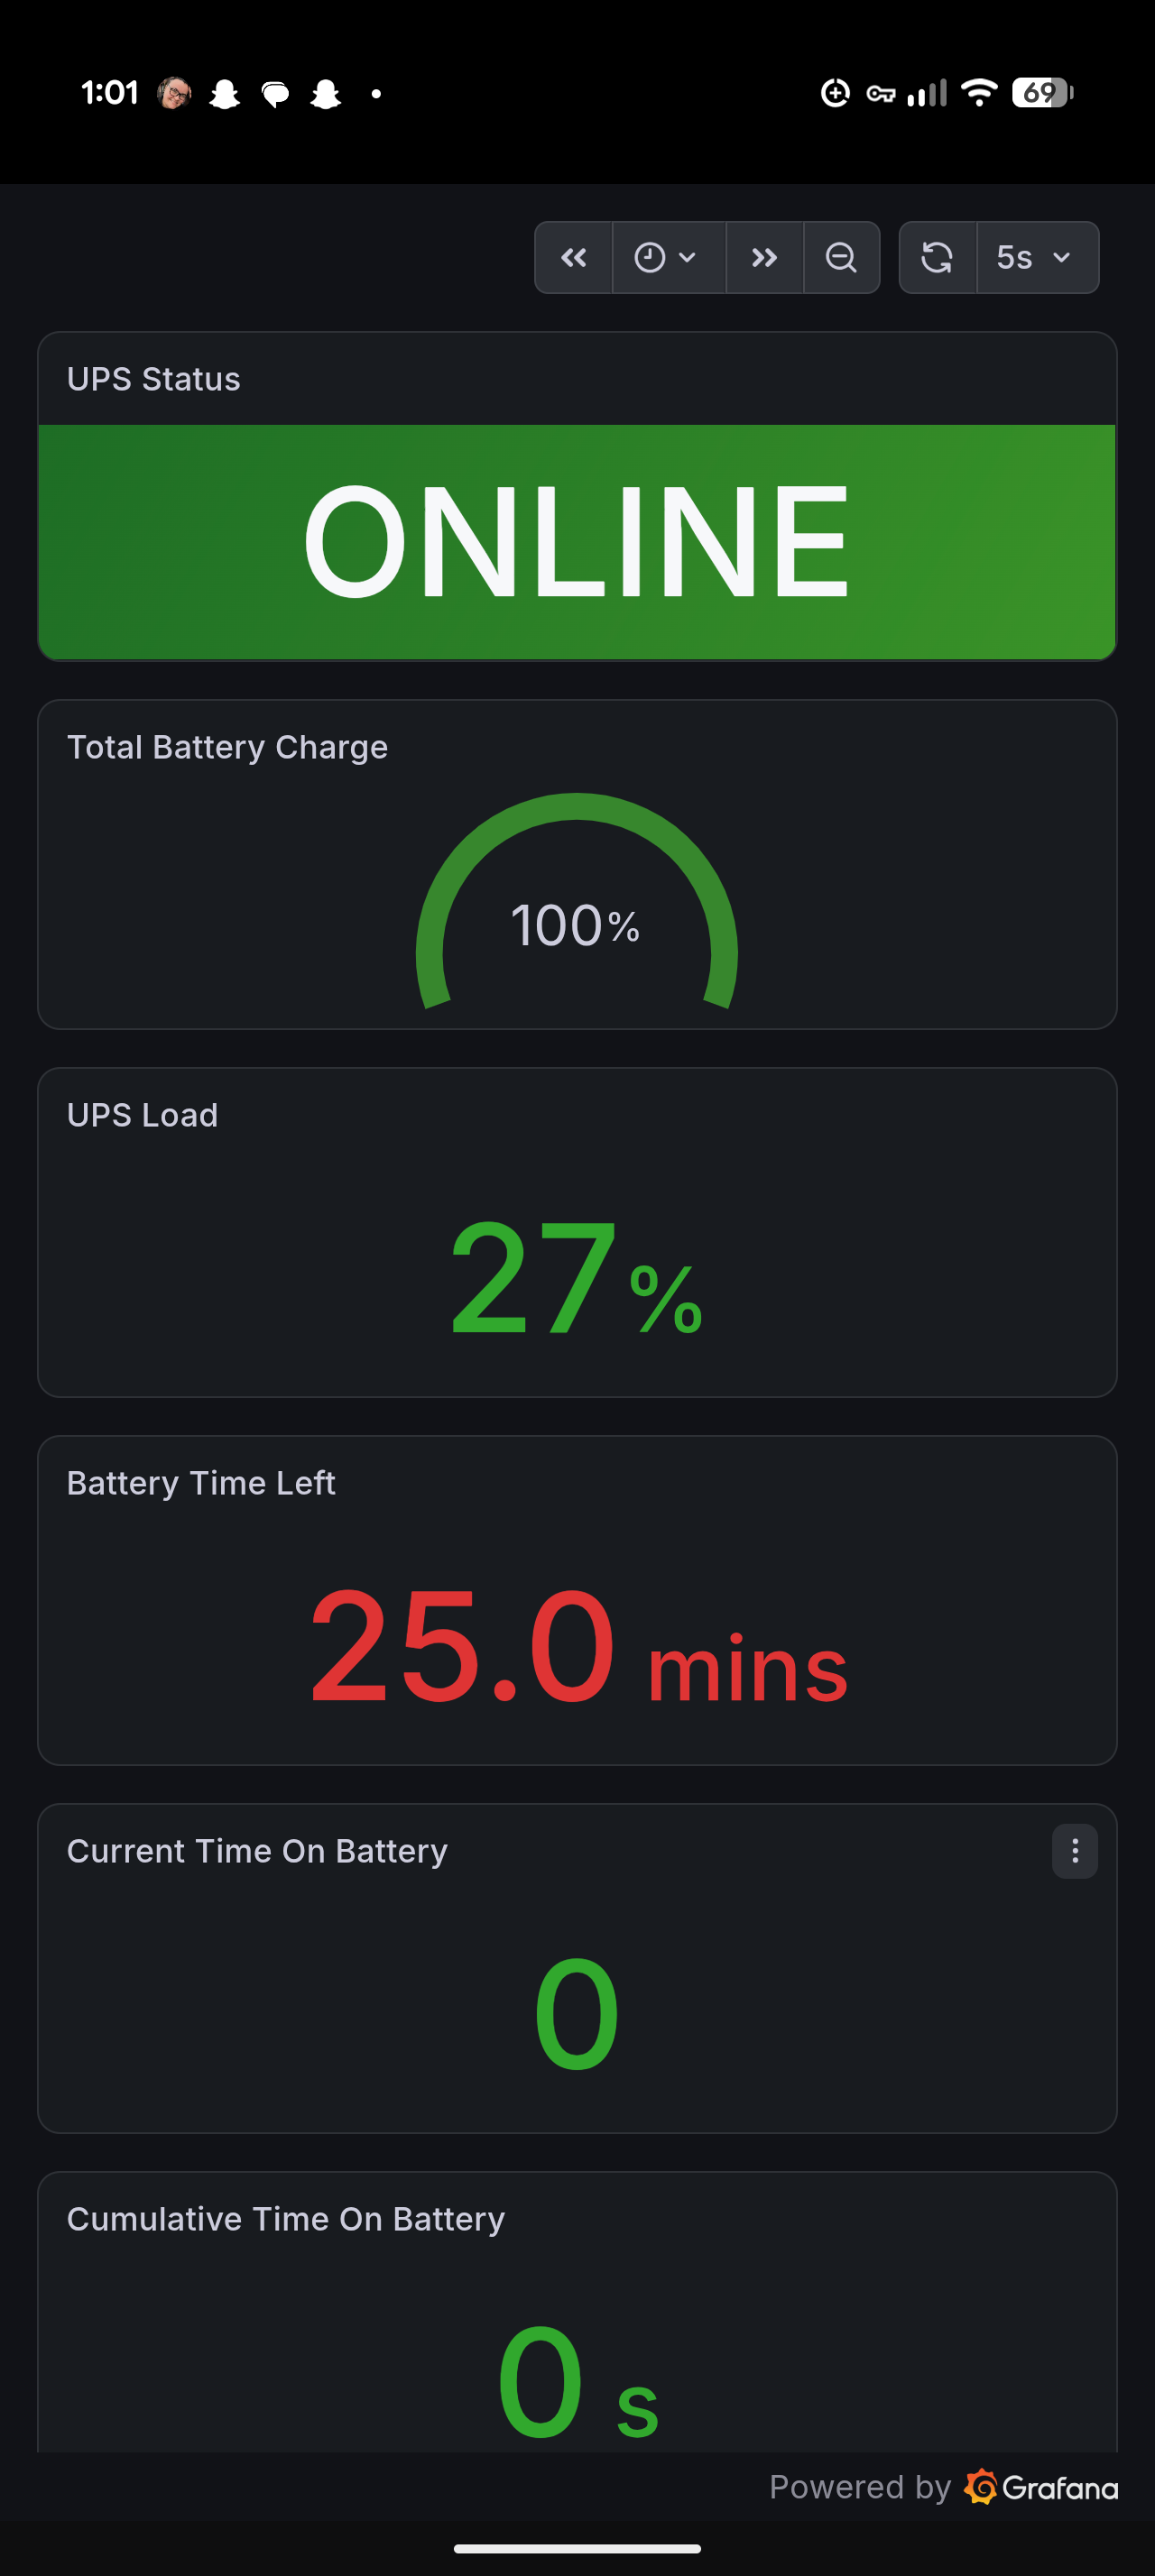
Thankfully, my UPS makes this very easy with a plug-and-play USB cable!
  - job_name: ups
    static_configs:
      - targets: ['TAILSCALE-IP:9162']
        labels: {host: big-boss-ups}
Settings → UPS Settings
Start APC UPS Deamon: Yes
Apply.
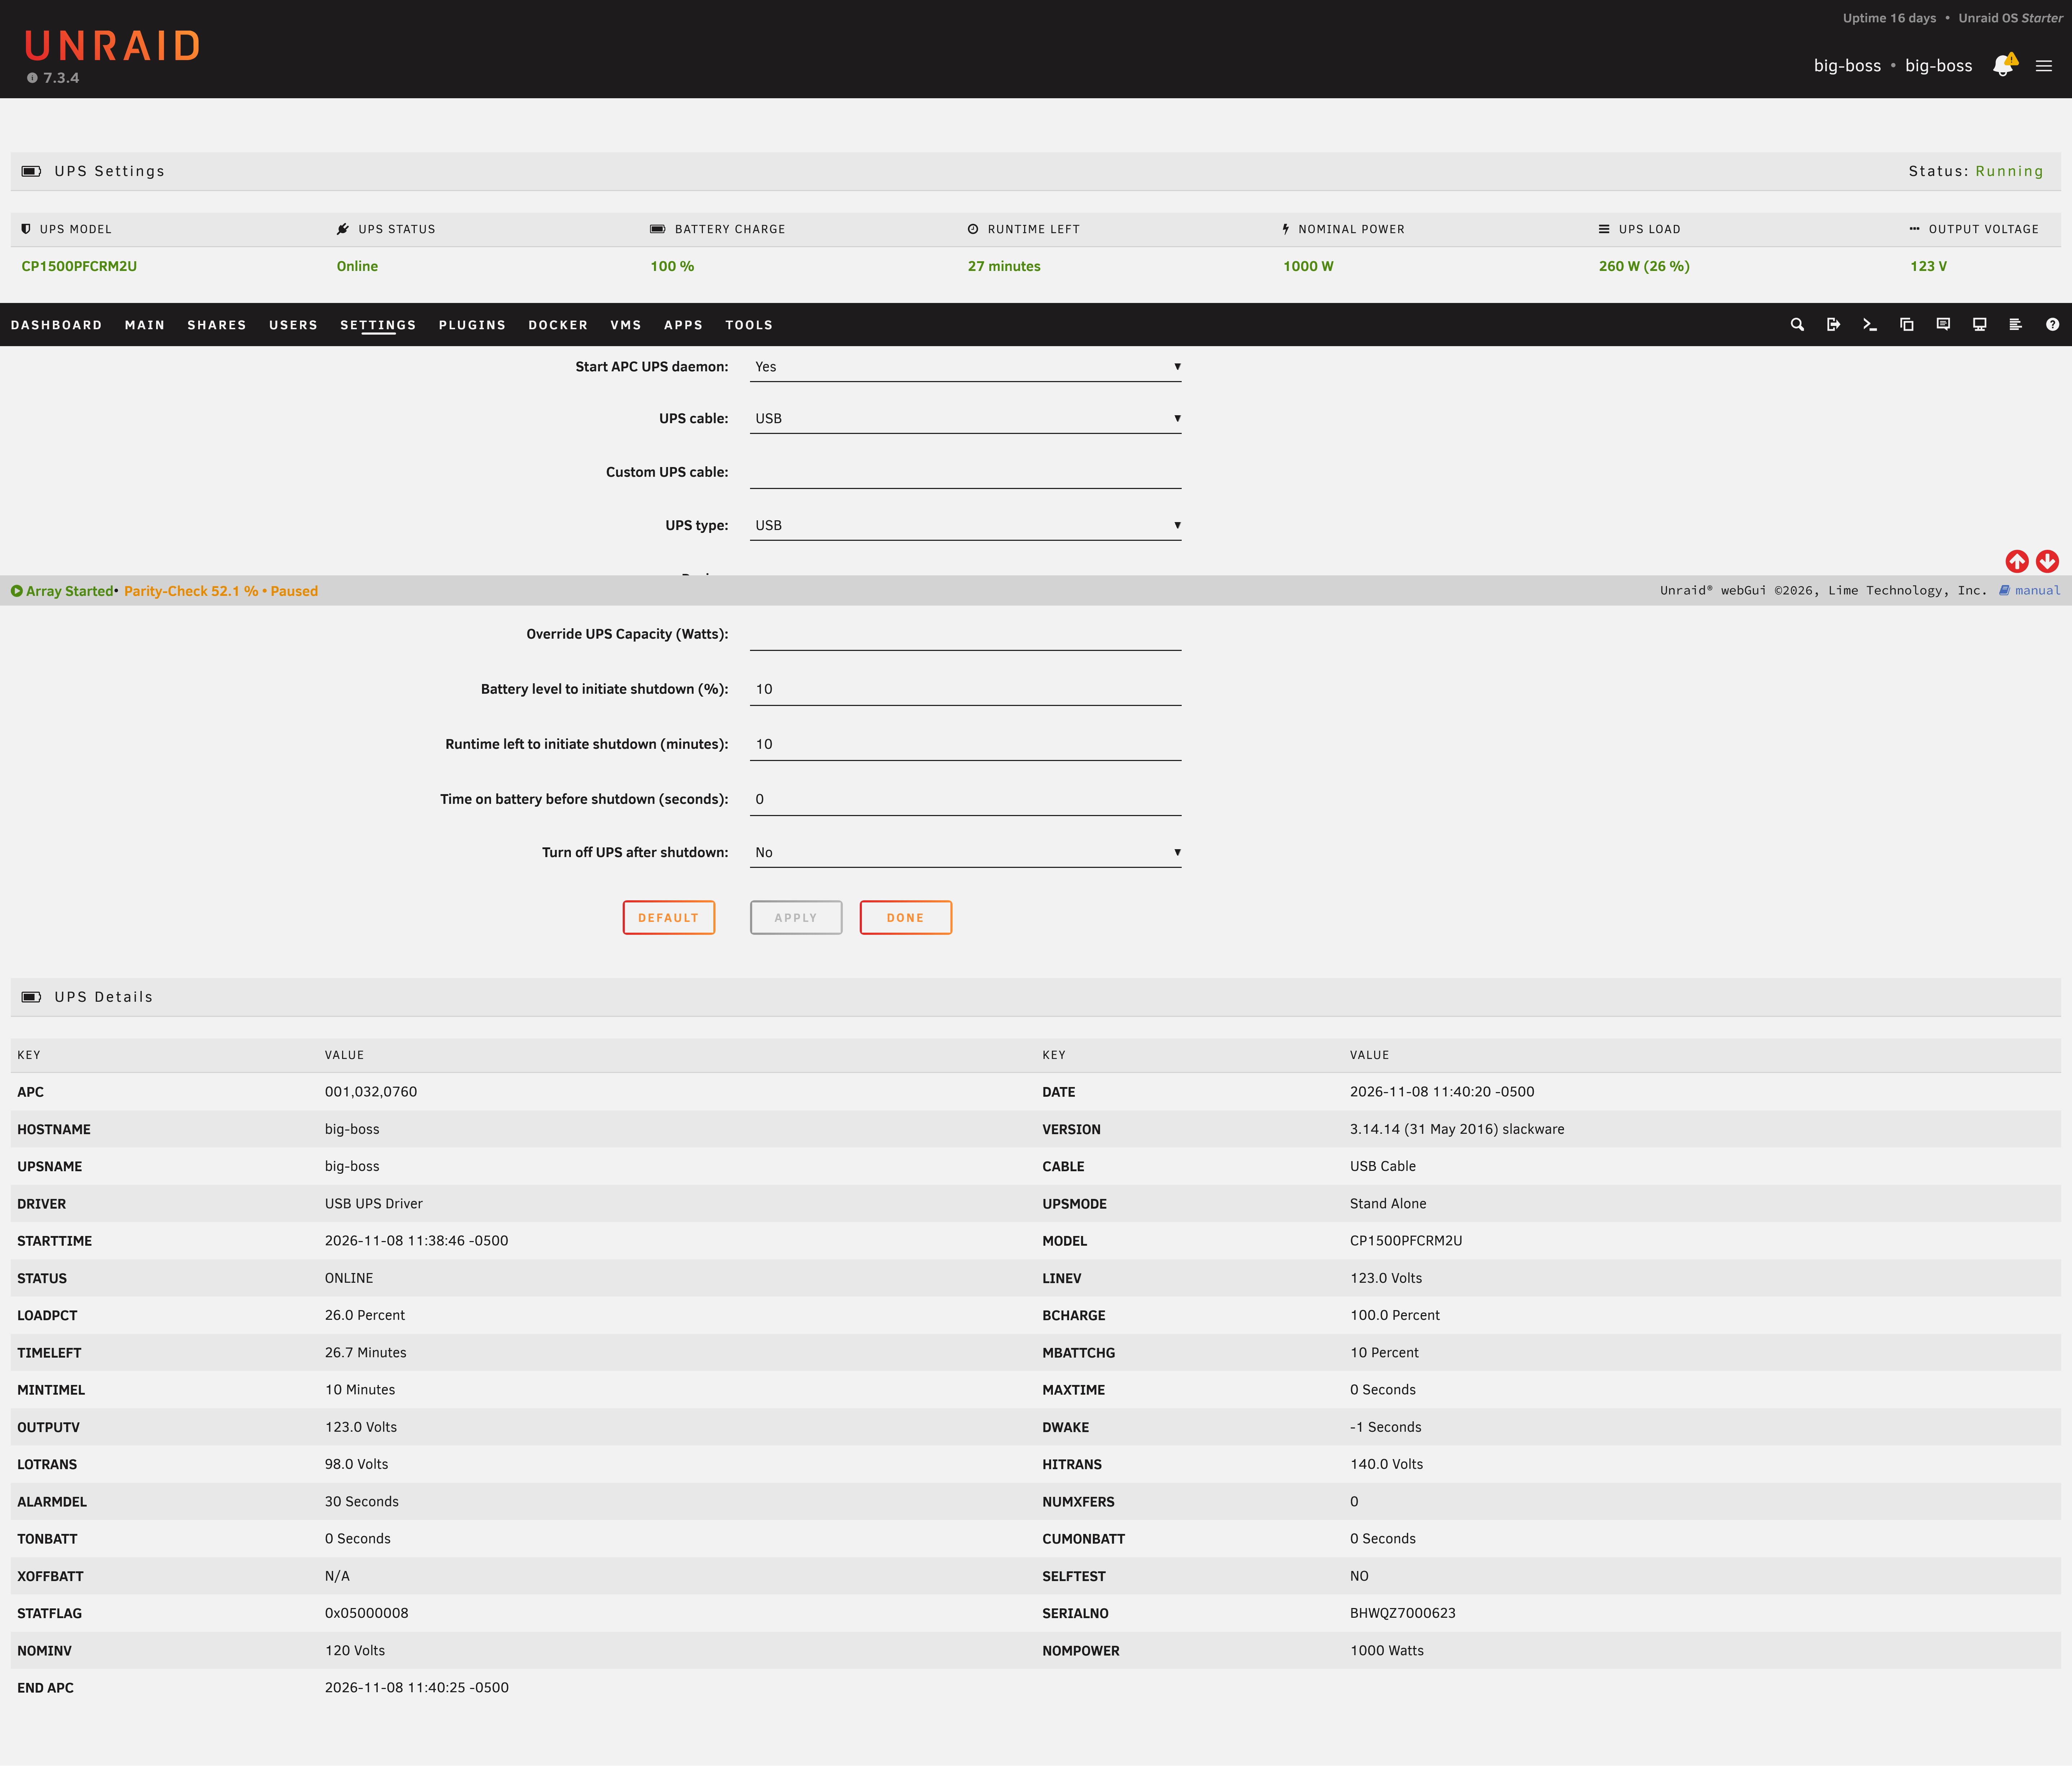
However, to see it in Prometheus, we need another container that’s not in Uraid’s community apps:
docker run -d --name=apcupsd-exporter --network=host --restart unless-stopped okaeri/apcupsd_exporter
id: 21119
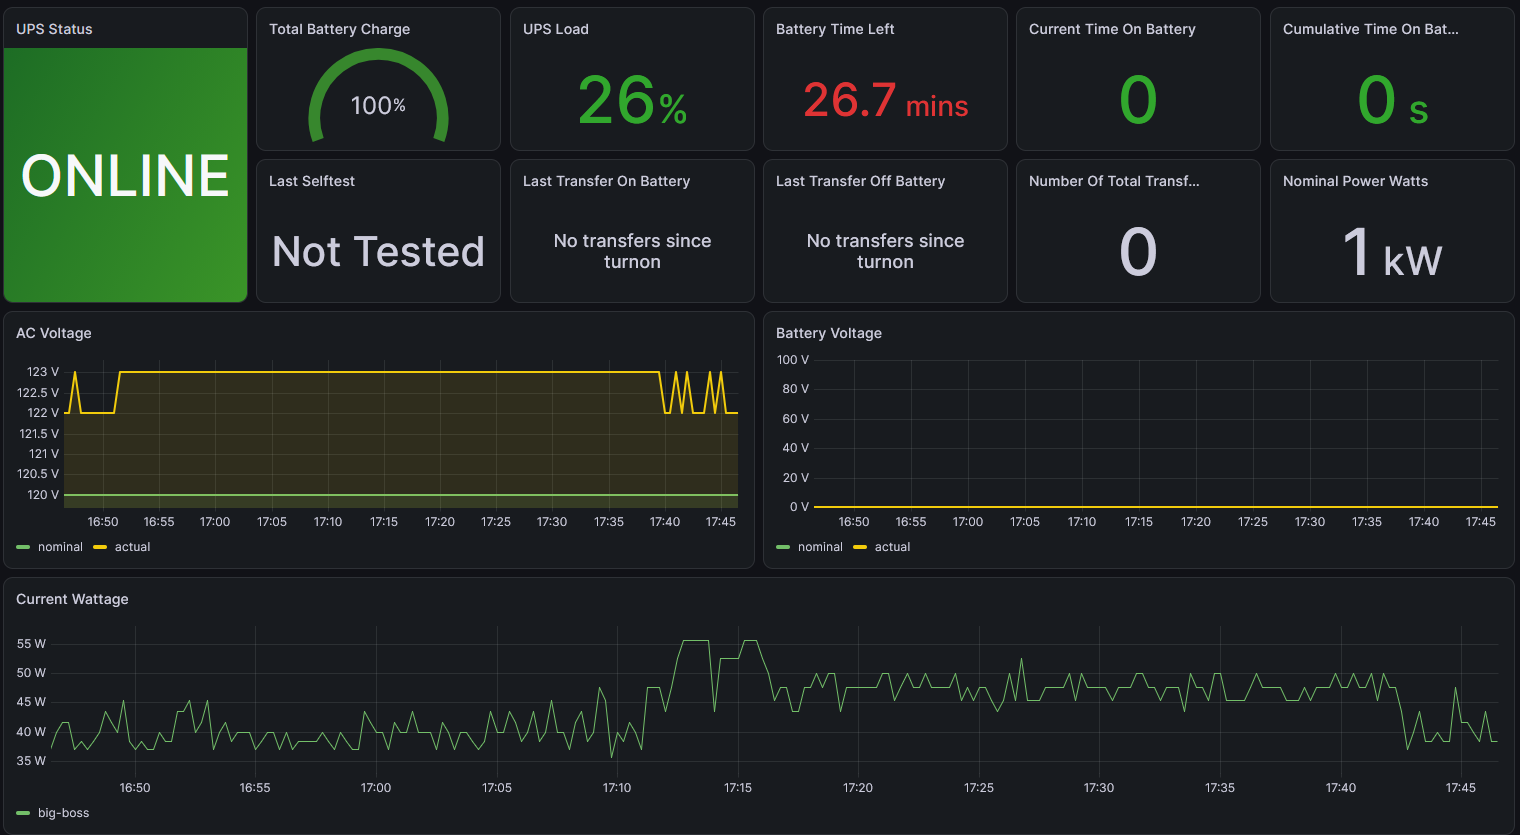
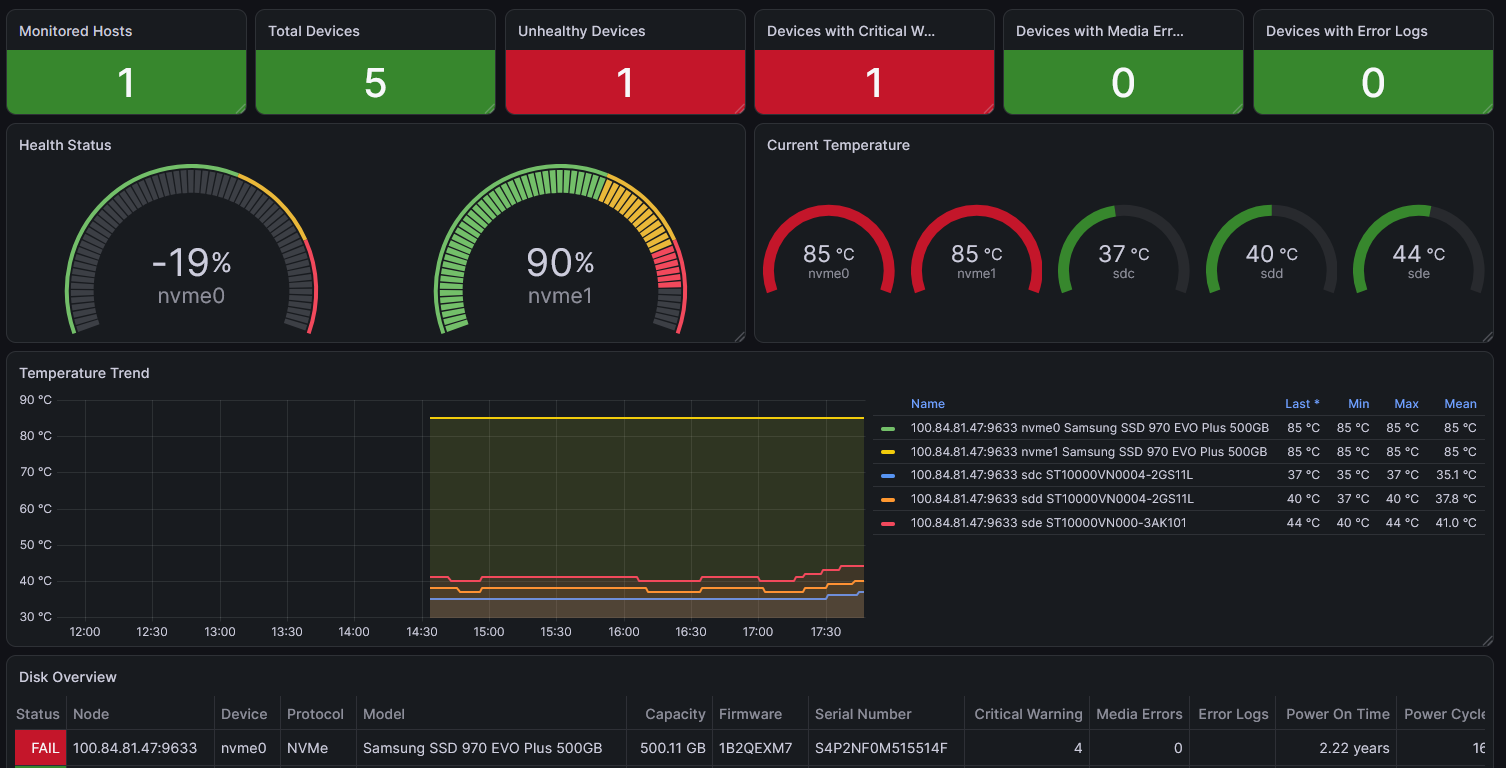
smartctl
id: 22604
This has already been helpful as I apparently have an m.2 dying… lol
plex server pc (ubuntu server) plex, tdarr, tautilli
sudo apt install prometheus-node-exporter
Should pickup auto-magically in the prometheus health overview.
docker-compose-exporters.yml
Install exporters
name: exporters

services:
  plex-exporter:
    image: cplieger/plex-exporter:latest
    container_name: plex-exporter
    restart: unless-stopped
    network_mode: host
    environment:
      PLEX_URL: "http://LAN-IP:32400"
      PLEX_TOKEN: "YOUR_PLEX_TOKEN"

  tautulli-exporter:
    image: mm404/tautulli-exporter:latest
    container_name: tautulli-exporter
    restart: unless-stopped
    network_mode: host
    environment:
      TAUTULLI_URL: "http://localhost:8181"
      TAUTULLI_API_KEY: "YOUR_TAUTULLI_API_KEY"
      METRICS_PORT: "9595"

  tdarr-exporter:
    image: homeylab/tdarr-exporter:latest
    container_name: tdarr-exporter
    restart: unless-stopped
    network_mode: host
    environment:
      TDARR_URL: "http://localhost:8265"
      PROMETHEUS_PORT: "9596"
start containers
$ sudo docker compose -f docker-compose-exporters.yml up -d
curl -s http://localhost:9594/metrics | head -5
curl -s http://localhost:9595/metrics | head -5
curl -s http://localhost:9596/metrics | head -5
[+] up 33/33
 ✔ Image mm404/tautulli-exporter:latest Pulled                                                                      1.6s
 ✔ Image homeylab/tdarr-exporter:latest Pulled                                                                      2.7s
 ✔ Image cplieger/plex-exporter:latest  Pulled                                                                      3.9s
 ✔ Container tdarr-exporter             Started                                                                     0.3s
 ✔ Container plex-exporter              Started                                                                     0.4s
 ✔ Container tautulli-exporter          Started                                                                     0.5s
# HELP go_gc_duration_seconds A summary of the wall-time pause (stop-the-world) duration in garbage collection cycles.
# TYPE go_gc_duration_seconds summary
go_gc_duration_seconds{quantile="0"} 0
go_gc_duration_seconds{quantile="0.25"} 0
go_gc_duration_seconds{quantile="0.5"} 0
# HELP go_gc_duration_seconds A summary of the wall-time pause (stop-the-world) duration in garbage collection cycles.
# TYPE go_gc_duration_seconds summary
go_gc_duration_seconds{quantile="0"} 0
go_gc_duration_seconds{quantile="0.25"} 0
go_gc_duration_seconds{quantile="0.5"} 0
add scrap jobs
  - job_name: plex
    static_configs:
      - targets: ['TAILSCALE-IP:9594']
        labels: {host: little-boss}

  - job_name: tautulli
    scrape_interval: 30s
    static_configs:
      - targets: ['TAILSCALE-IP:9595']
        labels: {host: little-boss}

  - job_name: tdarr
    scrape_interval: 30s
    static_configs:
      - targets: ['TAILSCALE-IP:9596']
        labels: {host: little-boss}
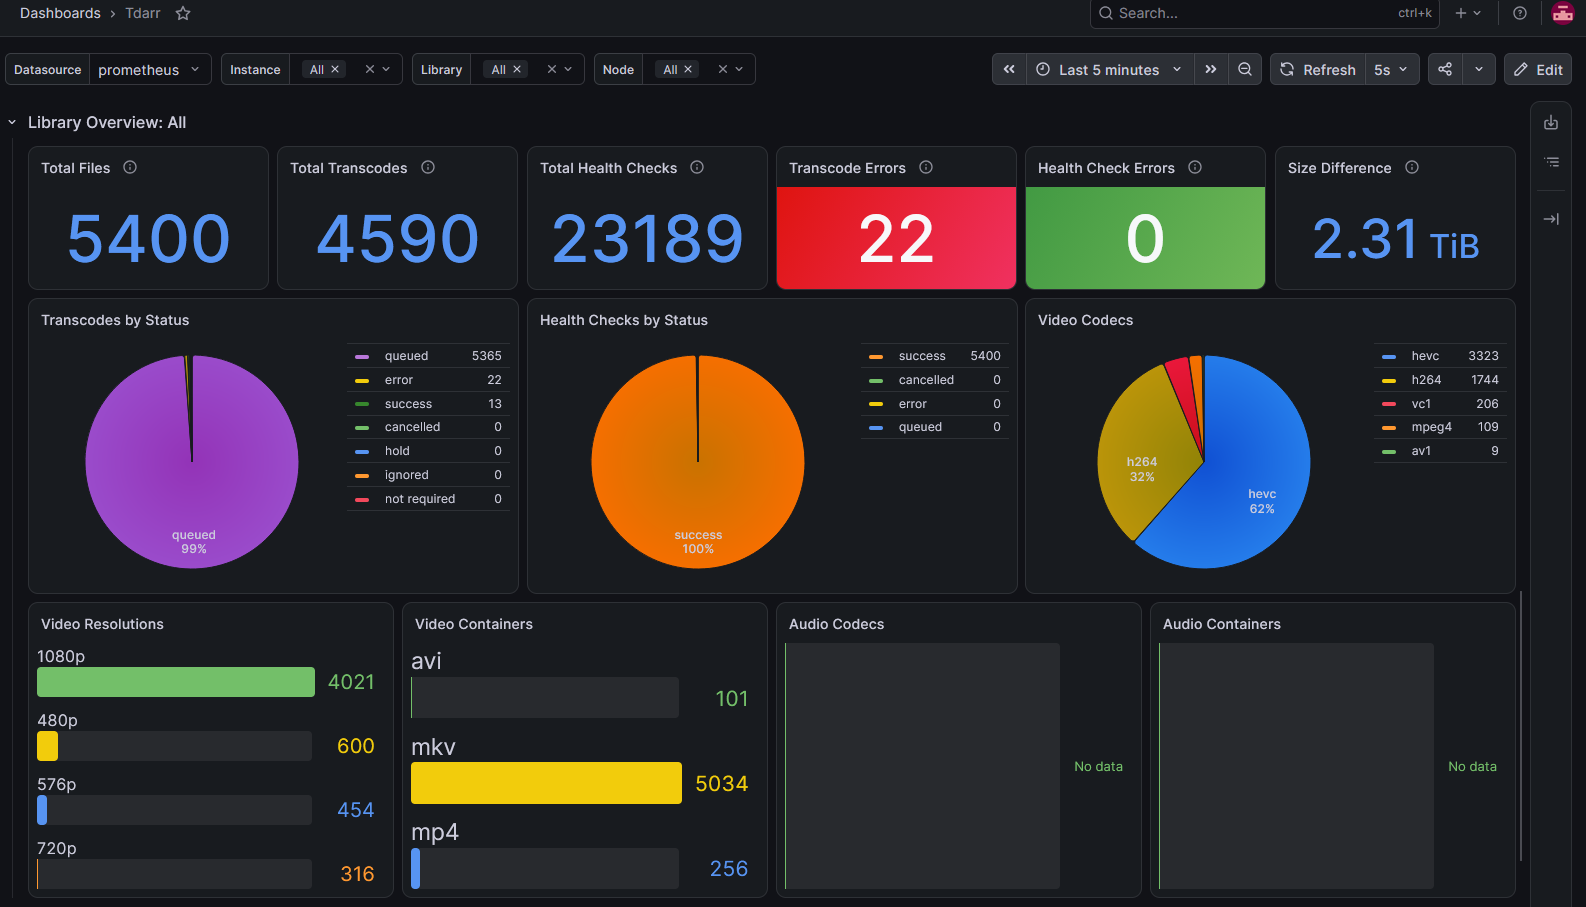
add windows 11 pcs
Had to get Claude help because I had no clue what to do lol
PS C:\Users\Admin> # 1. Must print True. If it prints False, reopen PowerShell as administrator.
PS C:\Users\Admin> ([Security.Principal.WindowsPrincipal][Security.Principal.WindowsIdentity]::GetCurrent()).IsInRole([Security.Principal.WindowsBuiltInRole]::Administrator)
True
download the latest release
PS C:\Users\Admin> [Net.ServicePointManager]::SecurityProtocol = [Net.SecurityProtocolType]::Tls12
PS C:\Users\Admin> $rel = Invoke-RestMethod https://api.github.com/repos/prometheus-community/windows_exporter/releases/latest
PS C:\Users\Admin> $asset = $rel.assets | Where-Object { $_.name -like "*amd64.msi" } | Select-Object -First 1
PS C:\Users\Admin> $msi = Join-Path $env:TEMP $asset.name
PS C:\Users\Admin> Invoke-WebRequest $asset.browser_download_url -OutFile $msi
PS C:\Users\Admin> Get-Item $msi


    Directory: C:\Users\Admin\AppData\Local\Temp


Mode                 LastWriteTime         Length Name
----                 -------------         ------ ----
-a----         11/8/2026   3:32 PM       14643200 windows_exporter-0.32.1-amd64.msi
install and check
PS C:\Users\Admin> Start-Process msiexec -Wait -ArgumentList "/i `"$msi`" LISTEN_PORT=9182 REMOTE_ADDR=100.100.217.91 /qn /l*v `"$env:TEMP\we-install.log`""
PS C:\Users\Admin> Get-Service windows_exporter

Status   Name               DisplayName
------   ----               -----------
Running  windows_exporter   windows_exporter


PS C:\Users\Admin> (Invoke-WebRequest -UseBasicParsing http://localhost:9182/metrics).StatusCode
200
creates a PC selector in node exporter
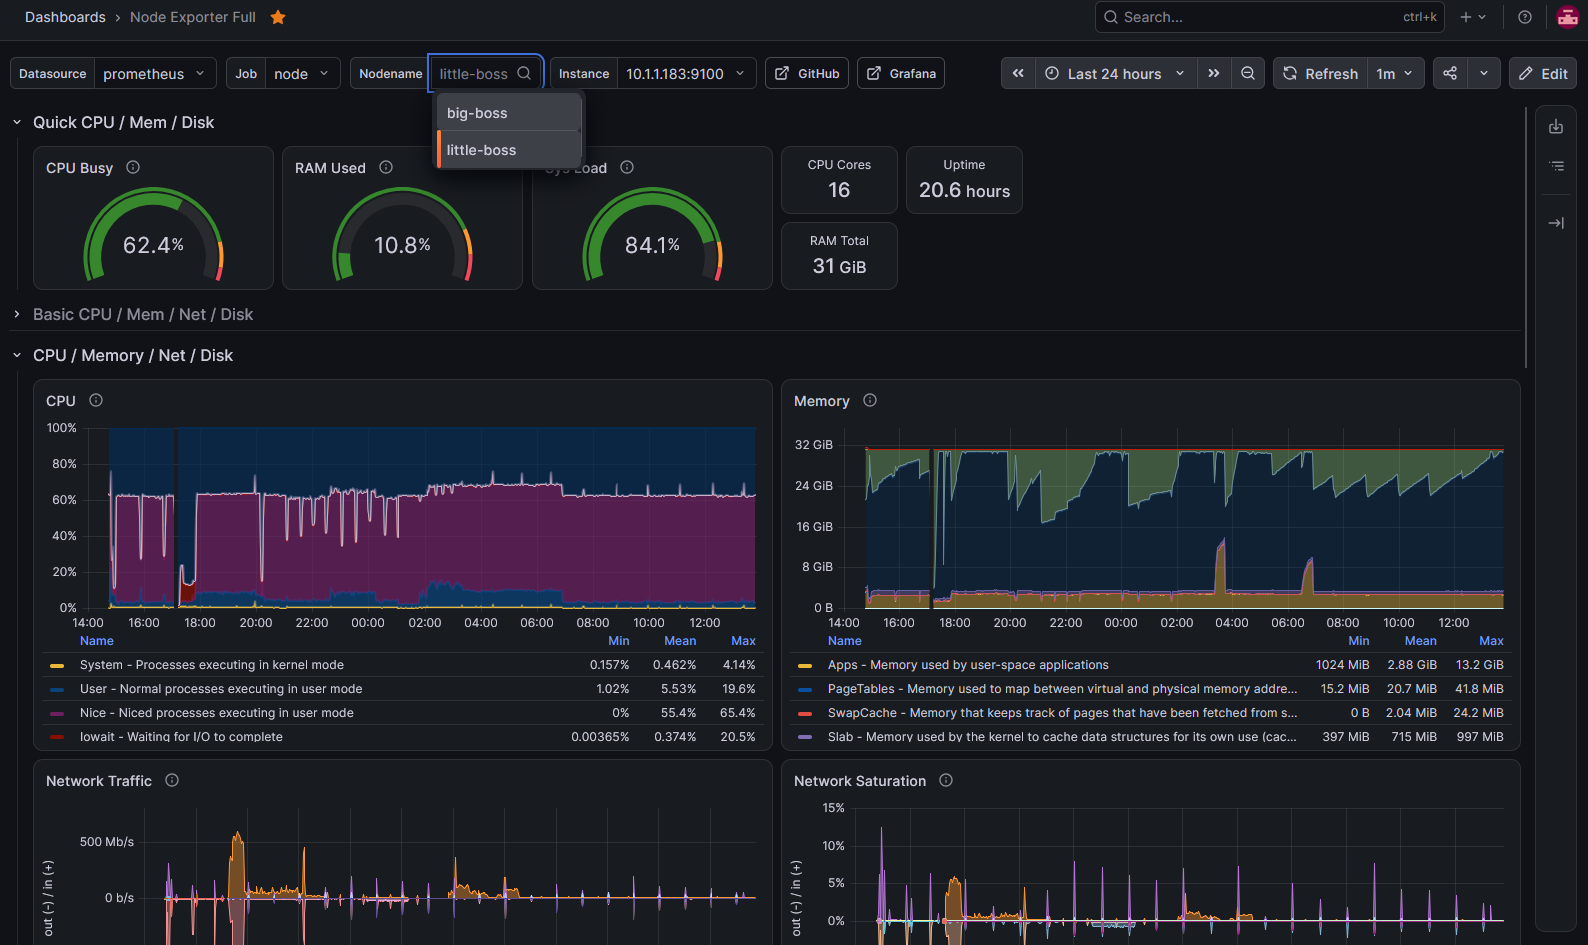
mikrotik switch
I needed to configure the Mikrotik for LAN access. I have been using the switch for a while, but realized it was still thinking I was using the default “192.168.X.X” default IP config. My home LAN in “10.1.1.1”, so although it was functioning for its purpose, I actually had no LAN access.
IP → DHCP Server → Networks
- Address: 10.1.1.0/24
- Gateway: 10.1.1.1
- DNS Servers: 10.1.1.155
IP → Routes
- Dst. Address: 0.0.0.0/24
- Gateway: 10.1.1.1
- Immediate Gateway: 10.1.1.1%bridge
new read-only user to scrape data
[admin@MikroTik] > /user group add name=mktxp_group policy=api,read
[admin@MikroTik] > /user add name=mktxp_user group=mktxp_group password=CHOOSE-A-STRONG-PASSWORD
[admin@MikroTik] > /ip service print
Flags: X - DISABLED, I - INVALID
Columns: NAME, PORT, CERTIFICATE, VRF
#   NAME     PORT  CERTIFICATE  VRF
0   telnet     23               main
1   ftp        21
2   www        80               main
3   ssh        22               main
4 X www-ssl   443  none         main
5   api      8728               main
6   winbox   8291               main
7   api-ssl  8729  none         main
[admin@MikroTik] > /ip service set api disabled=no address=10.1.1.183/32
add to docker-compose-exporters.yml
name: exporters

services:
  plex-exporter:
    ...
  tautulli-exporter:
    ...
  tdarr-exporter:
    ...
  mktxp:
    image: ghcr.io/akpw/mktxp:latest
    container_name: mktxp
    restart: unless-stopped
    network_mode: host
    security_opt:
      - apparmor=unconfined
    configs:
      - source: mktxp_conf
        target: /home/mktxp/mktxp/mktxp.conf

configs:
  mktxp_conf:
    content: |
      [CRS310]
          enabled = True
          hostname = 10.1.1.2
          port = 8728
          username = mktxp_user
          password = ${MKTXP_PASSWORD}
          use_ssl = False

          interface = True
          monitor = True
          dhcp = False
          dhcp_lease = False
          pool = False
          firewall = False
          route = False
          wireless = False
          wireless_clients = False
          capsman = False
          capsman_clients = False
ID: 13679
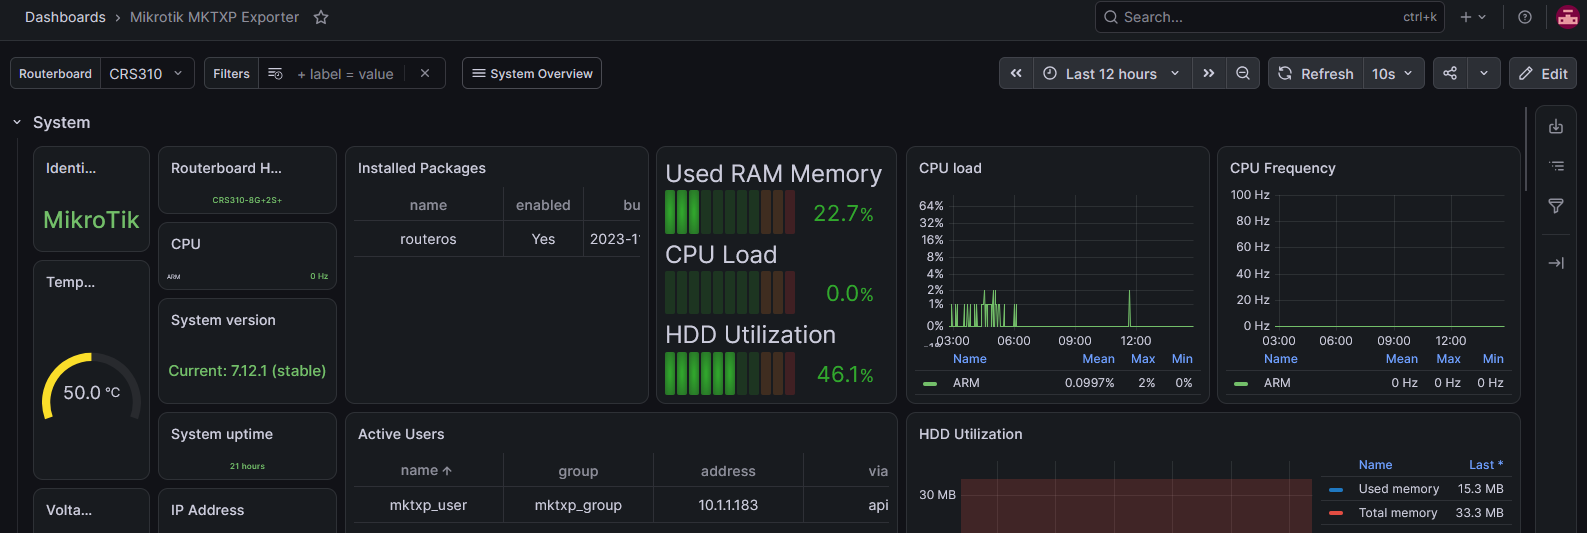
grafana app
I like it. Can easily connect and see from my phone with tailscale. Necessary? No lol
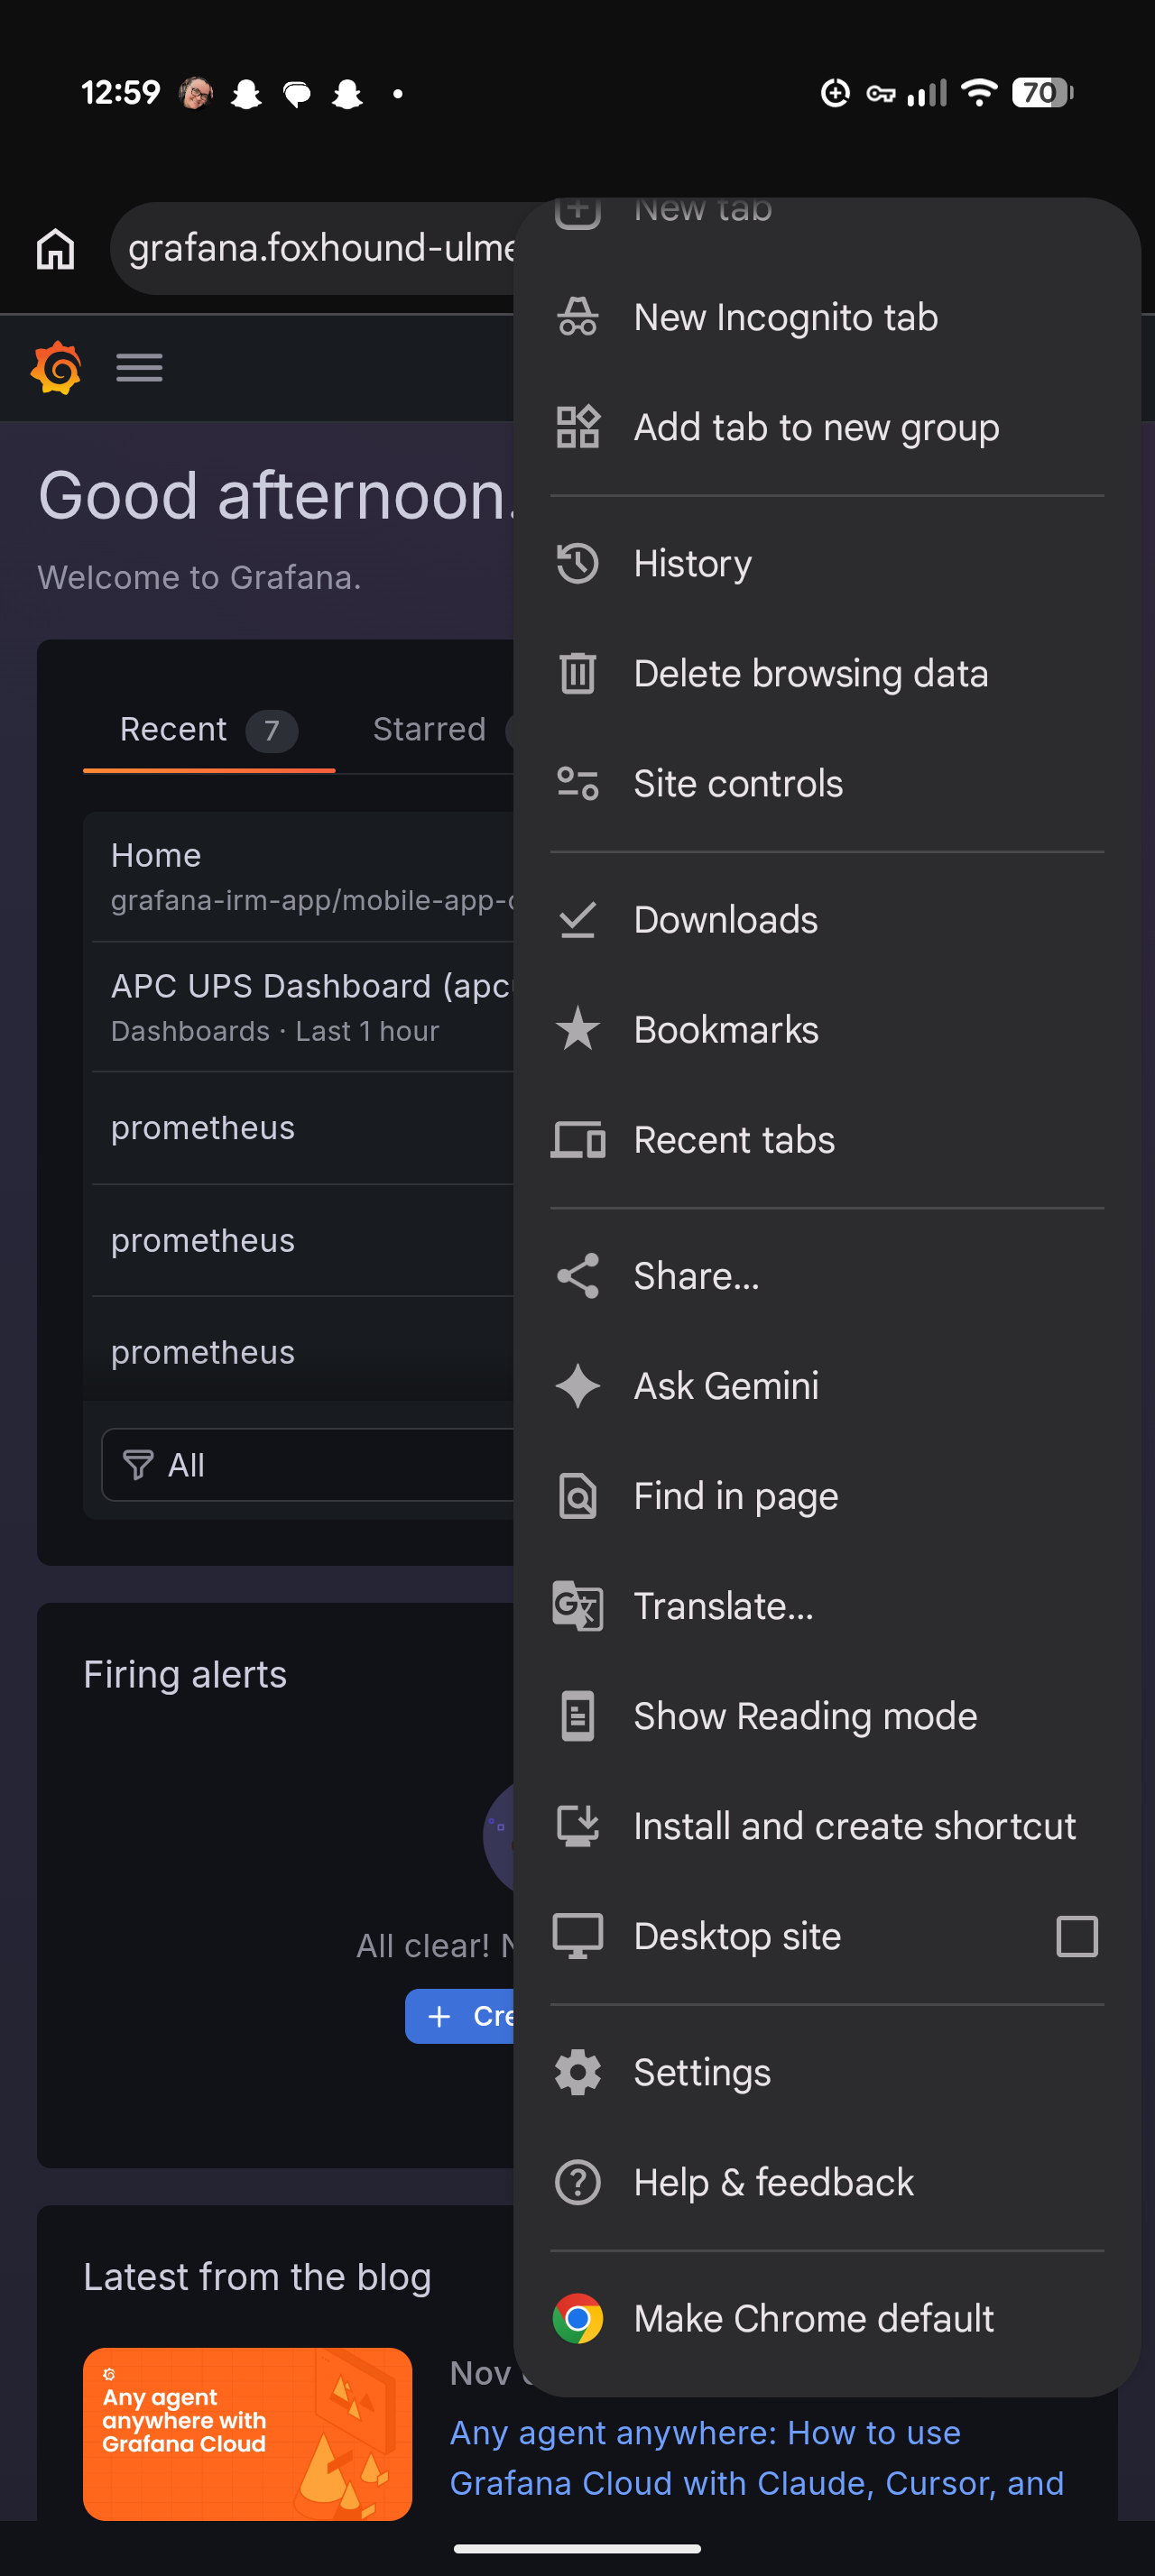
From the three dots in the corner choose to add shortcut. Then it will let you install grafana PWS-style.