Anyone have software they’d recommend to track the ‘quality’ of my internet connection? I specifically mean the internet from my provider, not my WiFi throughout the house. Something than can do scheduled speed tests, with logs. Log any drops in connection with the provider.
If it’s something that can run out a Raspberry Pi that’d be great, I’ve already got a Pi hooked into the router running Raspbian/PiHole. Can run it on a Windows 10 machine if necessary as well though.
I thought about just writing something myself, assuming there would be a free API for doing the speed test, but all I’ve found is speedof.me which would be $5USD/month to access the API. Maybe still go that route though… $5-10 to run this for a month or two and then just kill it. [Just realized the $5/month plan is only 100 calls/month. Would probably need the $15/month plan with 1,000 calls. I’d like to run them hourly.]
Open for other ideas as well. Mainly just not wanting to call and complain to my ISP empty handed. Internet has been going down hill for the past year, predating what could be blamed on Covid Chaos w/ everyone working/schooling from home. Granted that has only made it worse.
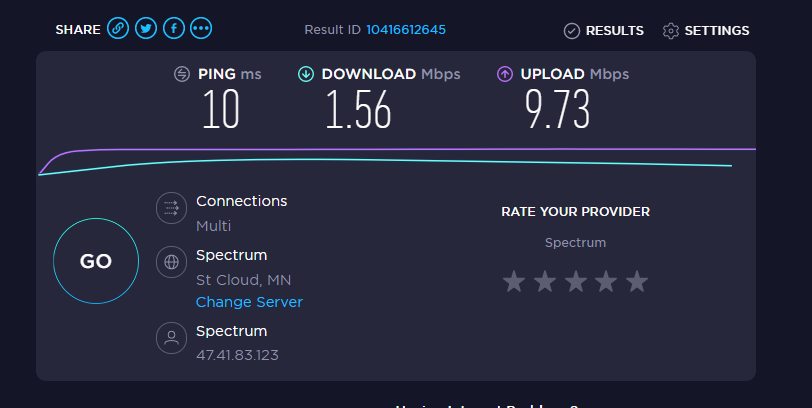
To give you an idea… This pretty sums up my internet the past week during normal hours 8AM - 8PM:
A bit exaggerated, the screenshot, because I have been getting 10-20Mbps this week, but today has been exceptionally bad being constantly in the single digits… The plan I have is advertised as 200Mbps (“up to” in the finest of print, I realize.)
This is extra painful for me because I do my work in a hosted VM… so everything is laggy, blurry. It’s like having to work with a YouTube buffer as a handicap. Add in when I need to do meetings, or my two kids are having to do video conferences… it’s terrible. How did I survive on dial up back in the day?
Yeah, that should make it pretty straightforward. For something quick and easy I’d probably do a python script using Requests along with ping checks against google every hour or something.
There’s a logging package called monolog I’ve used before in PHP projects which is pretty nifty. I think there’s a port of that for python but I’m not sure if it’s got all the same features.
More straightforward than I even realized. Looks like it’s just going to amount to a 1-line batch file, and Windows Task Scheduler to accomplish the task of the speed test logging. Or something similarly easy if I move it over to the Pi.
Won’t necessarily help track internet outages, unless the timing of the scheduled speed test just happens to coincide.
You could use mrtg for visualisation if your Pi has Nginx.
It can generate various graphs as html + png, depending on config. You can strap any script to mrtg, it just has to return some numbers.
If you need only latency then here is ping probe script example: https://fossies.org/linux/privat/old/mrtg-ping-probe-2.2.0.tar.gz
I might give that a look as I was thinking about doing something somewhat similar. Currently I just have a simple batch file scheduled to run hourly on my Windows server, instead of the Pi, storing the output from speedtest-cli in a json file.
Opted or JSON because I was thinking about writing a simple .NET webapp to do some data visualization, and I’m already familiar with .NET and using Json.NET to deserialize into C# objects.
You can use grafana as a visualization UI, it supports a variety of timeseries sources - various databases like postgresql and MySQL and timeseries specific ones like influxdb or opentsdb or things like prometheus.
It’s fairly lightweight, mine runs in a container on a pi, same pi that runs my home assistant and influxdb.
For your use case, you could use google sheets as a source for grafana. If it’s just speed test stats, and if you happen to run it once an hour, you’ll have only 365*24 = 8760 points per timeseries per year … peanuts - sheets would be perfect
Sure, if you want some fun project, go ahead :). But .NET for such simple thing doesn’t sound very efficient. I don’t really use it so I don’t know how much toolstack/runtime for it weights. I would rather go with something like python + remi, maybe flask.
Still, way too much work IMO, while mrtg is just 100kb binary, that runs from crontab with config file as an argument and generates few files into directory.
Pretty much this. What I’ve got in place currently satisfied my need for data to have when I need to call and complain to my internet provider. The rest is just fun project.
.NET because I’m familiar with it. Maybe .NET web app with Angular or React just because it’s stuff that I use on the job, so extra experience wouldn’t hurt. I don’t know Python, and I haven’t heard of Remi.
Might be worth noting that you don’t “need” to roll your own, as there is an integration on home assistant (can be installed in a container on your pi) which will take care of the logging for you (or integrate with grafana etc) and do other home assistant things if you’re interested .
There is a similar container and/or plugin on docker, freenas, and unraid, for anyone else looking (github).
I’m sure your running windows 10, right? Simply ask the NSA how your internet performance has been. Seriously. They can tell you or any body from the first second you started your PC.

 .
.