Intel Gold 6130 vs AMD EPYC 7551P

Hi,

i bought 2 servers as identical as possible and closer in price as possible
Intel Gold 6130 + 96G RAM (6x 16G) 2400Mhz + 1T NVME
AMD EPYC 7551P + 64G RAM (8x 8G) 2666Mhz + 1T NVME
same ram same drive …
I installed windows 2019 + corresponding super micro drivers on both + all updates

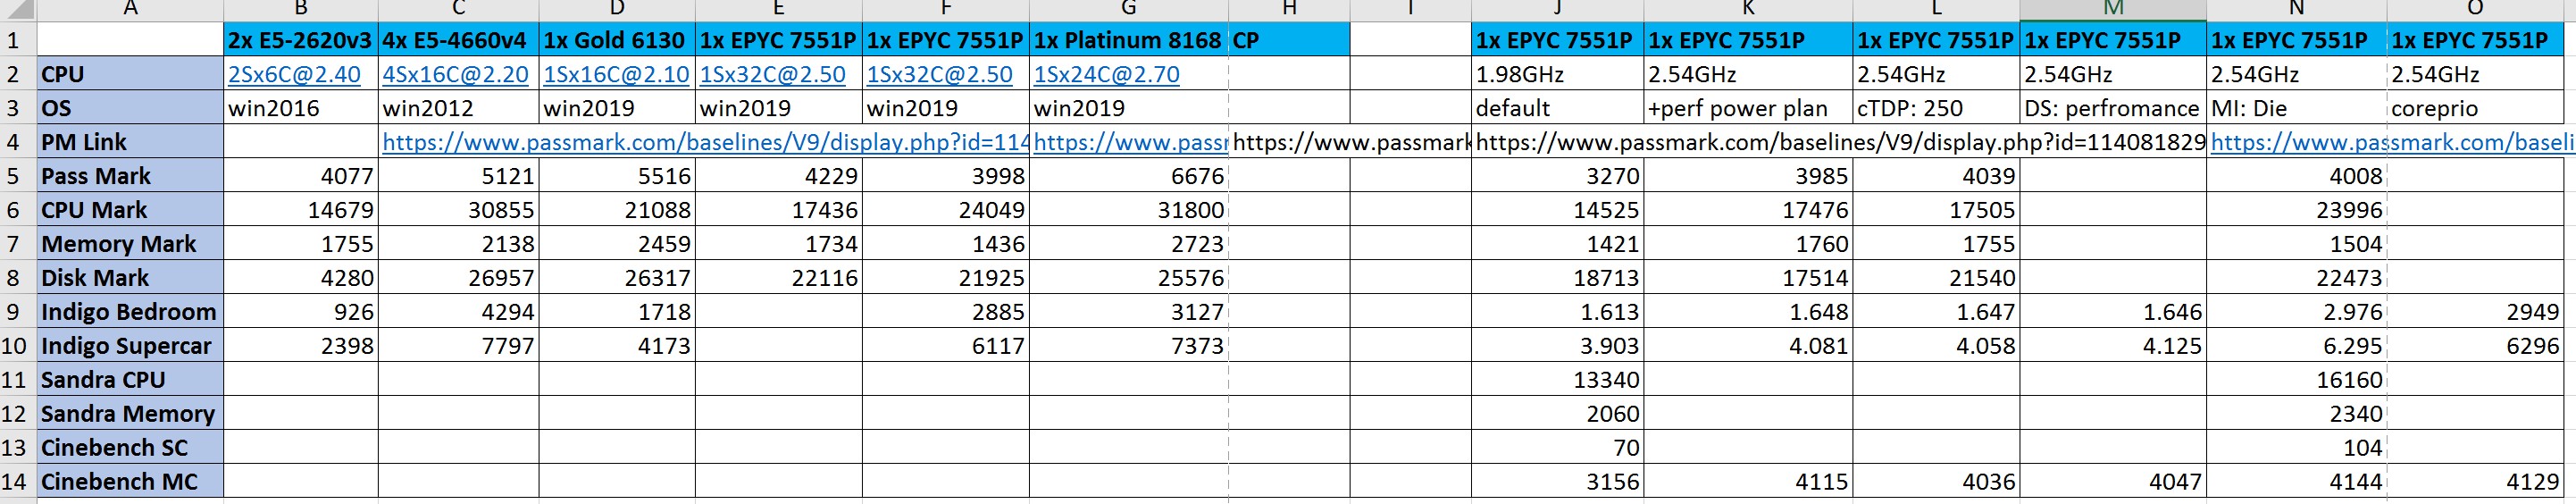
now i’m totally puzzled i ran passmark and Intel server got a much higher score, although i was expecting the AMD one to be better since it has 32 cores (intel has just 16C)
Anyone any ideas of any special settings to do on AMD system to fully show it’s 32 cores strength

win2016 (no drivers) https://www.passmark.com/baselines/V9/display.php?id=111589157028
13K CPU points

win2016 + drivers https://www.passmark.com/baselines/V9/display.php?id=111594947886
18K CPU points

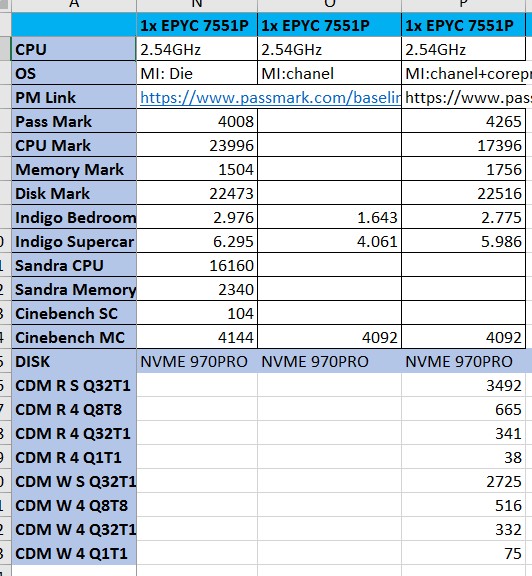
win2019 + drivers + bios tune up

win2019 + drivers + win/bios perf profile

… help to get it above intel system

… help

seen in l1t videos that windows is not quite there in therms of fully utilizing EPYC, but come on too much of a difference.

need help tweaking the EPYC system
lower memory score when is using faster memory and has more channels
lower cpu score when it has double the cores
lower storage score when it uses same NVME drive…
lower cpu score than other EPYC 7551 (average is like 18K points i got only 17K, Intel average is 19K and i got 21K after few bios tweaks)

btw please no drama, i’m looking for real help and settings suggestions that will get the best performance out of the AMD system.

Are we sure this isn’t the Windows thing where it doesn’t know how to handle so many cores and basically cripples 2990WX Threadripper as well?
Cause by all accounts the Epyc should outperform the Xeon.

1 Like

I second this.

On all core load, clocks are equall but the Epyc has twice the cores. Something does not make sense.

https://www.cpubenchmark.net/compare/Intel-Xeon-Gold-6130-vs-AMD-EPYC-7551/3126vs3089

1 Like
  1. check temperature of your epyc cpu; Ensure cooling is set up correctly. It could be throttling. (check clocks, with load)

  2. change power profile from typical/normal to high performance.

  3. install ryzen master utility - those settings should help with loads.

  4. Don’t judge performance by passmark etc… run some sql servers, iis, exhchange etc and load it up with work; then check execution times and sql profiler execution times and compare under load… You’ll see epyc pulls ahead far away.

did some bios tweekeing, if i set memory interleaving to “die” i get CPU score of 24K highest i could get but memory score is 1400 instead of 1700. i think i’ll take the extra 7000 points in CPU performance and a hit in memory performance .

ok now i have the higest EPYC 7551P score of 24000 on passmark (ok ignore this line just bragging)
but disk is still 4000 points under intel system (same drive samsung 970 PRO NVME)
memory is still 700-1000 points under intel system

clock is locked at 2550Mhz on AMD system after disabling C state …

  1. temps max 58’C
  2. both bios is set to perf profile and windows power profile to performance
  3. does ryzen masters works on EPYC ?
  4. yes i will run my own app tests and i’ll report back, but usually passmark can give some basic idea in much shorter time.

it should work. Not the overclocking part, but definitely some of the core pinning stuff.

ha ha, ryzen masters does not work on windows 2019
ryzen masters requires windows 10 or greater, missing required OS …
tried compatibility mode with win 7 and win8 and same stuff
that solved this issue quite fast, so ryzen masters not a solution

also seen in the youtube videos from l1t mentioning a 3rd party app that will preserve core 0 for the OS, while i may try it just for the fun, that is not something i want to depend on for good performance.

i recommend sending support ticket to amd on how to enable / optimize your system for this cpu;

I’m sure some of the process core pinning/rebalance per numa node should exist in windows already (amd ryzen master is just enhancing it) so it may be just question of changing some registry settings.

(since you have enterprise level hardware, they should jump leaps to help you, unlike normal desktop user.)

For benchmarking I recommend:

  1. MSSQL

Best Way: (If you have access to production environments)
Attach both servers as SQL servers to existing replication (merge), and have 2-4 IIS servers run with live traffic going into them.
– If you can’t you can try using some site backup (IIS + SQL bak) and generating traffic with QA test using selenium or something
See execution times on each server by the load.

Database ops performance: (if you create replication merge between them you can test them simultaneously, while additionally you can test transnational log performance.)
Create a database with junk data, like 2 same GeoIP table or something.
~ without indices and one with indices.

Create a backup plan (full backup every 4h, diff every 1h, and trans every 5min or less)

Create some queries about 400,000, in about realistic traffics of lets say 2k per second requests queries in SQLQueryStress so that your queries will run for duration of whole process of the backups running in background. Save execution times in SQL profiler.

Compare the results
indexed queries execution time
non indexed queries execution time
simultaneous load
how much time it takes to run trans/diff/full and how they impact your query execution time.

(intel should have advantage on the execution time to a point, but amd should take it over when you put a lot of load on it.)

  1. IIS
    Create some .net site (or get some garbage, sitefinity/sitecore etc)

First compilation startup time
LoadTest and execution time
Recycling time under heavy load

What you should also test those under
VMware ESX VM performance. More, and more people are running those, converting their physical servers into ‘clouds’; Which one is more capable…

What you should be looking for?
Load vs Execution time

What do you want?
Smaller impact of execution times per load. (That is what makes it cheaper)

// I can tell you already without testing that:
AMD will have worse execution times than Intel
Intel will have bigger impact on execution times as you crank up the load.

Perfect scenario for use:

AMD
You have a lot of traffic, and you are willing to trade off that +20ms to execution times, for those extra 5-20k active requests, before you begin suffering in large degradation of execution times.

Intel
You want to have those edge execution times, but you’ll suffer more under bigger load like black friday or cyber monday. (unless you add more servers to handle that extra - its common - but expensive and takes time to set up)

(For IIS it may be better to stick with AMD)
(for SQL it may be better to stick with Intel at this time)

(For large compute jobs its better to stick with AMD)
{Not on your hardware scale though.)

1 Like

support ticket to AMD ended nowhere, they sent me to contact supermicro
will try that next

well sorry. I thought they’ll be more johnny on the spot.

1 Like

I got a 7551p test system and it’s going really well. Can you try indigobench? Passmark is maybe not a fair benchmark for some reasons I’ll explain.

On my system the 7551p is about 2.99 at 2.55ghz and the 6130 is around 2.75 in the bedroom scene in indigo.

For the m 2 have you made sure it’s linked at pxie3.0 x4? For memory interleave I set die.

I used some crappy memory for one test and even tho the ram was rated for 2666 it was running at 1600(!) And I had to set the speed manually in amxld CBS options in uefi

without coreprio even being installed in indigobench i get:
2.885
6.117

settings i do:
tdp manual, 500W (just a high number past 180 or 200 there is no difference)
iommu enabled (does not make a difference)
memory interleaving : die
windows power performance

installing coreprio gets me 0.020 extra points or so
i’m not noticing any difference with coreprio installed or not (is enabled service running, top checkbox disabled bottom one enabled, coreprios started and running before starting the app, no difference in passmark or indigo bench)

will try to post a more detailed table soon

This means you are likely in uma mode. If you change affinity via task manager does it show (node 0) in parens on the affinity popup?

You can set interleave to Auto and see (node) maybe?

Is it full 8 channel population? If not the die setting won’t have an effect.

But since your score is so high I would guess it’s in uma mode. So you won’t see a regression in apps like indigo

For other apps that are sensitive to minor changes in memory latency, uma more might be hurting your performance in those apps … You have to test.

so each setting is additive it has that setting + all from before
for EPYC 7551P look at second part of the table, first part is for other CPUs

we can see how:

  1. setting in windows the performance power plan get the CPU clock from 2G to 2.5G that has biggest impact on passamrk memory bench and cinebench
  2. setting the TDP in bios to manual and putting a higher than 200 value increases the disk mark (no idea why maybe controller gets more power …)
  3. bios performance mode does not do anything
  4. memory interleaving to die, boosts CPU score and indigo scores, but affects the memory score
  5. using coreprio does not do anything
  6. disabling core0 did not do anything either

i use windows 2019 standard
my system is a https://www.supermicro.com/Aplus/system/1U/1013/AS-1013S-MTR.cfm
1013S-MTR, Supermicro 1U UP AMD EPYC
AMD EPYC 7551P 32C/64T 2.0G 64M 180W
8x 8GB DDR4 2666Mhz 1.2V ECC REG 1Rx4
Samsung 970 PRO 1TB M.2 PCIe 3.0 x4

anyway back to my issue the EPYC system should mop the floor with the Gold 6130 and i would expect to go head to head with the Platinum 8168 or beat and that is not the case.
more cores, all cores running at 2.55GHz
8 memory channels and faster memory 2666 vs 2400

storage speed is a different story , the system with 4 CPUs has 4 SSDs in RAID, the gold 6130 and EPYC have samsung pro NVME and the intel platinum has a Optane drive but all get similar scores and that makes me think that benchmark may not be the best, i may add something that crystal diskmark or something else for disk scores

Coreprio is not expected to do anything in UMA mode. Only NUMA.

did more testing but still MI:die seams to get best scores as of now, hope microsoft fixes it and fixes it good (and soon)

question what is the advantage of NUMA+coreprio instead of UMA ? (i’ll google it for sure but interested in your perspective)

1 Like

Nice work. There might not be an advantage. Depends on your software. So you have to test.

If you ran gta for example You’d get around 5 more fps at the high end in numa mode.

It’s possible to have apps that have lower guaranteed latency in numa mode in other words.

You cannot run uma mode with the 2990wx so if you had software like indigo there is no fix for that situation, short of Coreprio

this is getting frustrating, i have my 7551P setup and now i got a dual 7601 setup and the dual CPU setup is getting lower overall score, long live windows 2019
if i don’t select memory interleaving to DIE the results are terrible (win 2019 latest latest version)

AMD EPYC 7551P 32-Core Processor
https://www.indigorenderer.com/delete-benchmark-submission?id=1153
2.885 6.117 9.002
Windows Server 2019 Standard mirceadan

AMD EPYC 7601 32-Core Processor (2 CPUs)
https://www.indigorenderer.com/delete-benchmark-submission?id=1666
3.12 5.788 8.908
Windows Server 2019 Standard IOMMU, interleave DIE, all memory dimms active mirceadan

will have to try linux in next few days