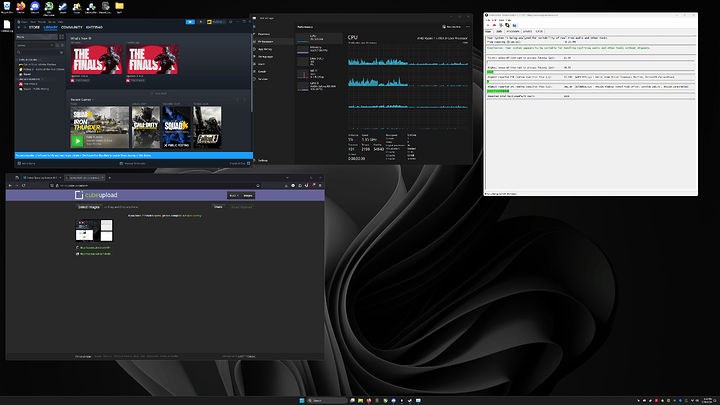
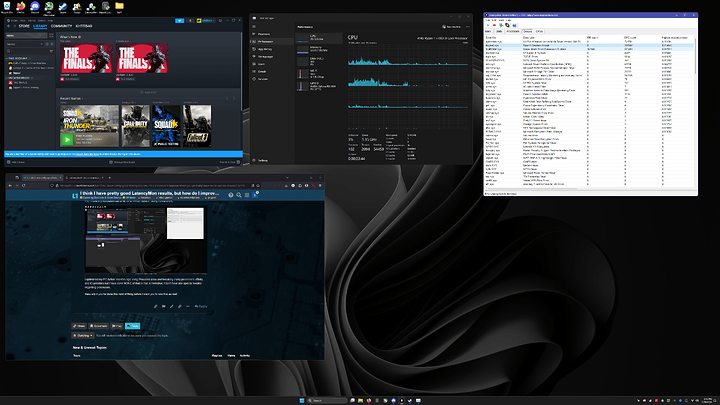
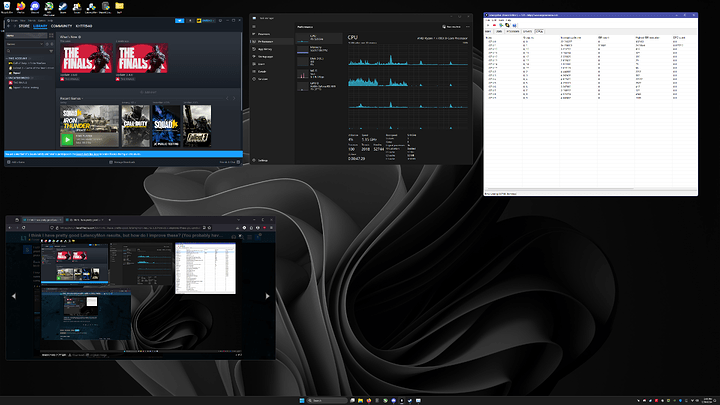
Here is a screenshot of the main page of LatencyMon after 20 minutes of running, opening programs, everything you see running, and typing this post out. Installed classic paint, flushed my DNS a thousand times because of NextDNS blocking half this website lol.
FYI; I have my resolution set to 4k on a 1440p monitor, using nVidia DSR.
I optimized my PC before months ago using ProcessLasso and tweaking every processes affinity and IO priorities but I have done NONE of that in that screenshot. I don’t have any special tweaks regarding processes.
![]()
Basically if you’ve done this kind of thing before I want you to see this as well; the gap between Kernel Mode Driver Framework Runtime and Direct X Graphics Kernel and NVIDIA Widows Kernel Mode Driver.
![]()
I have used MSI Utility or whatever it’s called as well. (Randomly guessing on the values while looking at a running games framerate behavior and GPU clock speed behavior.) I found the default values to be completely out of whack especially regarding my nVME.
I don’t exactly know why, perhaps to do something with the manual overclock and bypassing some BIOS or OS limits, but it’s reporting these values. I find it strange it’s all “on” a virtual core. (core 1, instead of core 0). From my understanding using ProcessLasso in the past, everything shares with core 0 and 1.
(Assuming Hyperthreading/SMT is on, otherwise just core 0.)
AMD 7700x ~5.4GHZ, idle ON so every core isn’t solid 5.3GHZ. I strangely found performance to be lower that way, which may point to a bottleneck somewhere because how could it be lower when every effective clock is locked high lol.
nVIdia 4070 - Different VBIOS (250watt instead of 200watt). P0 state supposedly locked to max (always max core/mem/voltage), shows 3GHZ core when at desktop but drops to 2700-2800Mhz gaming. It used to run at 3000Mhz gaming without all these tweaks HOWEVER it didn’t run better, it runs better somehow in this configuration.
T-Force some shit whatever RAM. Using a preloaded timing table from BIOS because it looked to my virgin eyes way faster than XMP. Also ran 6200Mhz, with slower timings anything over 5800Mhz crashed. Doesn’t make sense to me but I never can remember what ram timing values mean.
Currently 6200Mhz 1T 32,38,38,72??? Can’t remember last number. XMP off, using preset values.
Infinity Fabric 2200Mhz.
iGPU disabled. (Funny enough it almost felt faster when I enabled hybrid graphics and ran my monitor through the motherboards display port and using my 4070 as an “onboard card”. But after these tweaks I think it’s faster disabled.
The report text after 53 minutes of essentially editing this post like a maniac.
_________________________________________________________________________________________________________
CONCLUSION
_________________________________________________________________________________________________________
Your system appears to be suitable for handling real-time audio and other tasks without dropouts.
LatencyMon has been analyzing your system for  0:53:42  (h:mm:ss) on all processors.


_________________________________________________________________________________________________________
SYSTEM INFORMATION
_________________________________________________________________________________________________________
Computer name:                                        Wut
OS version:                                           Windows 11, 10.0, version 2009, build: 22631 (x64)
Hardware:                                             AMD Ryzen 7 7700X 8-Core Processor
BIOS:                                                 2613
CPU:                                                  AuthenticAMD AMD Ryzen 7 7700X 8-Core Processor
Logical processors:                                   16
Processor groups:                                     1
Processor group size:                                 16
RAM:                                                  32479 MB total


_________________________________________________________________________________________________________
CPU SPEED
_________________________________________________________________________________________________________
Reported CPU speed (WMI):                             5401 MHz
Reported CPU speed (registry):                        540 MHz lol "system limit" according to HWINFO.

Note: reported execution times may be calculated based on a fixed reported CPU speed. Disable variable speed settings like Intel Speed Step and AMD Cool N Quiet in the BIOS setup for more accurate results.


_________________________________________________________________________________________________________
MEASURED INTERRUPT TO USER PROCESS LATENCIES
_________________________________________________________________________________________________________
The interrupt to process latency reflects the measured interval that a usermode process needed to respond to a hardware request from the moment the interrupt service routine started execution. This includes the scheduling and execution of a DPC routine, the signaling of an event and the waking up of a usermode thread from an idle wait state in response to that event.

Highest measured interrupt to process latency (µs):   98.20
Average measured interrupt to process latency (µs):   3.134492

Highest measured interrupt to DPC latency (µs):       78.40
Average measured interrupt to DPC latency (µs):       0.688899


_________________________________________________________________________________________________________
 REPORTED ISRs
_________________________________________________________________________________________________________
Interrupt service routines are routines installed by the OS and device drivers that execute in response to a hardware interrupt signal.

Highest ISR routine execution time (µs):              57.210
Driver with highest ISR routine execution time:       Wdf01000.sys - Kernel Mode Driver Framework Runtime, Microsoft Corporation

Highest reported total ISR routine time (%):          0.000643
Driver with highest ISR total time:                   Wdf01000.sys - Kernel Mode Driver Framework Runtime, Microsoft Corporation

Total time spent in ISRs (%)                          0.000643

ISR count (execution time <250 µs):                   647652
ISR count (execution time 250-500 µs):                0
ISR count (execution time 500-1000 µs):               0
ISR count (execution time 1000-2000 µs):              0
ISR count (execution time 2000-4000 µs):              0
ISR count (execution time >=4000 µs):                 0


_________________________________________________________________________________________________________
REPORTED DPCs
_________________________________________________________________________________________________________
DPC routines are part of the interrupt servicing dispatch mechanism and disable the possibility for a process to utilize the CPU while it is interrupted until the DPC has finished execution.

Highest DPC routine execution time (µs):              381.30
Driver with highest DPC routine execution time:       nvlddmkm.sys - NVIDIA Windows Kernel Mode Driver, Version 560.70 , NVIDIA Corporation

Highest reported total DPC routine time (%):          0.015271
Driver with highest DPC total execution time:         nvlddmkm.sys - NVIDIA Windows Kernel Mode Driver, Version 560.70 , NVIDIA Corporation

Total time spent in DPCs (%)                          0.054580

DPC count (execution time <250 µs):                   4471804
DPC count (execution time 250-500 µs):                0
DPC count (execution time 500-10000 µs):              2
DPC count (execution time 1000-2000 µs):              0
DPC count (execution time 2000-4000 µs):              0
DPC count (execution time >=4000 µs):                 0


_________________________________________________________________________________________________________
 REPORTED HARD PAGEFAULTS
_________________________________________________________________________________________________________
Hard pagefaults are events that get triggered by making use of virtual memory that is not resident in RAM but backed by a memory mapped file on disk. The process of resolving the hard pagefault requires reading in the memory from disk while the process is interrupted and blocked from execution.

NOTE: some processes were hit by hard pagefaults. If these were programs producing audio, they are likely to interrupt the audio stream resulting in dropouts, clicks and pops. Check the Processes tab to see which programs were hit.

Process with highest pagefault count:                 firefox.exe

Total number of hard pagefaults                       11580
Hard pagefault count of hardest hit process:          2220
Number of processes hit:                              54


_________________________________________________________________________________________________________
 PER CPU DATA
_________________________________________________________________________________________________________
CPU 0 Interrupt cycle time (s):                       31.106757
CPU 0 ISR highest execution time (µs):                0.0
CPU 0 ISR total execution time (s):                   0.0
CPU 0 ISR count:                                      0
CPU 0 DPC highest execution time (µs):                63.380
CPU 0 DPC total execution time (s):                   1.906670
CPU 0 DPC count:                                      1310496
_________________________________________________________________________________________________________
CPU 1 Interrupt cycle time (s):                       73.555004
CPU 1 ISR highest execution time (µs):                57.210
CPU 1 ISR total execution time (s):                   0.331688
CPU 1 ISR count:                                      647652
CPU 1 DPC highest execution time (µs):                381.30
CPU 1 DPC total execution time (s):                   26.123016
CPU 1 DPC count:                                      3112273
_________________________________________________________________________________________________________
CPU 2 Interrupt cycle time (s):                       6.296444
CPU 2 ISR highest execution time (µs):                0.0
CPU 2 ISR total execution time (s):                   0.0
CPU 2 ISR count:                                      0
CPU 2 DPC highest execution time (µs):                23.860
CPU 2 DPC total execution time (s):                   0.006202
CPU 2 DPC count:                                      2645
_________________________________________________________________________________________________________
CPU 3 Interrupt cycle time (s):                       5.889011
CPU 3 ISR highest execution time (µs):                0.0
CPU 3 ISR total execution time (s):                   0.0
CPU 3 ISR count:                                      0
CPU 3 DPC highest execution time (µs):                48.090
CPU 3 DPC total execution time (s):                   0.001919
CPU 3 DPC count:                                      679
_________________________________________________________________________________________________________
CPU 4 Interrupt cycle time (s):                       6.766108
CPU 4 ISR highest execution time (µs):                0.0
CPU 4 ISR total execution time (s):                   0.0
CPU 4 ISR count:                                      0
CPU 4 DPC highest execution time (µs):                59.170
CPU 4 DPC total execution time (s):                   0.066251
CPU 4 DPC count:                                      32304
_________________________________________________________________________________________________________
CPU 5 Interrupt cycle time (s):                       5.738795
CPU 5 ISR highest execution time (µs):                0.0
CPU 5 ISR total execution time (s):                   0.0
CPU 5 ISR count:                                      0
CPU 5 DPC highest execution time (µs):                41.310
CPU 5 DPC total execution time (s):                   0.006864
CPU 5 DPC count:                                      3421
_________________________________________________________________________________________________________
CPU 6 Interrupt cycle time (s):                       4.595930
CPU 6 ISR highest execution time (µs):                0.0
CPU 6 ISR total execution time (s):                   0.0
CPU 6 ISR count:                                      0
CPU 6 DPC highest execution time (µs):                42.70
CPU 6 DPC total execution time (s):                   0.001109
CPU 6 DPC count:                                      449
_________________________________________________________________________________________________________
CPU 7 Interrupt cycle time (s):                       4.384458
CPU 7 ISR highest execution time (µs):                0.0
CPU 7 ISR total execution time (s):                   0.0
CPU 7 ISR count:                                      0
CPU 7 DPC highest execution time (µs):                38.330
CPU 7 DPC total execution time (s):                   0.000403
CPU 7 DPC count:                                      134
_________________________________________________________________________________________________________
CPU 8 Interrupt cycle time (s):                       6.438111
CPU 8 ISR highest execution time (µs):                0.0
CPU 8 ISR total execution time (s):                   0.0
CPU 8 ISR count:                                      0
CPU 8 DPC highest execution time (µs):                42.790
CPU 8 DPC total execution time (s):                   0.013960
CPU 8 DPC count:                                      5901
_________________________________________________________________________________________________________
CPU 9 Interrupt cycle time (s):                       5.541242
CPU 9 ISR highest execution time (µs):                0.0
CPU 9 ISR total execution time (s):                   0.0
CPU 9 ISR count:                                      0
CPU 9 DPC highest execution time (µs):                44.460
CPU 9 DPC total execution time (s):                   0.004903
CPU 9 DPC count:                                      1637
_________________________________________________________________________________________________________
CPU 10 Interrupt cycle time (s):                       4.572383
CPU 10 ISR highest execution time (µs):                0.0
CPU 10 ISR total execution time (s):                   0.0
CPU 10 ISR count:                                      0
CPU 10 DPC highest execution time (µs):                52.460
CPU 10 DPC total execution time (s):                   0.002257
CPU 10 DPC count:                                      874
_________________________________________________________________________________________________________
CPU 11 Interrupt cycle time (s):                       4.305980
CPU 11 ISR highest execution time (µs):                0.0
CPU 11 ISR total execution time (s):                   0.0
CPU 11 ISR count:                                      0
CPU 11 DPC highest execution time (µs):                45.30
CPU 11 DPC total execution time (s):                   0.001437
CPU 11 DPC count:                                      362
_________________________________________________________________________________________________________
CPU 12 Interrupt cycle time (s):                       3.269270
CPU 12 ISR highest execution time (µs):                0.0
CPU 12 ISR total execution time (s):                   0.0
CPU 12 ISR count:                                      0
CPU 12 DPC highest execution time (µs):                44.630
CPU 12 DPC total execution time (s):                   0.001199
CPU 12 DPC count:                                      448
_________________________________________________________________________________________________________
CPU 13 Interrupt cycle time (s):                       2.944836
CPU 13 ISR highest execution time (µs):                0.0
CPU 13 ISR total execution time (s):                   0.0
CPU 13 ISR count:                                      0
CPU 13 DPC highest execution time (µs):                19.710
CPU 13 DPC total execution time (s):                   0.000128
CPU 13 DPC count:                                      35
_________________________________________________________________________________________________________
CPU 14 Interrupt cycle time (s):                       2.691028
CPU 14 ISR highest execution time (µs):                0.0
CPU 14 ISR total execution time (s):                   0.0
CPU 14 ISR count:                                      0
CPU 14 DPC highest execution time (µs):                46.730
CPU 14 DPC total execution time (s):                   0.000456
CPU 14 DPC count:                                      78
_________________________________________________________________________________________________________
CPU 15 Interrupt cycle time (s):                       2.373759
CPU 15 ISR highest execution time (µs):                0.0
CPU 15 ISR total execution time (s):                   0.0
CPU 15 ISR count:                                      0
CPU 15 DPC highest execution time (µs):                53.620
CPU 15 DPC total execution time (s):                   0.000843
CPU 15 DPC count:                                      70
_________________________________________________________________________________________________________
It appears to me the nVidia driver sucks. Or does Direct-X come before that? I don’t know how this stuff works man! Also looks like I should turn off SMT.
Another thing to mention, I have a built in RTL8852BE wireless PCI NIC or so it’s called. Look at the strange spikes via task manager and you’ll see that wifi spikes, then cpu/gpu, then wifi again. I know it’s all tied together like epoxy. The wifi spiking is SUS. The sticker says V-M.2 PCIE WIFI 6 module with bluetooth. (BT off in BIOS).
I don’t know what a V-M2 is, but it sounds an awful lot like it’s glued to my PCI express system in every single way. Weird. Side-eying microsoft and all these hardware manufacturers on their techniques RN.
It’s almost like spyware is more important than making somebody happy by having a well performing system, but you know, I could be way off or just loony.
Cough Wireless backdoor. Cough Sorry, now I’m just talking “crazy” talk. How do I get these huge LatencyMon gaps down!?
500th Edit:
I was thinking… if there were a total of 2 latency spikes according to that report… Wouldn’t it be possible to track the culprit down by looking at other things that only had a total of 2 DPC counts? There’s a few. Volume driver… Server driver… CSA Library… Filesystem… I disabled Server service and my CPU usage at “idle” immediately halved. And this is why I hate Windows. I feel like I bought all this hardware just to use what feels like a VM tied to a cloud binded with spyware and performance killing backdo— COUGH telemetry.
Does anybody know how to force cursor hardware (gpu) acceleration on? I have to delete the value completely to enable it but it always comes back. I’m a bit of a freak when it comes to input lag.
Also does anybody know how to make my crappy dell monitor NOT change brightness when enabling MPRT mode? I used to have a 32inch DGF model that had USB hubs, HDR, all this stuff, pretty much all dells are alienware monitors gimped by software and firmware, I guess that goes for many brands. Anywho… I now have a DGM model of the same monitor. It’s shite. But it has MPRT feature. Woopty doo. Psst, how do I turn this into an alienware feature level monitor (cuz it basically is) and get this trash firmware off. ![]()


