How to configure/customize glances/conky and determine which sensor is what?

I originally posted this in the Manjaro forums but it’s not really getting any traction, so I wanted to get another set of eyeballs on it. I’ll link to it here, but I’m just gonna copy the entire post.

======Original Post======

UPDATE: I’m giving up on glances for now. See the 2nd post for conky questions.

UPDATE2: Things are mostly working as I’d like now. See the 6th post for a summary if you want to duplicate this.

UPDATE3: ===WARNING! THE METHODS IN POST 6 CAUSED A MEMORY LEAK DUE TO OVERWRITING FILES ON A TMPFS. YOU MUST EXPLICITLY DELETE THE FILES BEFORE WRITING TO THEM TO AVOID THIS.===
I’ll make a new post with the updated config below.

UPDATE4: See post 14 for “fixed” version. It’s still a work in progress though and specific to my hardware setup. Also I don’t really know what I’m doing, and I’m just learning as I go, so I don’t recommend straight copying anything

Having come over from Windows, I think I’ve been spoiled by HWiNFO64 for monitoring hardware sensors. I’ve tried a few different linux alternatives; including conky, gkrellm, and now glances.

Conky is…alright-ish. However, I can’t seem to run it in a window, and therefore it’s always beneath my other open windows (browser, etc), and I can’t easily min/max/resize/move/alt+tab to it. Also the fact it uses too much CPU resources for my liking (~5% on multiple cores), I’d like to find something better. The good thing about it though is that it can display most things I’d want to monitor (Such as CPU voltage and frequency, and GPU Fan RPM).

GKrellM was just way too unwieldy for me, and takes up so much vertical space to display all of the CPU usage/frequency graphs that it doesn’t even fit on the screen.

Glances is pretty decent so far, but I would love to be able to configure which sensors are displayed and name them properly.


I’ve been to and read through
https://glances.readthedocs.io/en/stable/index.html

and I’ve downloaded and modified the example configuration from
https://raw.githubusercontent.com/nicolargo/glances/master/conf/glances.conf

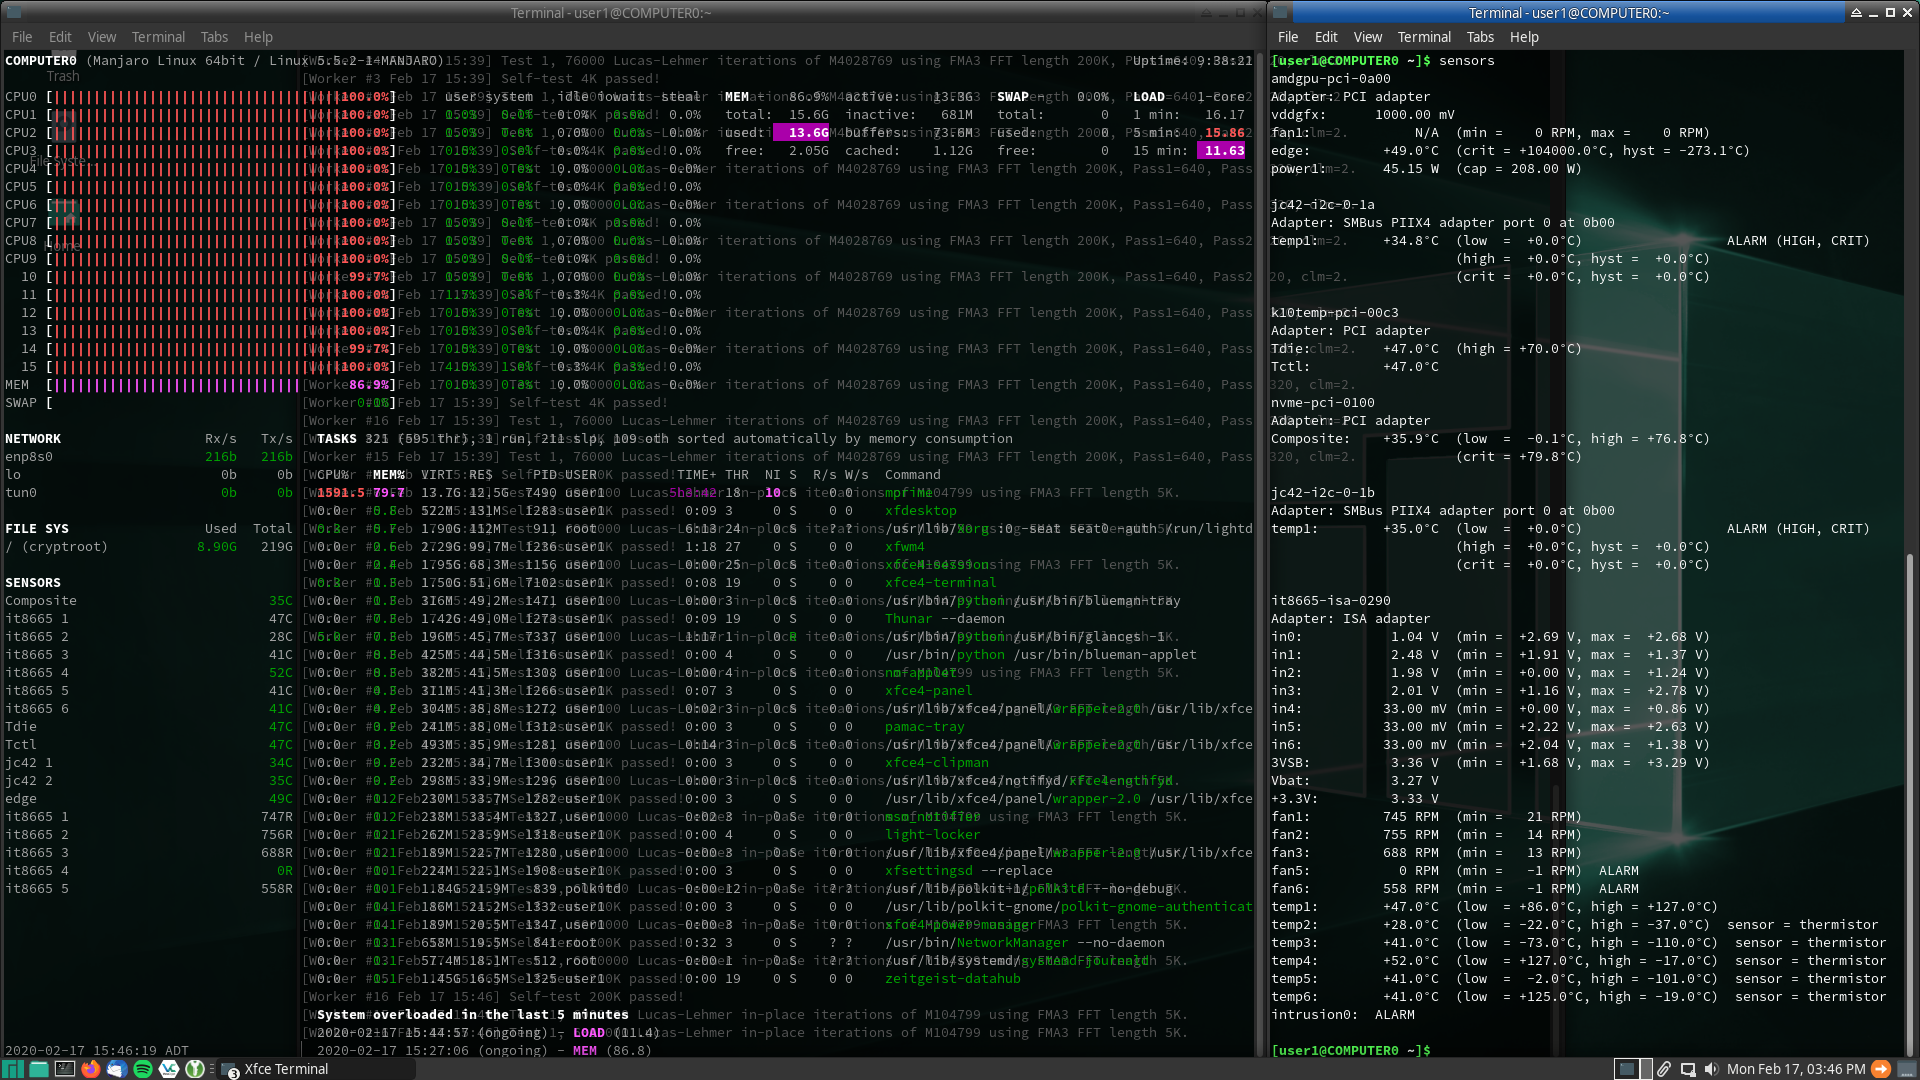
By default (and with mprime running in the background, because reasons), glances -1 and sensors look like this:

Summary

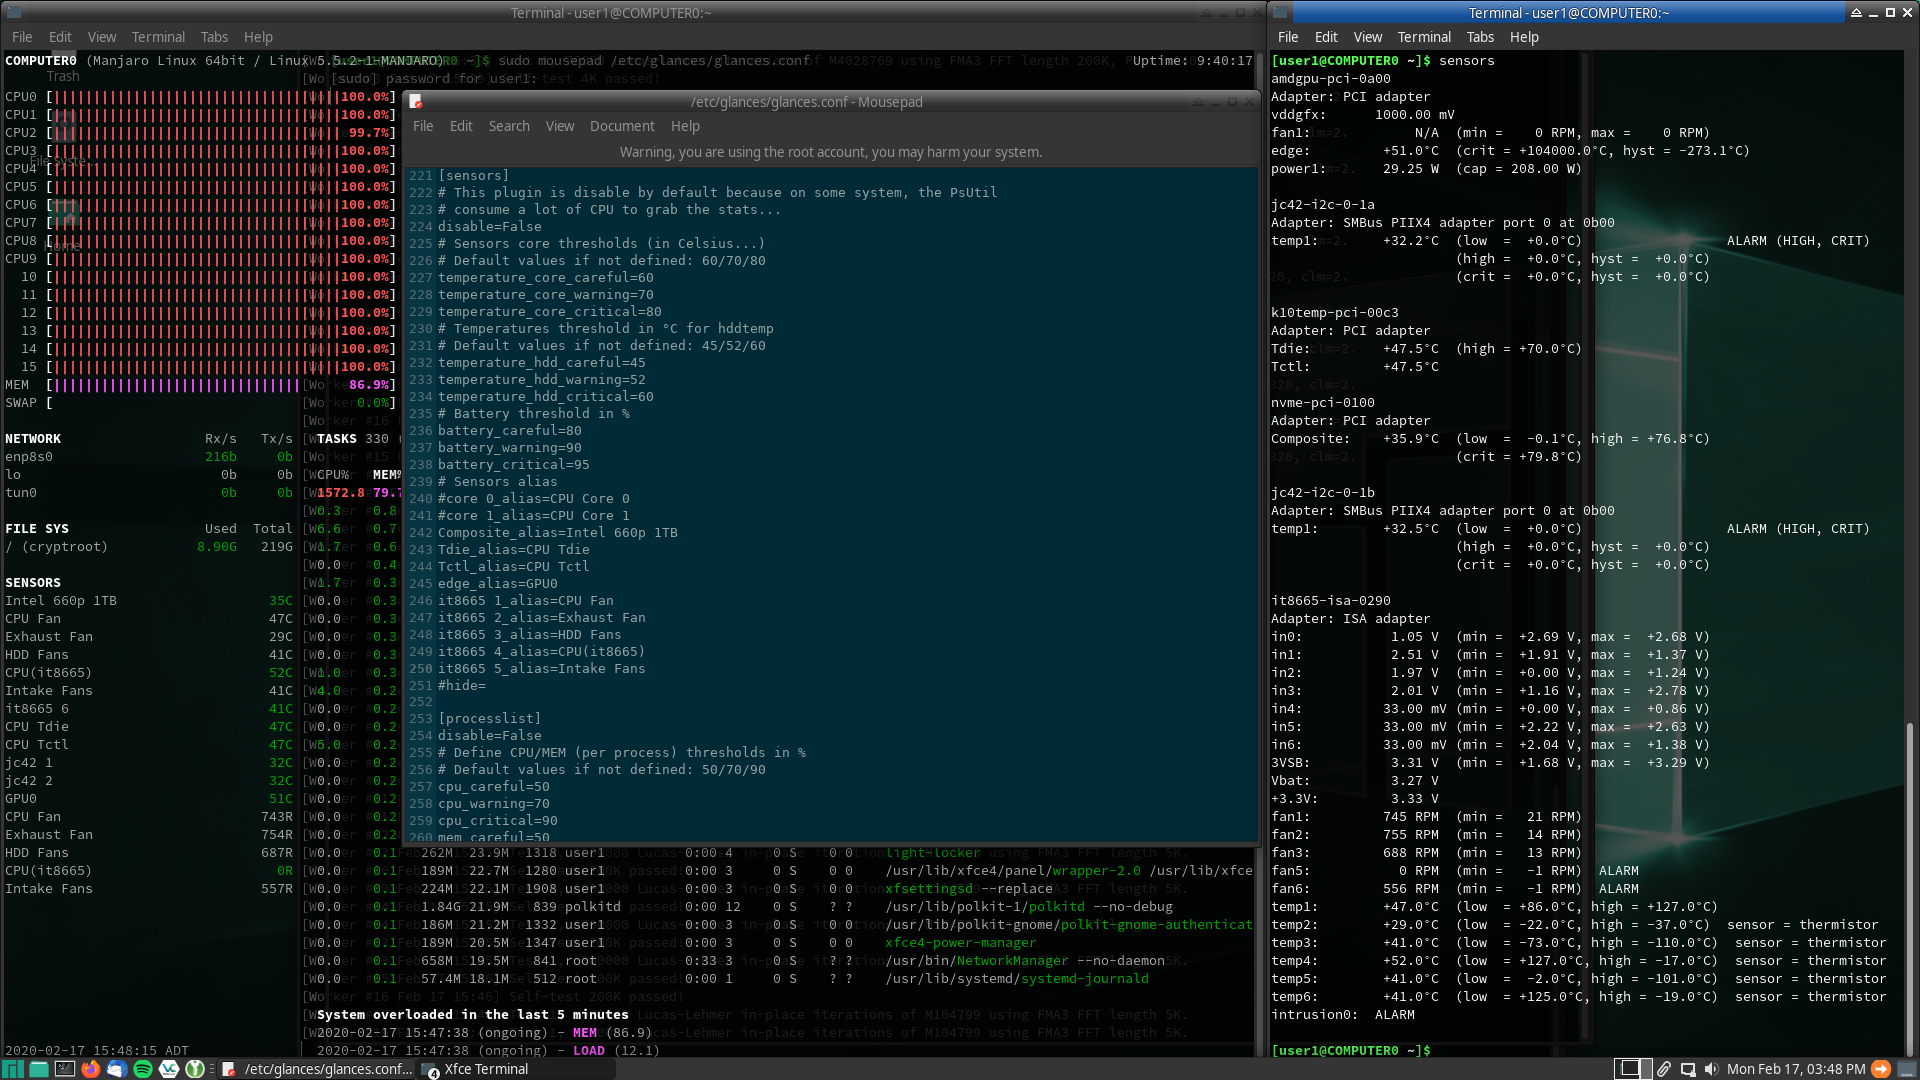
With a couple tweaks to the config (namely just changing to disable=False and defining a few aliases in the [sensors] section) I’ve gotten this far:

Summary


So the issues are:

  1. Because glances is naming multiple sensors with the same name, my aliases are applying to both the temperatures and fan RPMs.

  2. I can’t figure out what components the jc42 temperature sensors are for. I’m guessing they’re for a couple of the SSDs in the system, but I don’t know for sure, and I don’t know which is which if that’s the case. I’ve tried a couple things such as lspci -v and lshw -class storage but they aren’t giving me any insight.
    The same goes for some of the motherboard temp sensors, but I’m not too worried about those. The 1st one is definitely the CPU temp (already made an alias). The 2nd I don’t know or care (it’s always <30°). 3rd, 5th, and 6th are all the same, and may be the PCH, or the 4th may be the PCH.

  3. The voltage reported by amdgpu is the VDDCI/Aux voltage (don’t care), not Vcore (do care!), and the fan RPM (also plz giv) isn’t reporting correctly. Even if it were, that fan sensor isn’t showing up in glances. <===FAN ISSUE SOLVED

  4. Glances isn’t picking up any of the voltages reported by the it8665 chip (in0 is an abolute must as that’s my CPU voltage).

  5. Neither glances or sensors seem to be able to see the frequency of the GPU or individual CPU cores (or even an overall CPU freq)

With all that said, the obvious questions are:

  1. How can I be specific about which sensor I am making an alias for so I can give them each separate names?
  2. How can I determine exactly what component a sensor is reporting (aside from, say, somehow blasting heat at a specific component and watching which one changes)?
  3. How can I see my voltages and frequencies in glances?
  4. a) Does glances even have the functionality I’m after, or should I abandon it and look for another monitoring tool?
    b) Which one would you suggest?

Output of inxi -Fxzc0:

Summary
$ inxi -Fxzc0
System:    Host: COMPUTER0 Kernel: 5.5.2-1-MANJARO x86_64 bits: 64 compiler: gcc v: 9.2.0 Desktop: Xfce 4.14.2 
           Distro: Manjaro Linux 
Machine:   Type: Desktop Mobo: ASUSTeK model: PRIME X370-PRO v: Rev X.0x serial: <filter> UEFI: American Megatrends v: 5220 
           date: 09/12/2019 
CPU:       Topology: 8-Core model: AMD Ryzen 7 1700 bits: 64 type: MT MCP arch: Zen rev: 1 L2 cache: 4096 KiB 
           flags: avx avx2 lm nx pae sse sse2 sse3 sse4_1 sse4_2 sse4a ssse3 svm bogomips: 95849 
           Speed: 3097 MHz min/max: 1550/3000 MHz Core speeds (MHz): 1: 3106 2: 3118 3: 3114 4: 3072 5: 3125 6: 3038 7: 3019 
           8: 3045 9: 3115 10: 3074 11: 3126 12: 3040 13: 3021 14: 3046 15: 3104 16: 3114 
Graphics:  Device-1: Advanced Micro Devices [AMD/ATI] Hawaii PRO [Radeon R9 290/390] vendor: Gigabyte driver: amdgpu v: kernel 
           bus ID: 0a:00.0 
           Display: x11 server: X.Org 1.20.7 driver: amdgpu,ati unloaded: modesetting tty: N/A 
           OpenGL: renderer: AMD Radeon R9 200 Series (HAWAII DRM 3.36.0 5.5.2-1-MANJARO LLVM 9.0.1) v: 4.5 Mesa 19.3.4 
           direct render: Yes 
Audio:     Device-1: Advanced Micro Devices [AMD/ATI] Hawaii HDMI Audio [Radeon R9 290/290X / 390/390X] vendor: Gigabyte 
           driver: snd_hda_intel v: kernel bus ID: 0a:00.1 
           Device-2: Advanced Micro Devices [AMD] Family 17h HD Audio vendor: ASUSTeK driver: snd_hda_intel v: kernel 
           bus ID: 0c:00.3 
           Device-3: Kingston HyperX Virtual Surround Sound type: USB driver: hid-generic,snd-usb-audio,usbhid bus ID: 1-4:3 
           Sound Server: ALSA v: k5.5.2-1-MANJARO 
Network:   Device-1: Intel I211 Gigabit Network vendor: ASUSTeK driver: igb v: 5.6.0-k port: e000 bus ID: 08:00.0 
           IF: enp8s0 state: up speed: 1000 Mbps duplex: full mac: <filter> 
           IF-ID-1: tun0 state: unknown speed: 10 Mbps duplex: full mac: N/A 
Drives:    Local Storage: total: 3.54 TiB used: 8.96 GiB (0.2%) 
           ID-1: /dev/nvme0n1 vendor: Intel model: SSDPEKNW010T8 size: 953.87 GiB 
           ID-2: /dev/sda vendor: Samsung model: SSD 840 EVO 500GB size: 465.76 GiB 
           ID-3: /dev/sdb vendor: Seagate model: ST2000DM001-1ER164 size: 1.82 TiB 
           ID-4: /dev/sdc type: USB model: USB DISK size: 126.5 MiB 
           ID-5: /dev/sdd vendor: SanDisk model: SDSSDA240G size: 223.57 GiB 
           ID-6: /dev/sde vendor: A-Data model: SU800 size: 119.24 GiB 
Partition: ID-1: / size: 218.57 GiB used: 8.92 GiB (4.1%) fs: ext4 dev: /dev/dm-0 
Sensors:   System Temperatures: cpu: 44.0 C mobo: 30.0 C gpu: amdgpu temp: 37 C 
           Fan Speeds (RPM): cpu: 719 fan-2: 737 fan-3: 690 fan-5: 0 fan-6: 536 
           Voltages: 12v: N/A 5v: N/A 3.3v: 3.36 vbat: 3.27 
Info:      Processes: 351 Uptime: 9h 53m Memory: 15.63 GiB used: 14.30 GiB (91.5%) Init: systemd Compilers: gcc: 9.2.0 
           Shell: bash v: 5.0.11 inxi: 3.0.37

Output of lshw -class storage && lshw -class storage -businfo:

Summary
$ sudo lshw -class storage && sudo lshw -class storage -businfo
  *-storage                 
       description: Non-Volatile memory controller
       product: SSD 660P Series
       vendor: Intel Corporation
       physical id: 0
       bus info: pci@0000:01:00.0
       version: 03
       width: 64 bits
       clock: 33MHz
       capabilities: storage pm msi pciexpress msix nvm_express bus_master cap_list
       configuration: driver=nvme latency=0
       resources: irq:41 memory:fcf00000-fcf03fff
  *-storage
       description: SATA controller
       product: X370 Series Chipset SATA Controller
       vendor: Advanced Micro Devices, Inc. [AMD]
       physical id: 0.1
       bus info: pci@0000:02:00.1
       version: 02
       width: 32 bits
       clock: 33MHz
       capabilities: storage msi pm pciexpress ahci_1.0 bus_master cap_list rom
       configuration: driver=ahci latency=0
       resources: irq:55 memory:fcc80000-fcc9ffff memory:fcc00000-fcc7ffff
  *-usb:0
       description: Mass storage device
       product: DISK
       vendor: USB
       physical id: 2
       bus info: usb@5:2
       version: 0.00
       serial: ZGHJKL092705154
       capabilities: usb-2.00 scsi
       configuration: driver=usb-storage maxpower=100mA speed=480Mbit/s
  *-storage
       description: SATA controller
       product: FCH SATA Controller [AHCI mode]
       vendor: Advanced Micro Devices, Inc. [AMD]
       physical id: 0.2
       bus info: pci@0000:0c:00.2
       version: 51
       width: 32 bits
       clock: 33MHz
       capabilities: storage pm pciexpress msi ahci_1.0 bus_master cap_list
       configuration: driver=ahci latency=0
       resources: irq:57 memory:fcd08000-fcd08fff
  *-scsi
       physical id: 1
       bus info: scsi@9
       logical name: scsi9
       capabilities: scsi-host
       configuration: driver=usb-storage
Bus info          Device  Class       Description
=================================================
pci@0000:01:00.0          storage     SSD 660P Series
pci@0000:02:00.1          storage     X370 Series Chipset SATA Controller
usb@5:2                   storage     DISK
pci@0000:0c:00.2          storage     FCH SATA Controller [AHCI mode]
scsi@9            scsi9   storage

Output of lspci -v:

Summary
$ lspci -v
00:00.0 Host bridge: Advanced Micro Devices, Inc. [AMD] Family 17h (Models 00h-0fh) Root Complex
	Subsystem: ASUSTeK Computer Inc. Family 17h (Models 00h-0fh) Root Complex
	Flags: fast devsel

00:00.2 IOMMU: Advanced Micro Devices, Inc. [AMD] Family 17h (Models 00h-0fh) I/O Memory Management Unit
	Subsystem: ASUSTeK Computer Inc. Family 17h (Models 00h-0fh) I/O Memory Management Unit
	Flags: fast devsel, IRQ 27
	Capabilities: <access denied>

00:01.0 Host bridge: Advanced Micro Devices, Inc. [AMD] Family 17h (Models 00h-1fh) PCIe Dummy Host Bridge
	Flags: fast devsel

00:01.1 PCI bridge: Advanced Micro Devices, Inc. [AMD] Family 17h (Models 00h-0fh) PCIe GPP Bridge (prog-if 00 [Normal decode])
	Flags: bus master, fast devsel, latency 0, IRQ 28
	Bus: primary=00, secondary=01, subordinate=01, sec-latency=0
	I/O behind bridge: None
	Memory behind bridge: fcf00000-fcffffff [size=1M]
	Prefetchable memory behind bridge: None
	Capabilities: <access denied>
	Kernel driver in use: pcieport

00:01.3 PCI bridge: Advanced Micro Devices, Inc. [AMD] Family 17h (Models 00h-0fh) PCIe GPP Bridge (prog-if 00 [Normal decode])
	Flags: bus master, fast devsel, latency 0, IRQ 29
	Bus: primary=00, secondary=02, subordinate=09, sec-latency=0
	I/O behind bridge: 0000e000-0000efff [size=4K]
	Memory behind bridge: fca00000-fccfffff [size=3M]
	Prefetchable memory behind bridge: None
	Capabilities: <access denied>
	Kernel driver in use: pcieport

00:02.0 Host bridge: Advanced Micro Devices, Inc. [AMD] Family 17h (Models 00h-1fh) PCIe Dummy Host Bridge
	DeviceName:  Onboard IGD
	Flags: fast devsel

00:03.0 Host bridge: Advanced Micro Devices, Inc. [AMD] Family 17h (Models 00h-1fh) PCIe Dummy Host Bridge
	Flags: fast devsel

00:03.1 PCI bridge: Advanced Micro Devices, Inc. [AMD] Family 17h (Models 00h-0fh) PCIe GPP Bridge (prog-if 00 [Normal decode])
	Flags: bus master, fast devsel, latency 0, IRQ 30
	Bus: primary=00, secondary=0a, subordinate=0a, sec-latency=0
	I/O behind bridge: 0000d000-0000dfff [size=4K]
	Memory behind bridge: fce00000-fcefffff [size=1M]
	Prefetchable memory behind bridge: 00000000e0000000-00000000f07fffff [size=264M]
	Capabilities: <access denied>
	Kernel driver in use: pcieport

00:04.0 Host bridge: Advanced Micro Devices, Inc. [AMD] Family 17h (Models 00h-1fh) PCIe Dummy Host Bridge
	Flags: fast devsel

00:07.0 Host bridge: Advanced Micro Devices, Inc. [AMD] Family 17h (Models 00h-1fh) PCIe Dummy Host Bridge
	Flags: fast devsel

00:07.1 PCI bridge: Advanced Micro Devices, Inc. [AMD] Family 17h (Models 00h-0fh) Internal PCIe GPP Bridge 0 to Bus B (prog-if 00 [Normal decode])
	Flags: bus master, fast devsel, latency 0, IRQ 31
	Bus: primary=00, secondary=0b, subordinate=0b, sec-latency=0
	I/O behind bridge: None
	Memory behind bridge: fc700000-fc9fffff [size=3M]
	Prefetchable memory behind bridge: None
	Capabilities: <access denied>
	Kernel driver in use: pcieport

00:08.0 Host bridge: Advanced Micro Devices, Inc. [AMD] Family 17h (Models 00h-1fh) PCIe Dummy Host Bridge
	Flags: fast devsel

00:08.1 PCI bridge: Advanced Micro Devices, Inc. [AMD] Family 17h (Models 00h-0fh) Internal PCIe GPP Bridge 0 to Bus B (prog-if 00 [Normal decode])
	Flags: bus master, fast devsel, latency 0, IRQ 32
	Bus: primary=00, secondary=0c, subordinate=0c, sec-latency=0
	I/O behind bridge: None
	Memory behind bridge: fcd00000-fcdfffff [size=1M]
	Prefetchable memory behind bridge: None
	Capabilities: <access denied>
	Kernel driver in use: pcieport

00:14.0 SMBus: Advanced Micro Devices, Inc. [AMD] FCH SMBus Controller (rev 59)
	Subsystem: ASUSTeK Computer Inc. FCH SMBus Controller
	Flags: 66MHz, medium devsel
	Kernel driver in use: piix4_smbus
	Kernel modules: i2c_piix4, sp5100_tco

00:14.3 ISA bridge: Advanced Micro Devices, Inc. [AMD] FCH LPC Bridge (rev 51)
	Subsystem: ASUSTeK Computer Inc. FCH LPC Bridge
	Flags: bus master, 66MHz, medium devsel, latency 0

00:18.0 Host bridge: Advanced Micro Devices, Inc. [AMD] Family 17h (Models 00h-0fh) Data Fabric: Device 18h; Function 0
	Flags: fast devsel

00:18.1 Host bridge: Advanced Micro Devices, Inc. [AMD] Family 17h (Models 00h-0fh) Data Fabric: Device 18h; Function 1
	Flags: fast devsel

00:18.2 Host bridge: Advanced Micro Devices, Inc. [AMD] Family 17h (Models 00h-0fh) Data Fabric: Device 18h; Function 2
	Flags: fast devsel

00:18.3 Host bridge: Advanced Micro Devices, Inc. [AMD] Family 17h (Models 00h-0fh) Data Fabric: Device 18h; Function 3
	Flags: fast devsel
	Kernel driver in use: k10temp
	Kernel modules: k10temp

00:18.4 Host bridge: Advanced Micro Devices, Inc. [AMD] Family 17h (Models 00h-0fh) Data Fabric: Device 18h; Function 4
	Flags: fast devsel

00:18.5 Host bridge: Advanced Micro Devices, Inc. [AMD] Family 17h (Models 00h-0fh) Data Fabric: Device 18h; Function 5
	Flags: fast devsel

00:18.6 Host bridge: Advanced Micro Devices, Inc. [AMD] Family 17h (Models 00h-0fh) Data Fabric: Device 18h; Function 6
	Flags: fast devsel

00:18.7 Host bridge: Advanced Micro Devices, Inc. [AMD] Family 17h (Models 00h-0fh) Data Fabric: Device 18h; Function 7
	Flags: fast devsel

01:00.0 Non-Volatile memory controller: Intel Corporation SSD 660P Series (rev 03) (prog-if 02 [NVM Express])
	Subsystem: Intel Corporation SSDPEKNW020T8 [660p, 2TB]
	Flags: bus master, fast devsel, latency 0, IRQ 41, NUMA node 0
	Memory at fcf00000 (64-bit, non-prefetchable) [size=16K]
	Capabilities: <access denied>
	Kernel driver in use: nvme

02:00.0 USB controller: Advanced Micro Devices, Inc. [AMD] X370 Series Chipset USB 3.1 xHCI Controller (rev 02) (prog-if 30 [XHCI])
	Subsystem: ASMedia Technology Inc. X370 Series Chipset USB 3.1 xHCI Controller
	Flags: bus master, fast devsel, latency 0, IRQ 58
	Memory at fcca0000 (64-bit, non-prefetchable) [size=32K]
	Capabilities: <access denied>
	Kernel driver in use: xhci_hcd
	Kernel modules: xhci_pci

02:00.1 SATA controller: Advanced Micro Devices, Inc. [AMD] X370 Series Chipset SATA Controller (rev 02) (prog-if 01 [AHCI 1.0])
	Subsystem: ASMedia Technology Inc. X370 Series Chipset SATA Controller
	Flags: bus master, fast devsel, latency 0, IRQ 55
	Memory at fcc80000 (32-bit, non-prefetchable) [size=128K]
	Expansion ROM at fcc00000 [disabled] [size=512K]
	Capabilities: <access denied>
	Kernel driver in use: ahci
	Kernel modules: ahci

02:00.2 PCI bridge: Advanced Micro Devices, Inc. [AMD] X370 Series Chipset PCIe Upstream Port (rev 02) (prog-if 00 [Normal decode])
	Flags: bus master, fast devsel, latency 0, IRQ 33
	Bus: primary=02, secondary=03, subordinate=09, sec-latency=0
	I/O behind bridge: 0000e000-0000efff [size=4K]
	Memory behind bridge: fca00000-fcbfffff [size=2M]
	Prefetchable memory behind bridge: None
	Capabilities: <access denied>
	Kernel driver in use: pcieport

03:00.0 PCI bridge: Advanced Micro Devices, Inc. [AMD] 300 Series Chipset PCIe Port (rev 02) (prog-if 00 [Normal decode])
	Flags: bus master, fast devsel, latency 0, IRQ 34
	Bus: primary=03, secondary=04, subordinate=04, sec-latency=0
	I/O behind bridge: None
	Memory behind bridge: None
	Prefetchable memory behind bridge: None
	Capabilities: <access denied>
	Kernel driver in use: pcieport

03:02.0 PCI bridge: Advanced Micro Devices, Inc. [AMD] 300 Series Chipset PCIe Port (rev 02) (prog-if 00 [Normal decode])
	Flags: bus master, fast devsel, latency 0, IRQ 35
	Bus: primary=03, secondary=05, subordinate=05, sec-latency=0
	I/O behind bridge: None
	Memory behind bridge: None
	Prefetchable memory behind bridge: None
	Capabilities: <access denied>
	Kernel driver in use: pcieport

03:03.0 PCI bridge: Advanced Micro Devices, Inc. [AMD] 300 Series Chipset PCIe Port (rev 02) (prog-if 00 [Normal decode])
	Flags: bus master, fast devsel, latency 0, IRQ 37
	Bus: primary=03, secondary=06, subordinate=06, sec-latency=0
	I/O behind bridge: None
	Memory behind bridge: None
	Prefetchable memory behind bridge: None
	Capabilities: <access denied>
	Kernel driver in use: pcieport

03:04.0 PCI bridge: Advanced Micro Devices, Inc. [AMD] 300 Series Chipset PCIe Port (rev 02) (prog-if 00 [Normal decode])
	Flags: bus master, fast devsel, latency 0, IRQ 38
	Bus: primary=03, secondary=07, subordinate=07, sec-latency=0
	I/O behind bridge: None
	Memory behind bridge: fcb00000-fcbfffff [size=1M]
	Prefetchable memory behind bridge: None
	Capabilities: <access denied>
	Kernel driver in use: pcieport

03:06.0 PCI bridge: Advanced Micro Devices, Inc. [AMD] 300 Series Chipset PCIe Port (rev 02) (prog-if 00 [Normal decode])
	Flags: bus master, fast devsel, latency 0, IRQ 39
	Bus: primary=03, secondary=08, subordinate=08, sec-latency=0
	I/O behind bridge: 0000e000-0000efff [size=4K]
	Memory behind bridge: fca00000-fcafffff [size=1M]
	Prefetchable memory behind bridge: None
	Capabilities: <access denied>
	Kernel driver in use: pcieport

03:07.0 PCI bridge: Advanced Micro Devices, Inc. [AMD] 300 Series Chipset PCIe Port (rev 02) (prog-if 00 [Normal decode])
	Flags: bus master, fast devsel, latency 0, IRQ 40
	Bus: primary=03, secondary=09, subordinate=09, sec-latency=0
	I/O behind bridge: None
	Memory behind bridge: None
	Prefetchable memory behind bridge: None
	Capabilities: <access denied>
	Kernel driver in use: pcieport

07:00.0 USB controller: ASMedia Technology Inc. ASM1143 USB 3.1 Host Controller (prog-if 30 [XHCI])
	Subsystem: ASUSTeK Computer Inc. ASM1143 USB 3.1 Host Controller
	Flags: bus master, fast devsel, latency 0, IRQ 59
	Memory at fcb00000 (64-bit, non-prefetchable) [size=32K]
	Capabilities: <access denied>
	Kernel driver in use: xhci_hcd
	Kernel modules: xhci_pci

08:00.0 Ethernet controller: Intel Corporation I211 Gigabit Network Connection (rev 03)
	Subsystem: ASUSTeK Computer Inc. I211 Gigabit Network Connection
	Flags: bus master, fast devsel, latency 0, IRQ 24
	Memory at fca00000 (32-bit, non-prefetchable) [size=128K]
	I/O ports at e000 [size=32]
	Memory at fca20000 (32-bit, non-prefetchable) [size=16K]
	Capabilities: <access denied>
	Kernel driver in use: igb
	Kernel modules: igb

0a:00.0 VGA compatible controller: Advanced Micro Devices, Inc. [AMD/ATI] Hawaii PRO [Radeon R9 290/390] (prog-if 00 [VGA controller])
	Subsystem: Gigabyte Technology Co., Ltd Hawaii PRO [Radeon R9 290/390]
	Flags: bus master, fast devsel, latency 0, IRQ 72
	Memory at e0000000 (64-bit, prefetchable) [size=256M]
	Memory at f0000000 (64-bit, prefetchable) [size=8M]
	I/O ports at d000 [size=256]
	Memory at fce00000 (32-bit, non-prefetchable) [size=256K]
	Expansion ROM at 000c0000 [disabled] [size=128K]
	Capabilities: <access denied>
	Kernel driver in use: amdgpu
	Kernel modules: radeon, amdgpu

0a:00.1 Audio device: Advanced Micro Devices, Inc. [AMD/ATI] Hawaii HDMI Audio [Radeon R9 290/290X / 390/390X]
	Subsystem: Gigabyte Technology Co., Ltd Hawaii HDMI Audio [Radeon R9 290/290X / 390/390X]
	Flags: bus master, fast devsel, latency 0, IRQ 68
	Memory at fce60000 (64-bit, non-prefetchable) [size=16K]
	Capabilities: <access denied>
	Kernel driver in use: snd_hda_intel
	Kernel modules: snd_hda_intel

0b:00.0 Non-Essential Instrumentation [1300]: Advanced Micro Devices, Inc. [AMD] Zeppelin/Raven/Raven2 PCIe Dummy Function
	Subsystem: ASUSTeK Computer Inc. Zeppelin/Raven/Raven2 PCIe Dummy Function
	Flags: fast devsel
	Capabilities: <access denied>

0b:00.2 Encryption controller: Advanced Micro Devices, Inc. [AMD] Family 17h (Models 00h-0fh) Platform Security Processor
	Subsystem: ASUSTeK Computer Inc. Family 17h (Models 00h-0fh) Platform Security Processor
	Flags: bus master, fast devsel, latency 0, IRQ 51
	Memory at fc800000 (32-bit, non-prefetchable) [size=1M]
	Memory at fc900000 (32-bit, non-prefetchable) [size=8K]
	Capabilities: <access denied>
	Kernel driver in use: ccp
	Kernel modules: ccp

0b:00.3 USB controller: Advanced Micro Devices, Inc. [AMD] Family 17h (Models 00h-0fh) USB 3.0 Host Controller (prog-if 30 [XHCI])
	Subsystem: ASUSTeK Computer Inc. Family 17h (Models 00h-0fh) USB 3.0 Host Controller
	Flags: bus master, fast devsel, latency 0, IRQ 61
	Memory at fc700000 (64-bit, non-prefetchable) [size=1M]
	Capabilities: <access denied>
	Kernel driver in use: xhci_hcd
	Kernel modules: xhci_pci

0c:00.0 Non-Essential Instrumentation [1300]: Advanced Micro Devices, Inc. [AMD] Zeppelin/Renoir PCIe Dummy Function
	Subsystem: ASUSTeK Computer Inc. Zeppelin/Renoir PCIe Dummy Function
	Flags: fast devsel
	Capabilities: <access denied>

0c:00.2 SATA controller: Advanced Micro Devices, Inc. [AMD] FCH SATA Controller [AHCI mode] (rev 51) (prog-if 01 [AHCI 1.0])
	Subsystem: ASUSTeK Computer Inc. FCH SATA Controller [AHCI mode]
	Flags: bus master, fast devsel, latency 0, IRQ 57
	Memory at fcd08000 (32-bit, non-prefetchable) [size=4K]
	Capabilities: <access denied>
	Kernel driver in use: ahci
	Kernel modules: ahci

0c:00.3 Audio device: Advanced Micro Devices, Inc. [AMD] Family 17h (Models 00h-0fh) HD Audio Controller
	Subsystem: ASUSTeK Computer Inc. Family 17h (Models 00h-0fh) HD Audio Controller
	Flags: bus master, fast devsel, latency 0, IRQ 70
	Memory at fcd00000 (32-bit, non-prefetchable) [size=32K]
	Capabilities: <access denied>
	Kernel driver in use: snd_hda_intel
	Kernel modules: snd_hda_intel
1 Like

Doesn’t look like this is gonna get any traction. Maybe glances is just too obscure :man_shrugging: I’m going back to conky I guess, but now I have questions about that. I’m just gonna reply here rather than make a new post. If anyone comes across this I’d still be interested to hear any feedback about glances. Anyway, moving on…

I’ve almost got conky in an acceptably working state, but there are a few things I’d like to add, and I’d like to clean it up to make it more efficient if I could.

Here is my .conkyrc:

Summary
conky.config={
alignment="top_left",
minimum_width=460,
maximum_width=460,
minimum_height=1051,
border_inner_margin=4,
default_bar_height=4,
default_bar_width=226,
default_color="FFFFFF",
default_graph_height=14,
default_graph_width=226,
xinerama_head=1,
double_buffer=true,
draw_shades=false,
draw_graph_borders=true,
show_graph_scale=true,
gap_x=1454,
gap_y=0,
font="Sans Serif:style=Bold:size=8",
own_window=true,
own_window_argb_value=128,
own_window_argb_visual=true,
own_window_colour="000000",
own_window_hints="undecorated,below,sticky,skip_taskbar,skip_pager",
own_window_transparent=false,
own_window_type="panel",
update_interval=3,
uppercase=false,
use_xft=true,
};

conky.text=[[
SYSTEM ${hr 5}

${alignc}'${nodename}'
${alignc}${exec lsb_release -d | cut -f 2}
${alignc}linux ${kernel}
${alignc}Uptime: ${uptime_short}

CPU, GPU, & MEM${hr 5}

CPU${goto 36}Frequency${goto 104}Usage${goto 233}|${goto 240}PROCESSES${alignr}${processes}
0${goto 36}${freq 1} MHz${goto 104}${cpugraph cpu1 12,94 181818 16A085}${goto 200}${cpu cpu1}${goto 222}%${goto 233}|${goto 240}${top name 1}${alignr}${top cpu 1}%
1${goto 36}${freq 2} MHz${goto 104}${cpugraph cpu2 12,94 181818 16A085}${goto 200}${cpu cpu2}${goto 222}%${goto 233}|${goto 240}${top name 2}${alignr}${top cpu 2}%
2${goto 36}${freq 3} MHz${goto 104}${cpugraph cpu3 12,94 181818 16A085}${goto 200}${cpu cpu3}${goto 222}%${goto 233}|${goto 240}${top name 3}${alignr}${top cpu 3}%
3${goto 36}${freq 4} MHz${goto 104}${cpugraph cpu4 12,94 181818 16A085}${goto 200}${cpu cpu4}${goto 222}%${goto 233}|${goto 240}${top name 4}${alignr}${top cpu 4}%
4${goto 36}${freq 5} MHz${goto 104}${cpugraph cpu5 12,94 181818 16A085}${goto 200}${cpu cpu5}${goto 222}%${goto 233}|${goto 240}${top name 5}${alignr}${top cpu 5}%
5${goto 36}${freq 6} MHz${goto 104}${cpugraph cpu6 12,94 181818 16A085}${goto 200}${cpu cpu6}${goto 222}%${goto 233}|${goto 240}${top name 6}${alignr}${top cpu 6}%
6${goto 36}${freq 7} MHz${goto 104}${cpugraph cpu7 12,94 181818 16A085}${goto 200}${cpu cpu7}${goto 222}%${goto 233}|${goto 240}${top name 7}${alignr}${top cpu 7}%
7${goto 36}${freq 8} MHz${goto 104}${cpugraph cpu8 12,94 181818 16A085}${goto 200}${cpu cpu8}${goto 222}%${goto 233}|
8${goto 36}${freq 9} MHz${goto 104}${cpugraph cpu9 12,94 181818 16A085}${goto 200}${cpu cpu9}${goto 222}%${goto 233}|${goto 240}MEMORY${alignr}${mem} / ${memmax} (${memperc}%)
9${goto 36}${freq 10} MHz${goto 104}${cpugraph cpu10 12,94 181818 16A085}${goto 200}${cpu cpu10}${goto 222}%${goto 233}|${alignr}${memgraph 10,226 181818 16A085}
10${goto 36}${freq 11} MHz${goto 104}${cpugraph cpu11 12,94 181818 16A085}${goto 200}${cpu cpu11}${goto 222}%${goto 233}|${goto 240}${top_mem name 1}${alignr}${top_mem mem_res 1}
11${goto 36}${freq 12} MHz${goto 104}${cpugraph cpu12 12,94 181818 16A085}${goto 200}${cpu cpu12}${goto 222}%${goto 233}|${goto 240}${top_mem name 2}${alignr}${top_mem mem_res 2}
12${goto 36}${freq 13} MHz${goto 104}${cpugraph cpu13 12,94 181818 16A085}${goto 200}${cpu cpu13}${goto 222}%${goto 233}|${goto 240}${top_mem name 3}${alignr}${top_mem mem_res 3}
13${goto 36}${freq 14} MHz${goto 104}${cpugraph cpu14 12,94 181818 16A085}${goto 200}${cpu cpu14}${goto 222}%${goto 233}|${goto 240}${top_mem name 4}${alignr}${top_mem mem_res 4}
14${goto 36}${freq 15} MHz${goto 104}${cpugraph cpu15 12,94 181818 16A085}${goto 200}${cpu cpu15}${goto 222}%${goto 233}|${goto 240}${top_mem name 5}${alignr}${top_mem mem_res 5}
15${goto 36}${freq 16} MHz${goto 104}${cpugraph cpu16 12,94 181818 16A085}${goto 200}${cpu cpu16}${goto 222}%${goto 233}|${goto 240}${top_mem name 6}${alignr}${top_mem mem_res 6}

Overall CPU Usage${goto 200}${cpu}${goto 222}%${goto 240}GPU Core Usage${alignr}placeholder %
${cpugraph cpu0 30,226 181818 16A085}${alignr}${execgraph "echo "0"" 30,226 181818 16A085 100}
CPU Temperature${goto 194}${exec ~/.conky-get-cpu-temp.sh}°C${goto 240}GPU Temperature${alignr}${exec ~/.conky-get-gpu-temp.sh}°C
${execgraph "~/.conky-get-cpu-temp.sh" 30,226 181818 16A085 100}${alignr}${execgraph "~/.conky-get-gpu-temp.sh" 30,226 181818 16A085 100}
CPU Voltage${goto 198}${exec ~/.conky-get-cpu-voltage.sh}V${goto 240}GPU Voltage${alignr}placeholder V
${execgraph "~/.conky-get-cpu-voltage.sh" 30,226 181818 16A085 1.60}${alignr}${execgraph "echo "0"" 30,226 181818 16A085 100}
CPU Fans${goto 176}${exec ~/.conky-get-cpu-fan-rpm.sh}${goto 204}RPM${goto 240}GPU Fans${alignr}${exec ~/.conky-get-gpu-fan-percent.sh}%
${execgraph "~/.conky-get-cpu-fan-percent.sh" 30,226 181818 16A085 100}${alignr}${execgraph "~/.conky-get-gpu-fan-percent.sh" 30,226 181818 16A085 100}
Intake Fans${goto 176}${exec ~/.conky-get-intake-fan-rpm.sh}${goto 204}RPM${goto 240}GPU Frequency${alignr}${exec ~/.conky-get-gpu-core-frequency.sh}MHz
${execgraph "~/.conky-get-intake-fan-percent.sh" 30,226 181818 16A085 100}${alignr}${execgraph "~/.conky-get-gpu-core-frequency-percent.sh" 30,226 181818 16A085 100}
Exhaust Fan${goto 176}${exec ~/.conky-get-exhaust-fan-rpm.sh}${goto 204}RPM${goto 240}VRAM Frequency${alignr}${exec ~/.conky-get-vram-frequency.sh}MHz
${execgraph "~/.conky-get-exhaust-fan-percent.sh" 30,226 181818 16A085 100}${alignr}${execgraph "~/.conky-get-vram-frequency-percent.sh" 30,226 181818 16A085 100}
HDD Fans${goto 176}${exec ~/.conky-get-hdd-fan-rpm.sh}${goto 204}RPM${goto 240}VRAM Usage${alignr}${exec ~/.conky-get-gpu-mem-used.sh} / ${exec ~/.conky-get-gpu-mem-total.sh}MiB (${exec ~/.conky-get-gpu-mem-used-percent.sh}%)
${execgraph "~/.conky-get-hdd-fan-percent.sh" 30,226 181818 16A085 100}${alignr}${execgraph "~/.conky-get-gpu-mem-used-percent.sh" 30,226 181818 16A085 100}

DISKS${hr 5}
${goto 233}|
/dev/sdd${goto 100}${fs_used /} / ${fs_size /} (${fs_used_perc /}%)${goto 233}|
${fs_bar /}${goto 233}|
${goto 233}|
NETWORK ${hr 5}

${alignc}Intel Corporation I211 Gigabit Network Connection (rev 03)

Down${goto 186}${downspeed enp8s0}${goto 240}Up${alignr}${upspeed enp8s0}
${downspeedgraph enp8s0 30,226 181818 16A085}${alignr}${upspeedgraph enp8s0 30,226 181818 16A085}
Total${goto 186}${totaldown enp38s0}${goto 240}Total${alignr}${totalup enp8s0}
]]

And a screenshot of it running:

Summary

So after some reading I’ve been able to get the gpu core temp and frequency by reading some “files” in /sys/class/drm/card0/device/... and /sys/kernel/debug/dri/0/... but I’m not too comfortable poking around in there tbh.

Questions:

  • Where can I snag the GPU core usage % and GPU core voltage? (It’s an AMD R9 290 and I’m using the amdgpu driver)
  • Is it possible to read the “SVI2 TFN” voltage for the CPU? The one that the motherboard sensor (that I’m reading now) isn’t right because it doesn’t account for vdroop.

The other thing is, as you can see, it calls bash scripts for each temperature, voltage, etc. and most of those scripts call sensors individually.
What I’d like to do is call sensors one time per refresh interval, store the entire output in memory temporarily, and then parse that output into the needed variables.
Problem is I can’t seem to figure out how to even declare a variable in conky.

Is this possible?

EDIT: Oh right I almost forgot…what the heck is going on with my network downspeed graph? It puts the number in black inside of the graph, and the total below always reads 0B. wth? :dizzy_face:

1 Like

To work around not knowing how to store variables in conky; I’ve instead created a ramdisk, and reworked all my bash scripts into a single script, to store the variables in various text files on said disk. I’m trying to run the script as a systemd service on a timer, but the time intervals are completely random.

Here is my script (which works fine when it’s actually invoked):

Summary
#!/bin/bash
sensors > /mnt/sensordata/sensors-output.txt
cat /mnt/sensordata/sensors-output.txt | grep 'k10temp-pci-00c3' -A3 | grep 'Tdie' | awk '{print $2}' | cut -c 2-5 > /mnt/sensordata/cpu-core-temp.txt
STRCPUVOLTUNITS=$(cat /mnt/sensordata/sensors-output.txt | grep 'it8665-isa-0290' -A23 | grep 'in0' | awk '{print $3}')
FLOATCPUVOLTS=$(cat /mnt/sensordata/sensors-output.txt | grep 'it8665-isa-0290' -A23 | grep 'in0' | awk '{print $2}')
if [ "${STRCPUVOLTUNITS}" == "mV" ];
then echo "scale=2; $(echo "${FLOATCPUVOLTS}")/1000" | bc > /mnt/sensordata/cpu-volts.txt;
else echo "${FLOATCPUVOLTS}" > /mnt/sensordata/cpu-volts.txt;
fi
cat /mnt/sensordata/sensors-output.txt | grep 'it8665-isa-0290' -A23 | grep 'fan1' | awk '{print $2}' > /mnt/sensordata/cpu-fans.txt
echo "scale=1; $(cat /mnt/sensordata/cpu-fans.txt)"/20 | bc > /mnt/sensordata/cpu-fans-percent.txt
cat /mnt/sensordata/sensors-output.txt | grep 'it8665-isa-0290' -A23 | grep 'fan6' | awk '{print $2}' > /mnt/sensordata/intake-fans.txt
echo "scale=1; $(cat /mnt/sensordata/intake-fans.txt)"/16.4 | bc > /mnt/sensordata/intake-fans-percent.txt
cat /mnt/sensordata/sensors-output.txt | grep 'it8665-isa-0290' -A23 | grep 'fan2' | awk '{print $2}' > /mnt/sensordata/exhaust-fan.txt
echo "scale=1; $(cat /mnt/sensordata/exhaust-fan.txt)"/20.6 | bc > /mnt/sensordata/exhaust-fan-percent.txt
cat /mnt/sensordata/sensors-output.txt | grep 'it8665-isa-0290' -A23 | grep 'fan3' | awk '{print $2}' > /mnt/sensordata/hdd-fans.txt
echo "scale=1; $(cat /mnt/sensordata/hdd-fans.txt)"/24.2 | bc > /mnt/sensordata/hdd-fans-percent.txt
echo "0" | tee /mnt/sensordata/gpu-core-usage.txt >> /mnt/sensordata/gpu-core-volts.txt
cat /mnt/sensordata/sensors-output.txt | grep 'amdgpu-pci-0a00' -A5 | grep 'edge' | awk '{print $2}' | cut -c 2-5 > /mnt/sensordata/gpu-core-temp.txt
echo "scale=1; $(cat /sys/devices/pci0000\:00/0000\:00\:03.1/0000\:0a\:00.0/hwmon/hwmon?/pwm1)/2.55" | bc > /mnt/sensordata/gpu-fan-percent.txt
echo "scale=0; $(cat /sys/devices/pci0000\:00/0000\:00\:03.1/0000\:0a\:00.0/hwmon/hwmon?/freq1_input)"/1000000 | bc > /mnt/sensordata/gpu-core-frequency.txt
echo "scale=0; $(cat /mnt/sensordata/gpu-core-frequency.txt)"/12 | bc > /mnt/sensordata/gpu-core-frequency-percent.txt
echo "0" > /mnt/sensordata/gpu-core-usage.txt
echo "scale=0; $(cat /sys/devices/pci0000\:00/0000\:00\:03.1/0000\:0a\:00.0/hwmon/hwmon?/freq2_input)"/1000000 | bc > /mnt/sensordata/gpu-vram-frequency.txt
echo "scale=0; $(cat /sys/devices/pci0000\:00/0000\:00\:03.1/0000\:0a\:00.0/drm/card?/device/mem_info_vram_used)"/1048576 | bc > /mnt/sensordata/gpu-vram-used.txt
echo "scale=0; $(cat /sys/devices/pci0000\:00/0000\:00\:03.1/0000\:0a\:00.0/drm/card?/device/mem_info_vram_total)"/1048576 | bc > /mnt/sensordata/gpu-vram-total.txt
echo "scale=1; $(cat /mnt/sensordata/gpu-vram-used.txt)"\*100/"$(cat /mnt/sensordata/gpu-vram-total.txt)" | bc > /mnt/sensordata/gpu-vram-used-percent.txt

…and my .service and .timer files (same file name different extension):

Summary
[Unit]
Description=Get and store temporary sensor values

[Service]
Type=simple
ExecStart=/bin/bash /home/user1/.sensordata.sh
RemainAfterExit=false

[Install]
WantedBy=multi-user.target
[Unit]
Description=Timer for refreshing stored sensor data

[Timer]
OnBootSec=30sec
OnUnitActiveSec=3sec

[Install]
WantedBy=timers.target

…and here is my problem:

Summary
Feb 22 17:06:42 COMPUTER0 systemd[1]: Started Get and store temporary sensor values.
Feb 22 17:06:43 COMPUTER0 systemd[1]: store-temporary-sensor-data.service: Succeeded.
Feb 22 17:07:42 COMPUTER0 systemd[1]: Started Get and store temporary sensor values.
Feb 22 17:07:43 COMPUTER0 systemd[1]: store-temporary-sensor-data.service: Succeeded.
Feb 22 17:08:01 COMPUTER0 systemd[1]: Started Get and store temporary sensor values.
Feb 22 17:08:01 COMPUTER0 systemd[1]: store-temporary-sensor-data.service: Succeeded.
Feb 22 17:08:42 COMPUTER0 systemd[1]: Started Get and store temporary sensor values.
Feb 22 17:08:43 COMPUTER0 systemd[1]: store-temporary-sensor-data.service: Succeeded.
Feb 22 17:09:31 COMPUTER0 systemd[1]: Started Get and store temporary sensor values.
Feb 22 17:09:32 COMPUTER0 systemd[1]: store-temporary-sensor-data.service: Succeeded.
Feb 22 17:09:42 COMPUTER0 systemd[1]: Started Get and store temporary sensor values.
Feb 22 17:09:43 COMPUTER0 systemd[1]: store-temporary-sensor-data.service: Succeeded.
Feb 22 17:09:52 COMPUTER0 systemd[1]: Started Get and store temporary sensor values.
Feb 22 17:09:52 COMPUTER0 systemd[1]: store-temporary-sensor-data.service: Succeeded.
Feb 22 17:09:57 COMPUTER0 systemd[1]: Started Get and store temporary sensor values.
Feb 22 17:09:58 COMPUTER0 systemd[1]: store-temporary-sensor-data.service: Succeeded.
Feb 22 17:10:22 COMPUTER0 systemd[1]: Started Get and store temporary sensor values.
Feb 22 17:10:23 COMPUTER0 systemd[1]: store-temporary-sensor-data.service: Succeeded.
Feb 22 17:10:42 COMPUTER0 systemd[1]: Started Get and store temporary sensor values.
Feb 22 17:10:43 COMPUTER0 systemd[1]: store-temporary-sensor-data.service: Succeeded.
Feb 22 17:11:00 COMPUTER0 systemd[1]: Started Get and store temporary sensor values.
Feb 22 17:11:01 COMPUTER0 systemd[1]: store-temporary-sensor-data.service: Succeeded.
Feb 22 17:11:42 COMPUTER0 systemd[1]: Started Get and store temporary sensor values.
Feb 22 17:11:43 COMPUTER0 systemd[1]: store-temporary-sensor-data.service: Succeeded.
Feb 22 17:12:31 COMPUTER0 systemd[1]: Started Get and store temporary sensor values.
Feb 22 17:12:32 COMPUTER0 systemd[1]: store-temporary-sensor-data.service: Succeeded.
Feb 22 17:12:42 COMPUTER0 systemd[1]: Started Get and store temporary sensor values.
Feb 22 17:12:43 COMPUTER0 systemd[1]: store-temporary-sensor-data.service: Succeeded.
Feb 22 17:13:13 COMPUTER0 systemd[1]: Started Get and store temporary sensor values.
Feb 22 17:13:14 COMPUTER0 systemd[1]: store-temporary-sensor-data.service: Succeeded.
Feb 22 17:13:42 COMPUTER0 systemd[1]: Started Get and store temporary sensor values.
Feb 22 17:13:43 COMPUTER0 systemd[1]: store-temporary-sensor-data.service: Succeeded.
Feb 22 17:14:00 COMPUTER0 systemd[1]: Started Get and store temporary sensor values.
Feb 22 17:14:01 COMPUTER0 systemd[1]: store-temporary-sensor-data.service: Succeeded.
Feb 22 17:14:42 COMPUTER0 systemd[1]: Started Get and store temporary sensor values.
Feb 22 17:14:43 COMPUTER0 systemd[1]: store-temporary-sensor-data.service: Succeeded.
Feb 22 17:15:30 COMPUTER0 systemd[1]: Started Get and store temporary sensor values.
Feb 22 17:15:31 COMPUTER0 systemd[1]: store-temporary-sensor-data.service: Succeeded.
Feb 22 17:15:42 COMPUTER0 systemd[1]: Started Get and store temporary sensor values.
Feb 22 17:15:43 COMPUTER0 systemd[1]: store-temporary-sensor-data.service: Succeeded.
Feb 22 17:16:42 COMPUTER0 systemd[1]: Started Get and store temporary sensor values.
Feb 22 17:16:43 COMPUTER0 systemd[1]: store-temporary-sensor-data.service: Succeeded.

The service is only running every few seconds to a minute at random intervals. For some reason it seems to prefer to run at every Xhr:Xmin:42 seconds plus some other random times thrown in.

What the hell am I doing wrong?

EDIT: Oh btw for some reason if I spam the terminal with systemctl status commands it refreshes as it should:

Summary
[user1@COMPUTER0 ~]$ sudo systemctl status store-temporary-sensor-data.service
● store-temporary-sensor-data.service - Get and store temporary sensor values
   Loaded: loaded (/etc/systemd/system/store-temporary-sensor-data.service; disabled; vendor preset: disabled)
   Active: active (running) since Sat 2020-02-22 17:52:14 AST; 13ms ago
 Main PID: 27075 (bash)
    Tasks: 2 (limit: 4915)
   Memory: 1.2M
   CGroup: /system.slice/store-temporary-sensor-data.service
           ├─27075 /bin/bash /home/user1/.sensordata.sh
           └─27076 sensors

Feb 22 17:52:14 COMPUTER0 systemd[1]: Started Get and store temporary sensor values.
[user1@COMPUTER0 ~]$ sudo systemctl status store-temporary-sensor-data.service
● store-temporary-sensor-data.service - Get and store temporary sensor values
   Loaded: loaded (/etc/systemd/system/store-temporary-sensor-data.service; disabled; vendor preset: disabled)
   Active: inactive (dead) since Sat 2020-02-22 17:52:15 AST; 835ms ago
  Process: 27075 ExecStart=/bin/bash /home/user1/.sensordata.sh (code=exited, status=0/SUCCESS)
 Main PID: 27075 (code=exited, status=0/SUCCESS)

Feb 22 17:52:14 COMPUTER0 systemd[1]: Started Get and store temporary sensor values.
Feb 22 17:52:15 COMPUTER0 systemd[1]: store-temporary-sensor-data.service: Succeeded.
[user1@COMPUTER0 ~]$ sudo systemctl status store-temporary-sensor-data.service
● store-temporary-sensor-data.service - Get and store temporary sensor values
   Loaded: loaded (/etc/systemd/system/store-temporary-sensor-data.service; disabled; vendor preset: disabled)
   Active: active (running) since Sat 2020-02-22 17:52:17 AST; 16ms ago
 Main PID: 27178 (bash)
    Tasks: 2 (limit: 4915)
   Memory: 1.3M
   CGroup: /system.slice/store-temporary-sensor-data.service
           ├─27178 /bin/bash /home/user1/.sensordata.sh
           └─27179 sensors

Feb 22 17:52:17 COMPUTER0 systemd[1]: Started Get and store temporary sensor values.
[user1@COMPUTER0 ~]$ sudo systemctl status store-temporary-sensor-data.service
● store-temporary-sensor-data.service - Get and store temporary sensor values
   Loaded: loaded (/etc/systemd/system/store-temporary-sensor-data.service; disabled; vendor preset: disabled)
   Active: inactive (dead) since Sat 2020-02-22 17:52:18 AST; 681ms ago
  Process: 27178 ExecStart=/bin/bash /home/user1/.sensordata.sh (code=exited, status=0/SUCCESS)
 Main PID: 27178 (code=exited, status=0/SUCCESS)

Feb 22 17:52:17 COMPUTER0 systemd[1]: Started Get and store temporary sensor values.
Feb 22 17:52:18 COMPUTER0 systemd[1]: store-temporary-sensor-data.service: Succeeded.
[user1@COMPUTER0 ~]$ sudo systemctl status store-temporary-sensor-data.service
● store-temporary-sensor-data.service - Get and store temporary sensor values
   Loaded: loaded (/etc/systemd/system/store-temporary-sensor-data.service; disabled; vendor preset: disabled)
   Active: inactive (dead) since Sat 2020-02-22 17:52:18 AST; 1s ago
  Process: 27178 ExecStart=/bin/bash /home/user1/.sensordata.sh (code=exited, status=0/SUCCESS)
 Main PID: 27178 (code=exited, status=0/SUCCESS)

Feb 22 17:52:17 COMPUTER0 systemd[1]: Started Get and store temporary sensor values.
Feb 22 17:52:18 COMPUTER0 systemd[1]: store-temporary-sensor-data.service: Succeeded.
[user1@COMPUTER0 ~]$ sudo systemctl status store-temporary-sensor-data.service
● store-temporary-sensor-data.service - Get and store temporary sensor values
   Loaded: loaded (/etc/systemd/system/store-temporary-sensor-data.service; disabled; vendor preset: disabled)
   Active: active (running) since Sat 2020-02-22 17:52:21 AST; 15ms ago
 Main PID: 27292 (bash)
    Tasks: 2 (limit: 4915)
   Memory: 1.3M
   CGroup: /system.slice/store-temporary-sensor-data.service
           ├─27292 /bin/bash /home/user1/.sensordata.sh
           └─27293 sensors

Feb 22 17:52:21 COMPUTER0 systemd[1]: Started Get and store temporary sensor values.
[user1@COMPUTER0 ~]$ sudo systemctl status store-temporary-sensor-data.service
● store-temporary-sensor-data.service - Get and store temporary sensor values
   Loaded: loaded (/etc/systemd/system/store-temporary-sensor-data.service; disabled; vendor preset: disabled)
   Active: inactive (dead) since Sat 2020-02-22 17:52:21 AST; 564ms ago
  Process: 27292 ExecStart=/bin/bash /home/user1/.sensordata.sh (code=exited, status=0/SUCCESS)
 Main PID: 27292 (code=exited, status=0/SUCCESS)

Feb 22 17:52:21 COMPUTER0 systemd[1]: Started Get and store temporary sensor values.
Feb 22 17:52:21 COMPUTER0 systemd[1]: store-temporary-sensor-data.service: Succeeded.
[user1@COMPUTER0 ~]$ sudo systemctl status store-temporary-sensor-data.service
● store-temporary-sensor-data.service - Get and store temporary sensor values
   Loaded: loaded (/etc/systemd/system/store-temporary-sensor-data.service; disabled; vendor preset: disabled)
   Active: inactive (dead) since Sat 2020-02-22 17:52:21 AST; 1s ago
  Process: 27292 ExecStart=/bin/bash /home/user1/.sensordata.sh (code=exited, status=0/SUCCESS)
 Main PID: 27292 (code=exited, status=0/SUCCESS)

Feb 22 17:52:21 COMPUTER0 systemd[1]: Started Get and store temporary sensor values.
Feb 22 17:52:21 COMPUTER0 systemd[1]: store-temporary-sensor-data.service: Succeeded.
[user1@COMPUTER0 ~]$ sudo systemctl status store-temporary-sensor-data.service
● store-temporary-sensor-data.service - Get and store temporary sensor values
   Loaded: loaded (/etc/systemd/system/store-temporary-sensor-data.service; disabled; vendor preset: disabled)
   Active: active (running) since Sat 2020-02-22 17:52:24 AST; 13ms ago
 Main PID: 27405 (bash)
    Tasks: 2 (limit: 4915)
   Memory: 1.3M
   CGroup: /system.slice/store-temporary-sensor-data.service
           ├─27405 /bin/bash /home/user1/.sensordata.sh
           └─27406 sensors

Feb 22 17:52:24 COMPUTER0 systemd[1]: Started Get and store temporary sensor values.
[user1@COMPUTER0 ~]$ sudo systemctl status store-temporary-sensor-data.service
● store-temporary-sensor-data.service - Get and store temporary sensor values
   Loaded: loaded (/etc/systemd/system/store-temporary-sensor-data.service; disabled; vendor preset: disabled)
   Active: inactive (dead) since Sat 2020-02-22 17:52:25 AST; 518ms ago
  Process: 27405 ExecStart=/bin/bash /home/user1/.sensordata.sh (code=exited, status=0/SUCCESS)
 Main PID: 27405 (code=exited, status=0/SUCCESS)

Feb 22 17:52:24 COMPUTER0 systemd[1]: Started Get and store temporary sensor values.
Feb 22 17:52:25 COMPUTER0 systemd[1]: store-temporary-sensor-data.service: Succeeded.
[user1@COMPUTER0 ~]$ sudo systemctl status store-temporary-sensor-data.service
● store-temporary-sensor-data.service - Get and store temporary sensor values
   Loaded: loaded (/etc/systemd/system/store-temporary-sensor-data.service; disabled; vendor preset: disabled)
   Active: inactive (dead) since Sat 2020-02-22 17:52:25 AST; 1s ago
  Process: 27405 ExecStart=/bin/bash /home/user1/.sensordata.sh (code=exited, status=0/SUCCESS)
 Main PID: 27405 (code=exited, status=0/SUCCESS)

Feb 22 17:52:24 COMPUTER0 systemd[1]: Started Get and store temporary sensor values.
Feb 22 17:52:25 COMPUTER0 systemd[1]: store-temporary-sensor-data.service: Succeeded.
[user1@COMPUTER0 ~]$ sudo systemctl status store-temporary-sensor-data.service
● store-temporary-sensor-data.service - Get and store temporary sensor values
   Loaded: loaded (/etc/systemd/system/store-temporary-sensor-data.service; disabled; vendor preset: disabled)
   Active: inactive (dead) since Sat 2020-02-22 17:52:25 AST; 2s ago
  Process: 27405 ExecStart=/bin/bash /home/user1/.sensordata.sh (code=exited, status=0/SUCCESS)
 Main PID: 27405 (code=exited, status=0/SUCCESS)

Feb 22 17:52:24 COMPUTER0 systemd[1]: Started Get and store temporary sensor values.
Feb 22 17:52:25 COMPUTER0 systemd[1]: store-temporary-sensor-data.service: Succeeded.
[user1@COMPUTER0 ~]$ sudo systemctl status store-temporary-sensor-data.service
● store-temporary-sensor-data.service - Get and store temporary sensor values
   Loaded: loaded (/etc/systemd/system/store-temporary-sensor-data.service; disabled; vendor preset: disabled)
   Active: active (running) since Sat 2020-02-22 17:52:28 AST; 18ms ago
 Main PID: 27512 (bash)
    Tasks: 2 (limit: 4915)
   Memory: 1.3M
   CGroup: /system.slice/store-temporary-sensor-data.service
           ├─27512 /bin/bash /home/user1/.sensordata.sh
           └─27514 sensors

Feb 22 17:52:28 COMPUTER0 systemd[1]: Started Get and store temporary sensor values.

Here is the gkrellm theme I still use on an old box (red and orange on clear background):

This conky theme is a bit outdated, I’ve since updated it so I’ll push an update later tonight to github after I’m home from work, but perhaps it will help:

The conky config is set up for a ryzen 2700, but I’ve since fixed some graphical glitches by changing some values around. I also run a vega 56 so the reporting is based on radeontop.

Hope this helps a bit.

1 Like

Thanks for the links. I’ve almost got things the way I want. I thought the gpu_busy_percent was broken because every time I checked it it was reading 0, but the other night I watched it with -n 0.1 and played some video and ran Unigine Valley and it is actually working. Also found where I can snag the actual VRAM freq.

So the only thing I need is to get my GPU Vcore, and preferably my “SVI2 TFN” voltage (the one reported by the CPU as it accounts for vdroop, as opposed to the one reported by the motherboard’s it8665 chip, which is what the VRM is outputting).

I’m thinking maybe the reason I can’t get gpu vcore is because I’m running a modified VBIOS, so I’ll throw the stock one back on at some point and see if I can snag it with that. If so, then I guess I’ll have to decide if I want to run the stock BIOS or be able to monitor gpu vcore.

EDIT:
This is what I’m able to see in /sys/devices for GPU stuff. Not sure where I would find the CPU’s sensors though:

Summary

[user1@COMPUTER0 ~]$ ls -ashl /sys/devices/pci0000:00/0000:00:03.1/0000:0a:00.0/
total 0
0 drwxr-xr-x 13 root root 0 Feb 24 01:41 .
0 drwxr-xr-x 11 root root 0 Feb 24 01:41 …
0 -r–r--r-- 1 root root 4.0K Feb 24 05:41 aer_dev_correctable
0 -r–r--r-- 1 root root 4.0K Feb 24 05:41 aer_dev_fatal
0 -r–r--r-- 1 root root 4.0K Feb 24 05:41 aer_dev_nonfatal
0 -r–r--r-- 1 root root 4.0K Feb 24 05:41 ari_enabled
0 -r–r--r-- 1 root root 4.0K Feb 24 05:41 boot_vga
0 -rw-r–r-- 1 root root 4.0K Feb 24 05:41 broken_parity_status
0 -r–r--r-- 1 root root 4.0K Feb 24 05:41 class
0 -rw-r–r-- 1 root root 4.0K Feb 24 05:41 config
0 -r–r--r-- 1 root root 4.0K Feb 24 05:41 consistent_dma_mask_bits
0 -r–r--r-- 1 root root 4.0K Feb 24 05:41 current_link_speed
0 -r–r--r-- 1 root root 4.0K Feb 24 05:41 current_link_width
0 -rw-r–r-- 1 root root 4.0K Feb 24 05:41 d3cold_allowed
0 -r–r--r-- 1 root root 4.0K Feb 24 05:41 device
0 --w------- 1 root root 4.0K Feb 24 05:41 dev_rescan
0 -r–r--r-- 1 root root 4.0K Feb 24 05:41 devspec
0 -r–r--r-- 1 root root 4.0K Feb 24 05:41 dma_mask_bits
0 lrwxrwxrwx 1 root root 0 Feb 24 05:41 driver -> …/…/…/…/bus/pci/drivers/amdgpu
0 -rw-r–r-- 1 root root 4.0K Feb 24 05:41 driver_override
0 drwxr-xr-x 4 root root 0 Feb 24 05:41 drm
0 -rw-r–r-- 1 root root 4.0K Feb 24 05:41 enable
0 lrwxrwxrwx 1 root root 0 Feb 24 05:41 firmware_node -> …/…/…/LNXSYSTM:00/LNXSYBUS:00/PNP0A08:00/device:0f/device:10
0 drwxr-xr-x 2 root root 0 Feb 24 05:42 fw_version
0 -r–r--r-- 1 root root 4.0K Feb 24 05:42 gpu_busy_percent
0 drwxr-xr-x 3 root root 0 Feb 24 05:41 graphics
0 drwxr-xr-x 3 root root 0 Feb 24 05:41 hwmon
0 drwxr-xr-x 3 root root 0 Feb 24 05:41 i2c-19
0 drwxr-xr-x 3 root root 0 Feb 24 05:41 i2c-21
0 drwxr-xr-x 3 root root 0 Feb 24 05:41 i2c-22
0 drwxr-xr-x 3 root root 0 Feb 24 05:41 i2c-23
0 lrwxrwxrwx 1 root root 0 Feb 24 05:41 iommu -> …/…/0000:00:00.2/iommu/ivhd0
0 lrwxrwxrwx 1 root root 0 Feb 24 05:41 iommu_group -> …/…/…/…/kernel/iommu_groups/16
0 -r–r--r-- 1 root root 4.0K Feb 24 05:41 irq
0 drwxr-xr-x 2 root root 0 Feb 24 05:41 link
0 -r–r--r-- 1 root root 4.0K Feb 24 05:41 local_cpulist
0 -r–r--r-- 1 root root 4.0K Feb 24 05:41 local_cpus
0 -r–r--r-- 1 root root 4.0K Feb 24 05:41 max_link_speed
0 -r–r--r-- 1 root root 4.0K Feb 24 05:41 max_link_width
0 -r–r--r-- 1 root root 4.0K Feb 24 05:42 mem_busy_percent
0 -r–r--r-- 1 root root 4.0K Feb 24 05:42 mem_info_gtt_total
0 -r–r--r-- 1 root root 4.0K Feb 24 05:42 mem_info_gtt_used
0 -r–r--r-- 1 root root 4.0K Feb 24 05:42 mem_info_vis_vram_total
0 -r–r--r-- 1 root root 4.0K Feb 24 05:42 mem_info_vis_vram_used
0 -r–r--r-- 1 root root 4.0K Feb 24 05:42 mem_info_vram_total
0 -r–r--r-- 1 root root 4.0K Feb 24 05:42 mem_info_vram_used
0 -r–r--r-- 1 root root 4.0K Feb 24 05:42 mem_info_vram_vendor
0 -r–r--r-- 1 root root 4.0K Feb 24 05:41 modalias
0 -rw-r–r-- 1 root root 4.0K Feb 24 05:41 msi_bus
0 drwxr-xr-x 2 root root 0 Feb 24 05:42 msi_irqs
0 -rw-r–r-- 1 root root 4.0K Feb 24 05:41 numa_node
0 -r–r--r-- 1 root root 4.0K Feb 24 05:42 pcie_bw
0 -r–r--r-- 1 root root 4.0K Feb 24 05:42 pcie_replay_count
0 drwxr-xr-x 2 root root 0 Feb 24 05:41 power
0 -rw-r–r-- 1 root root 4.0K Feb 24 05:41 power_dpm_force_performance_level
0 -rw-r–r-- 1 root root 4.0K Feb 24 05:41 power_dpm_state
0 -r–r--r-- 1 root root 4.0K Feb 24 05:42 pp_cur_state
0 -rw-r–r-- 1 root root 4.0K Feb 24 05:42 pp_dpm_mclk
0 -rw-r–r-- 1 root root 4.0K Feb 24 05:42 pp_dpm_pcie
0 -rw-r–r-- 1 root root 4.0K Feb 24 05:42 pp_dpm_sclk
0 -rw-r–r-- 1 root root 4.0K Feb 24 05:42 pp_force_state
0 -rw-r–r-- 1 root root 4.0K Feb 24 05:42 pp_mclk_od
0 -r–r--r-- 1 root root 4.0K Feb 24 05:42 pp_num_states
0 -rw-r–r-- 1 root root 4.0K Feb 24 05:42 pp_power_profile_mode
0 -rw-r–r-- 1 root root 4.0K Feb 24 05:42 pp_sclk_od
0 -rw-r–r-- 1 root root 4.0K Feb 24 05:42 pp_table
0 --w–w---- 1 root root 4.0K Feb 24 05:41 remove
0 --w------- 1 root root 4.0K Feb 24 05:41 reset
0 -r–r--r-- 1 root root 4.0K Feb 24 05:41 resource
0 -rw------- 1 root root 256M Feb 24 05:41 resource0
0 -rw------- 1 root root 256M Feb 24 05:41 resource0_wc
0 -rw------- 1 root root 8.0M Feb 24 05:41 resource2
0 -rw------- 1 root root 8.0M Feb 24 05:41 resource2_wc
0 -rw------- 1 root root 256 Feb 24 05:41 resource4
0 -rw------- 1 root root 256K Feb 24 05:41 resource5
0 -r–r--r-- 1 root root 4.0K Feb 24 05:41 revision
0 -rw------- 1 root root 128K Feb 24 05:41 rom
0 lrwxrwxrwx 1 root root 0 Feb 24 01:41 subsystem -> …/…/…/…/bus/pci
0 -r–r--r-- 1 root root 4.0K Feb 24 05:41 subsystem_device
0 -r–r--r-- 1 root root 4.0K Feb 24 05:41 subsystem_vendor
0 -rw-r–r-- 1 root root 4.0K Feb 24 01:41 uevent
0 -r–r--r-- 1 root root 4.0K Feb 24 05:42 vbios_version
0 -r–r--r-- 1 root root 4.0K Feb 24 05:41 vendor

[user1@COMPUTER0 ~]$ ls -ashl /sys/devices/pci0000:00/0000:00:03.1/0000:0a:00.0/hwmon/hwmon?
total 0
0 drwxr-xr-x 3 root root 0 Feb 24 05:41 .
0 drwxr-xr-x 3 root root 0 Feb 24 05:41 …
0 lrwxrwxrwx 1 root root 0 Feb 24 05:41 device -> …/…/…/0000:0a:00.0
0 -rw-r–r-- 1 root root 4.0K Feb 24 05:42 fan1_enable
0 -r–r--r-- 1 root root 4.0K Feb 24 05:41 fan1_input
0 -r–r--r-- 1 root root 4.0K Feb 24 05:41 fan1_max
0 -r–r--r-- 1 root root 4.0K Feb 24 05:41 fan1_min
0 -rw-r–r-- 1 root root 4.0K Feb 24 05:42 fan1_target
0 -r–r--r-- 1 root root 4.0K Feb 24 05:42 freq1_input
0 -r–r--r-- 1 root root 4.0K Feb 24 05:42 freq1_label
0 -r–r--r-- 1 root root 4.0K Feb 24 05:42 freq2_input
0 -r–r--r-- 1 root root 4.0K Feb 24 05:42 freq2_label
0 -r–r--r-- 1 root root 4.0K Feb 24 05:41 in0_input
0 -r–r--r-- 1 root root 4.0K Feb 24 05:42 in0_label
0 -r–r--r-- 1 root root 4.0K Feb 24 05:41 name
0 drwxr-xr-x 2 root root 0 Feb 24 05:42 power
0 -r–r--r-- 1 root root 4.0K Feb 24 05:41 power1_average
0 -rw-r–r-- 1 root root 4.0K Feb 24 05:41 power1_cap
0 -r–r--r-- 1 root root 4.0K Feb 24 05:42 power1_cap_max
0 -r–r--r-- 1 root root 4.0K Feb 24 05:42 power1_cap_min
0 -rw-r–r-- 1 root root 4.0K Feb 24 05:42 pwm1
0 -rw-r–r-- 1 root root 4.0K Feb 24 05:42 pwm1_enable
0 -r–r--r-- 1 root root 4.0K Feb 24 05:42 pwm1_max
0 -r–r--r-- 1 root root 4.0K Feb 24 05:42 pwm1_min
0 lrwxrwxrwx 1 root root 0 Feb 24 05:42 subsystem -> …/…/…/…/…/…/class/hwmon
0 -r–r--r-- 1 root root 4.0K Feb 24 05:41 temp1_crit
0 -r–r--r-- 1 root root 4.0K Feb 24 05:41 temp1_crit_hyst
0 -r–r--r-- 1 root root 4.0K Feb 24 05:41 temp1_input
0 -r–r--r-- 1 root root 4.0K Feb 24 05:42 temp1_label
0 -rw-r–r-- 1 root root 4.0K Feb 24 05:41 uevent

EDIT2: Oh right and the other issue is what am I doing wrong with my systemd timer/service that it won’t refresh every 3 secs?

EDIT:
===WARNING! DOING THIS MAY CAUSE A MEMORY LEAK DUE TO OVERWRITING FILES ON A TMPFS. MAKE SURE YOU EXPLICITLY DELETE ANY FILES ON THE TMPFS BEFORE WRITING TO THEM.===
Also kernel 5.6 allows seeing the Vcore reported by the CPU itself, as well as Icore, VSoC, and ISoC. I will post updated versions below.

Most of my issues are resolved, so I’m making a possibly final post here summarizing what I did, in case any other newbies come across this that are in the same boat as I was last week.
I won’t close it though, in case anyone wants to add info about glances or amdgpu, or has suggestions on how to make this more efficient, etc., as there are still some minor issues.

A lot of what I wrote in earlier posts will be duplicated here, so it’s all in one place, and no one will have to read all of my verbal diarrhea from the entire thread.

Okay, so…
First off, I added an entry to my fstab, so I have a place to store my sensors output in memory for parsing, and therefore don’t have to call sensors multiple times per refresh interval:

# /mnt/sensordata
tmpfs /mnt/sensordata tmpfs rw,size=1M,noexec,nodev,nosuid,uid=user1,mode=1700 0 0

Next, I’ve written a bash script to snag and store the data on the ramdisk:

===WARNING! DO NOT DO THIS OR YOU MAY CAUSE A MEMORY LEAK===

Summary
#!/bin/bash
sensors > /mnt/sensordata/sensors-output.txt
cat /mnt/sensordata/sensors-output.txt | grep 'k10temp-pci-00c3' -A3 | grep 'Tdie' | awk '{print $2}' | cut -c 2-5 > /mnt/sensordata/cpu-core-temp.txt
STRCPUVOLTUNITS=$(cat /mnt/sensordata/sensors-output.txt | grep 'it8665-isa-0290' -A23 | grep 'in0' | awk '{print $3}')
FLOATCPUVOLTS=$(cat /mnt/sensordata/sensors-output.txt | grep 'it8665-isa-0290' -A23 | grep 'in0' | awk '{print $2}')
if [ "${STRCPUVOLTUNITS}" == "mV" ];
then echo "scale=2; $(echo "${FLOATCPUVOLTS}")/1000" | bc > /mnt/sensordata/cpu-volts.txt;
else echo "${FLOATCPUVOLTS}" > /mnt/sensordata/cpu-volts.txt;
fi
cat /mnt/sensordata/sensors-output.txt | grep 'it8665-isa-0290' -A23 | grep 'fan1' | awk '{print $2}' > /mnt/sensordata/cpu-fans.txt
echo "scale=1; $(cat /mnt/sensordata/cpu-fans.txt)"/20 | bc > /mnt/sensordata/cpu-fans-percent.txt
cat /mnt/sensordata/sensors-output.txt | grep 'it8665-isa-0290' -A23 | grep 'fan6' | awk '{print $2}' > /mnt/sensordata/intake-fans.txt
echo "scale=1; $(cat /mnt/sensordata/intake-fans.txt)"/16.4 | bc > /mnt/sensordata/intake-fans-percent.txt
cat /mnt/sensordata/sensors-output.txt | grep 'it8665-isa-0290' -A23 | grep 'fan2' | awk '{print $2}' > /mnt/sensordata/exhaust-fan.txt
echo "scale=1; $(cat /mnt/sensordata/exhaust-fan.txt)"/20.6 | bc > /mnt/sensordata/exhaust-fan-percent.txt
cat /mnt/sensordata/sensors-output.txt | grep 'it8665-isa-0290' -A23 | grep 'fan3' | awk '{print $2}' > /mnt/sensordata/hdd-fans.txt
echo "scale=1; $(cat /mnt/sensordata/hdd-fans.txt)"/24.2 | bc > /mnt/sensordata/hdd-fans-percent.txt
cat /sys/devices/pci0000\:00/0000\:00\:03.1/0000\:0a\:00.0/gpu_busy_percent > /mnt/sensordata/gpu-core-usage.txt
cat /mnt/sensordata/sensors-output.txt | grep 'amdgpu-pci-0a00' -A5 | grep 'edge' | awk '{print $2}' | cut -c 2-5 > /mnt/sensordata/gpu-core-temp.txt
echo "0" > /mnt/sensordata/gpu-core-volts.txt
echo "scale=0; $(cat /sys/devices/pci0000\:00/0000\:00\:03.1/0000\:0a\:00.0/hwmon/hwmon?/freq1_input)"/1000000 | bc > /mnt/sensordata/gpu-core-frequency.txt
echo "scale=0; $(cat /mnt/sensordata/gpu-core-frequency.txt)"/12 | bc > /mnt/sensordata/gpu-core-frequency-percent.txt
echo "scale=0; $(cat /sys/devices/pci0000\:00/0000\:00\:03.1/0000\:0a\:00.0/hwmon/hwmon?/freq2_input)"/1000000 | bc > /mnt/sensordata/gpu-vram-frequency.txt
echo "scale=0; $(cat /mnt/sensordata/gpu-vram-frequency.txt)"/15 | bc > /mnt/sensordata/gpu-vram-frequency-percent.txt
echo "scale=0; $(cat /sys/devices/pci0000\:00/0000\:00\:03.1/0000\:0a\:00.0/drm/card?/device/mem_info_vram_used)"/1048576 | bc > /mnt/sensordata/gpu-vram-used.txt
echo "scale=0; $(cat /sys/devices/pci0000\:00/0000\:00\:03.1/0000\:0a\:00.0/drm/card?/device/mem_info_vram_total)"/1048576 | bc > /mnt/sensordata/gpu-vram-total.txt
echo "scale=1; $(cat /mnt/sensordata/gpu-vram-used.txt)"\*100/"$(cat /mnt/sensordata/gpu-vram-total.txt)" | bc > /mnt/sensordata/gpu-vram-used-percent.txt
echo "scale=1; $(cat /sys/devices/pci0000\:00/0000\:00\:03.1/0000\:0a\:00.0/hwmon/hwmon?/pwm1)/2.55" | bc > /mnt/sensordata/gpu-fan-percent.txt

===END WARNING===

Next, the current state of my .conkyrc.

Summary
conky.config={
alignment="top_left",
minimum_width=460,
maximum_width=460,
minimum_height=1049,
border_inner_margin=4,
default_bar_height=4,
default_bar_width=226,
default_color="FFFFFF",
default_graph_height=14,
default_graph_width=226,
xinerama_head=1,
double_buffer=true,
draw_shades=false,
draw_graph_borders=true,
show_graph_scale=true,
gap_x=1454,
gap_y=0,
font="Sans Serif:style=Bold:size=8",
own_window=true,
own_window_argb_value=128,
own_window_argb_visual=true,
own_window_colour="000000",
own_window_hints="undecorated,below,sticky,skip_taskbar,skip_pager",
own_window_transparent=false,
own_window_type="panel",
update_interval=3,
uppercase=false,
use_xft=true,
};

conky.text=[[
SYSTEM ${hr 5}

${alignc}'${nodename}'
${alignc}${exec lsb_release -d | cut -f 2}
${alignc}linux ${kernel}
${alignc}Uptime: ${uptime_short}

CPU, GPU, & MEM${hr 5}

CPU${goto 36}Frequency${goto 104}Usage${goto 233}|${goto 240}PROCESSES${alignr}${processes}
0${goto 36}${freq 1} MHz${goto 104}${cpugraph cpu1 12,94 181818 16A085}${goto 200}${cpu cpu1}${goto 222}%${goto 233}|${goto 240}${top name 1}${alignr}${top cpu 1}%
1${goto 36}${freq 2} MHz${goto 104}${cpugraph cpu2 12,94 181818 16A085}${goto 200}${cpu cpu2}${goto 222}%${goto 233}|${goto 240}${top name 2}${alignr}${top cpu 2}%
2${goto 36}${freq 3} MHz${goto 104}${cpugraph cpu3 12,94 181818 16A085}${goto 200}${cpu cpu3}${goto 222}%${goto 233}|${goto 240}${top name 3}${alignr}${top cpu 3}%
3${goto 36}${freq 4} MHz${goto 104}${cpugraph cpu4 12,94 181818 16A085}${goto 200}${cpu cpu4}${goto 222}%${goto 233}|${goto 240}${top name 4}${alignr}${top cpu 4}%
4${goto 36}${freq 5} MHz${goto 104}${cpugraph cpu5 12,94 181818 16A085}${goto 200}${cpu cpu5}${goto 222}%${goto 233}|${goto 240}${top name 5}${alignr}${top cpu 5}%
5${goto 36}${freq 6} MHz${goto 104}${cpugraph cpu6 12,94 181818 16A085}${goto 200}${cpu cpu6}${goto 222}%${goto 233}|${goto 240}${top name 6}${alignr}${top cpu 6}%
6${goto 36}${freq 7} MHz${goto 104}${cpugraph cpu7 12,94 181818 16A085}${goto 200}${cpu cpu7}${goto 222}%${goto 233}|${goto 240}${top name 7}${alignr}${top cpu 7}%
7${goto 36}${freq 8} MHz${goto 104}${cpugraph cpu8 12,94 181818 16A085}${goto 200}${cpu cpu8}${goto 222}%${goto 233}|
8${goto 36}${freq 9} MHz${goto 104}${cpugraph cpu9 12,94 181818 16A085}${goto 200}${cpu cpu9}${goto 222}%${goto 233}|${goto 240}MEMORY${alignr}${mem} / ${memmax} (${memperc}%)
9${goto 36}${freq 10} MHz${goto 104}${cpugraph cpu10 12,94 181818 16A085}${goto 200}${cpu cpu10}${goto 222}%${goto 233}|${alignr}${memgraph 10,226 181818 16A085}
10${goto 36}${freq 11} MHz${goto 104}${cpugraph cpu11 12,94 181818 16A085}${goto 200}${cpu cpu11}${goto 222}%${goto 233}|${goto 240}${top_mem name 1}${alignr}${top_mem mem_res 1}
11${goto 36}${freq 12} MHz${goto 104}${cpugraph cpu12 12,94 181818 16A085}${goto 200}${cpu cpu12}${goto 222}%${goto 233}|${goto 240}${top_mem name 2}${alignr}${top_mem mem_res 2}
12${goto 36}${freq 13} MHz${goto 104}${cpugraph cpu13 12,94 181818 16A085}${goto 200}${cpu cpu13}${goto 222}%${goto 233}|${goto 240}${top_mem name 3}${alignr}${top_mem mem_res 3}
13${goto 36}${freq 14} MHz${goto 104}${cpugraph cpu14 12,94 181818 16A085}${goto 200}${cpu cpu14}${goto 222}%${goto 233}|${goto 240}${top_mem name 4}${alignr}${top_mem mem_res 4}
14${goto 36}${freq 15} MHz${goto 104}${cpugraph cpu15 12,94 181818 16A085}${goto 200}${cpu cpu15}${goto 222}%${goto 233}|${goto 240}${top_mem name 5}${alignr}${top_mem mem_res 5}
15${goto 36}${freq 16} MHz${goto 104}${cpugraph cpu16 12,94 181818 16A085}${goto 200}${cpu cpu16}${goto 222}%${goto 233}|${goto 240}${top_mem name 6}${alignr}${top_mem mem_res 6}

Overall CPU Usage${goto 200}${cpu}${goto 222}%${goto 240}GPU Core Usage${alignr}${exec "cat /mnt/sensordata/gpu-core-usage.txt"}%
${cpugraph cpu0 30,226 181818 16A085}${alignr}${execgraph "cat /mnt/sensordata/gpu-core-usage.txt" 30,226 181818 16A085 100}
CPU Temperature${goto 194}${exec "cat /mnt/sensordata/cpu-core-temp.txt"}°C${goto 240}GPU Temperature${alignr}${exec "cat /mnt/sensordata/gpu-core-temp.txt"}°C
${execgraph "cat /mnt/sensordata/cpu-core-temp.txt" 30,226 181818 16A085 100}${alignr}${execgraph "cat /mnt/sensordata/gpu-core-temp.txt" 30,226 181818 16A085 100}
CPU Voltage${goto 198}${exec "cat /mnt/sensordata/cpu-volts.txt"}V${goto 240}GPU Voltage${alignr}placeholder V
${execgraph "cat /mnt/sensordata/cpu-volts.txt" 30,226 181818 16A085 1.60}${alignr}${execgraph "echo "0"" 30,226 181818 16A085 100}
CPU Fans${goto 176}${exec "cat /mnt/sensordata/cpu-fans.txt}${goto 204}RPM${goto 240}GPU Fans${alignr}${exec "cat /mnt/sensordata/gpu-fan-percent.txt"}%
${execgraph "cat /mnt/sensordata/cpu-fans-percent.txt" 30,226 181818 16A085 100}${alignr}${execgraph "cat /mnt/sensordata/gpu-fan-percent.txt" 30,226 181818 16A085 100}
Intake Fans${goto 176}${exec "cat /mnt/sensordata/intake-fans.txt"}${goto 204}RPM${goto 240}GPU Frequency${alignr}${exec "cat /mnt/sensordata/gpu-core-frequency.txt"}MHz
${execgraph "cat /mnt/sensordata/intake-fans-percent.txt" 30,226 181818 16A085 100}${alignr}${execgraph "cat /mnt/sensordata/gpu-core-frequency-percent.txt" 30,226 181818 16A085 100}
Exhaust Fan${goto 176}${exec "cat /mnt/sensordata/exhaust-fan.txt"}${goto 204}RPM${goto 240}VRAM Frequency${alignr}${exec "cat /mnt/sensordata/gpu-vram-frequency.txt"}MHz
${execgraph "cat /mnt/sensordata/exhaust-fan-percent.txt" 30,226 181818 16A085 100}${alignr}${execgraph "cat /mnt/sensordata/gpu-vram-frequency-percent.txt" 30,226 181818 16A085 100}
HDD Fans${goto 176}${exec "cat /mnt/sensordata/hdd-fans.txt"}${goto 204}RPM${goto 240}VRAM Usage${alignr}${exec "cat /mnt/sensordata/gpu-vram-used.txt"} / ${exec "cat /mnt/sensordata/gpu-vram-total.txt"}MiB (${exec "cat /mnt/sensordata/gpu-vram-used-percent.txt"}%)
${execgraph "cat /mnt/sensordata/hdd-fans-percent.txt" 30,226 181818 16A085 100}${alignr}${execgraph "cat /mnt/sensordata/gpu-vram-used-percent.txt" 30,226 181818 16A085 100}

DISKS${hr 5}
${goto 233}|
/dev/sdd${goto 100}${fs_used /} / ${fs_size /} (${fs_used_perc /}%)${goto 233}|
${fs_bar /}${goto 233}|
${goto 233}|
NETWORK ${hr 5}

${alignc}Intel Corporation I211 Gigabit Network Connection (rev 03)

Down${goto 186}${downspeed enp8s0}${goto 240}Up${alignr}${upspeed enp8s0}
${downspeedgraph enp8s0 30,226 181818 16A085}${alignr}${upspeedgraph enp8s0 30,226 181818 16A085}
Total${goto 186}${totaldown enp38s0}${goto 240}Total${alignr}${totalup enp8s0}
]]

To automate starting the script and conky at boot, I’ve created a couple systemd services and associated timers. These units are placed in /etc/systemd/system. The timer has to have the same file name as the service (but with the “.timer” extension instead), in order for it to find the service file automatically, without specifically pointing to it.

First, the one that calls the sensordata.sh script. The reason this was not working earlier is because I didn’t RTFM and had to add AccuracySec= to the [Timer] section. Otherwise, the default accuracy of timers is only 1 minute intervals. @vlycop gave me the solution here (Thanks again dude!):

Summary

Need help with a systemd timer

I played around with different OnUnitActiveSec= and AccuracySec= values until it would run without throwing Start request repeated too quickly and start-limit-hit errors. I wanted to get the interval down to 2 seconds but that wasn’t working out, so I’m sticking with 3. YMMV. One caveat is if you set AccuracySec= too low it can mess with your idle efficiency as your CPU has to wake too often (according to what I read anyway).

systemd unit files here:

Summary

Contents of store-temporary-sensor-data.timer:

[Unit]
Description=Timer for refreshing stored sensor data

[Timer]
OnBootSec=16sec
OnUnitActiveSec=2990ms
AccuracySec=10ms

[Install]
WantedBy=timers.target

Contents of store-temporary-sensor-data.service:

[Unit]
Description=Get and store temporary sensor values

[Service]
Type=simple
ExecStart=/bin/bash /home/user1/.sensordata.sh
RemainAfterExit=false

[Install]
WantedBy=multi-user.target

Contents of conky.timer:

[Unit]
Description=Conky auto-start timer

[Timer]
OnBootSec=20sec

[Install]
WantedBy=timers.target

Contents of conky.service:

[Unit]
Description=Conky
Wants=store-temporary-sensor-data

[Service]
User=user1
Type=simple
ExecStart=/usr/bin/conky --display=:0
RemainAfterExit=false

[Install]
WantedBy=multi-user.target

The --display=:0 argument was necessary, otherwise conky would throw a can't open display error. If you get this error, and need to find out the right number to punch in there, you can run echo $DISPLAY in the terminal.

User=user1 is necessary so the service doesn’t run as root, and can find your .conkyrc

So that’s it! Hopefully this wall of text helps someone else down the road, or they found it informative at the very least. That’ll make be feel better about beating my head against a wall on this for days :laughing:

A couple “issues” I’m still having:

  • My network downspeed total isn’t displaying correctly
  • I can’t find where to snag my GPU core voltage. /sys/class/drm/card1/device/hwmon/hwmon?/in0_input is my VDDCI/AUX (memory controller) voltage, and in1_input does not exist. This might be due to the fact that I’m running a modified VBIOS with a tweaked init regulator section in the VOI table, or it might just not be supported on Hawaii, not sure…I’ll have to test with the stock BIOS later maybe.
  • Not sure how efficient this is. If anyone has any other methods, or tips to clean up the script or config, I’ll take 'em. There’s a lot of cat’s , greps, and echoes flying around and I’m guessing I could compress it into an awk or sed one-liner if I had a clue what I was doing. Note that I tried to use head/tail in the conky config instead of exec "cat /mnt/sensordata/..." to grab the numbers out of the .txt files, but that was causing it to print extra newline chars. Maybe there’s a way to store the data in the .txt file without a newline char but I haven’t looked into it yet.
4 Likes

love that you summarized all of this, might help me out a bit on my next conky rabbit hole

Like I say, I hope someone finds it useful. It’ll probably me more useful for you if you have on old AMD gpu :stuck_out_tongue:

Also, small update…the reason I couldn’t see the “SVI2 TFN” voltage (the one reported by the CPU itself) is apparently because that just wasn’t a thing. As of kernel 5.6, the k10temp sensor can see that stuff now. The manjaro stable branch just got 5.6rc3 last night so now that’s woorking. Hooray!

And I should probably add a screenshot at this point so here it is:

1 Like

looks really clean!

Crikey, next you’ll be lobbying for Dtrace to be integrated into Linux…

I know you’re probably joking, but if it is gonna let me see the basic info I need to overclock and make sure I’m not overheating or overvolting then yeah sure

Yeah, you are right, was just kidding.
Good stuff on the Conkey though

Aww and I just got done sharpening up my pitchfork. Back in the closet it goes…

1 Like

So (over)writing to files on the tmpfs in the manner of command > /mytmpfs/file was causing a memory leak. Apparently files on a tmpfs need to be explicitly deleted before being written to. Who knew? :man_shrugging:
I’ve updated the script to do a rm -f /mytmpfs/file before writing to it.

I thought I was pretty much done with this but seems it’s very much still a work in progress.
Some stuff is just being done within the .conkyrc now, and the timer is handled by the script itself instead of systemd so it can more easily be reduced/played around with.
Anyway, I just wanted to get the info about the memory leak out there, so here the current “fixed” state of things (assuming something else isn’t broken):

.sensordata.sh

Summary
STARTTIME=$(date +%s)
RANONCE=false
mkdir -p /tmp/sensordata
while true; do
  CURRENTTIME=$(date +%s)
  ELAPSEDTIME=$((CURRENTTIME-STARTTIME))
  if [[ $ELAPSEDTIME == 0 && $RANONCE == true ]];
    then sleep 2
  elif [[ $ELAPSEDTIME == 2 && $RANONCE == true ]];
    then sleep 0.3
  elif [[ $ELAPSEDTIME == 1 && $RANONCE == true ]];
    then sleep 1
  else
    STARTTIME=$(date +%s)
    #
    #lines handled by conky have been commented out
    #
    #####################################
    #                CPU                #
    #####################################
    
    # k10temp Tdie
    rm -f /tmp/sensordata/cpu-core-temp.txt
    echo "scale=1; $(cat /sys/devices/pci0000\:00/0000\:00\:18.3/hwmon/hwmon?/temp1_input)/1000" | bc | tr -d '\n' > /tmp/sensordata/cpu-core-temp.txt
    
    # k10temp Vcore
    INTCPUVOLTS=$(cat /sys/devices/pci0000:00/0000:00:18.3/hwmon/hwmon?/in0_input)
    FLOATCPUVOLTS=$(echo "scale=3; $INTCPUVOLTS/1000" | bc)
    rm -f /tmp/sensordata/cpu-volts.txt
    if [[ $FLOATCPUVOLTS < 1 ]];
      then echo $FLOATCPUVOLTS | sed 's/./0./' | tr -d '\n' > /tmp/sensordata/cpu-volts.txt
    else echo $FLOATCPUVOLTS | tr -d '\n' > /tmp/sensordata/cpu-volts.txt
    fi
    
    # it8665 in0
    INTCPUVOLTS2=$(cat /sys/devices/platform/it87.656/hwmon/hwmon?/in0_input)
    FLOATCPUVOLTS2=$(echo "scale=3; $INTCPUVOLTS2/1000" | bc)
    rm -f /tmp/sensordata/cpu-volts-it8665.txt
    if [[ $FLOATCPUVOLTS2 < 1 ]];
      then echo $FLOATCPUVOLTS2 | sed 's/./0./' | tr -d '\n' > /tmp/sensordata/cpu-volts-it8665.txt
    else echo $FLOATCPUVOLTS2 | tr -d '\n' > /tmp/sensordata/cpu-volts-it8665.txt
    fi
    
    # k10temp Vsoc
    INTSOCVOLTS=$(cat /sys/devices/pci0000:00/0000:00:18.3/hwmon/hwmon?/in1_input)
    FLOATSOCVOLTS=$(echo "scale=3; $INTSOCVOLTS/1000" | bc)
    rm -f /tmp/sensordata/soc-volts.txt
    if [[ $FLOATSOCVOLTS < 1 ]];
      then echo $FLOATSOCVOLTS | sed 's/./0./' | tr -d '\n' > /tmp/sensordata/soc-volts.txt
    else echo $FLOATSOCVOLTS | tr -d '\n' > /tmp/sensordata/soc-volts.txt
    fi
    
    #####################################
    #              Memory               #
    #####################################
    rm -f /tmp/sensordata/meminfo.output
    cat /proc/meminfo > /tmp/sensordata/meminfo.output
    
    # total
    MEMTOTAL=$(grep MemTotal /tmp/sensordata/meminfo.output | awk '{print $2}')
    MEMTOTALMIB=$((MEMTOTAL/1024))
    rm -f /tmp/sensordata/mem-total.txt
    echo $MEMTOTALMIB | tr -d '\n' > /tmp/sensordata/mem-total.txt
    
    # used
    MEMFREE=$(grep MemFree /tmp/sensordata/meminfo.output | awk '{print $2}')
    MEMBUFFERS=$(grep Buffers /tmp/sensordata/meminfo.output | awk '{print $2}')
    MEMCACHED=$(grep Cached -m1 /tmp/sensordata/meminfo.output | awk '{print $2}')
    MEMSHMEM=$(grep Shmem -m1 /tmp/sensordata/meminfo.output | awk '{print $2}')
    MEMSRECLAIMABLE=$(grep SReclaimable /tmp/sensordata/meminfo.output | awk '{print $2}')
    MEMUSED=$((MEMTOTAL+MEMSHMEM-MEMFREE-MEMBUFFERS-MEMCACHED-MEMSRECLAIMABLE))
    MEMUSEDMIB=$((MEMUSED/1024))
    rm -f /tmp/sensordata/mem-used.txt
    echo $MEMUSEDMIB | tr -d '\n' > /tmp/sensordata/mem-used.txt

    # percent used
    rm -f /tmp/sensordata/mem-used-percent.txt
    echo "scale=1; ($(echo $MEMUSED)*100)/$(echo $MEMTOTAL)" | bc | tr -d '\n' > /tmp/sensordata/mem-used-percent.txt
    
    #####################################
    #               Fans                #
    #####################################
    
    # cpu
    rm -f /tmp/sensordata/cpu-fans.txt
    cat /sys/devices/platform/it87.656/hwmon/hwmon?/fan1_input | tr -d '\n' > /tmp/sensordata/cpu-fans.txt
    rm -f /tmp/sensordata/cpu-fans-percent.txt
    echo "scale=1; $(cat /tmp/sensordata/cpu-fans.txt)"/20 | bc | tr -d '\n' > /tmp/sensordata/cpu-fans-percent.txt
    
    # intake
    rm -f /tmp/sensordata/intake-fans.txt
    cat /sys/devices/platform/it87.656/hwmon/hwmon?/fan6_input | tr -d '\n' > /tmp/sensordata/intake-fans.txt
    rm -f /tmp/sensordata/intake-fans-percent.txt
    echo "scale=1; $(cat /tmp/sensordata/intake-fans.txt)"/16.4 | bc | tr -d '\n' > /tmp/sensordata/intake-fans-percent.txt
    
    # exhaust
    rm -f /tmp/sensordata/exhaust-fan.txt
    cat /sys/devices/platform/it87.656/hwmon/hwmon?/fan2_input | tr -d '\n' > /tmp/sensordata/exhaust-fan.txt
    rm -f /mnt/sensordata/exhaust-fan-percent.txt
    echo "scale=1; $(cat /tmp/sensordata/exhaust-fan.txt)"/20.6 | bc | tr -d '\n' > /tmp/sensordata/exhaust-fan-percent.txt
    
    # hdd
    rm -f /tmp/sensordata/hdd-fans.txt
    cat /sys/devices/platform/it87.656/hwmon/hwmon?/fan3_input | tr -d '\n' > /tmp/sensordata/hdd-fans.txt
    rm -f /tmp/sensordata/hdd-fans-percent.txt
    echo "scale=1; $(cat /tmp/sensordata/hdd-fans.txt)"/24.2 | bc | tr -d '\n' > /tmp/sensordata/hdd-fans-percent.txt
    
    #####################################
    #              R9 290               #
    #####################################
    
    # busy percent
    rm -f /tmp/sensordata/gpu-core-usage.txt
    cat /sys/devices/pci0000\:00/0000\:00\:03.1/0000\:0a\:00.0/gpu_busy_percent | tr -d '\n' > /tmp/sensordata/gpu-core-usage.txt
    
    # amdgpu edge
    rm -f /tmp/sensordata/gpu-core-temp.txt
    echo "scale=1; $(cat /sys/devices/pci0000\:00/0000\:00\:03.1/0000\:0a\:00.0/hwmon/hwmon?/temp1_input)"/1000 | bc | tr -d '\n' > /tmp/sensordata/gpu-core-temp.txt
    
    # vcore
    rm -f /tmp/sensordata/gpu-core-volts.txt
    echo "0" | tr -d '\n' > /tmp/sensordata/gpu-core-volts.txt
    
    # core frequency
    rm -f /tmp/sensordata/gpu-core-frequency.txt
    echo "scale=0; $(cat /sys/devices/pci0000\:00/0000\:00\:03.1/0000\:0a\:00.0/hwmon/hwmon?/freq1_input)"/1000000 | bc | tr -d '\n' > /tmp/sensordata/gpu-core-frequency.txt
    rm -f /tmp/sensordata/gpu-core-frequency-percent.txt
    echo "scale=0; $(cat /tmp/sensordata/gpu-core-frequency.txt)"/12 | bc | tr -d '\n' > /tmp/sensordata/gpu-core-frequency-percent.txt
    
    # vram frequency
    rm -f /tmp/sensordata/gpu-vram-frequency.txt
    echo "scale=0; $(cat /sys/devices/pci0000\:00/0000\:00\:03.1/0000\:0a\:00.0/hwmon/hwmon?/freq2_input)"/1000000 | bc | tr -d '\n' > /tmp/sensordata/gpu-vram-frequency.txt
    rm -f /tmp/sensordata/gpu-vram-frequency-percent.txt
    echo "scale=0; $(cat /tmp/sensordata/gpu-vram-frequency.txt)"/15 | bc | tr -d '\n' > /tmp/sensordata/gpu-vram-frequency-percent.txt
    
    # vram usage
    rm -f /tmp/sensordata/gpu-vram-total.txt
    echo "scale=0; $(cat /sys/devices/pci0000\:00/0000\:00\:03.1/0000\:0a\:00.0/drm/card?/device/mem_info_vram_total)"/1048576 | bc | tr -d '\n' > /tmp/sensordata/gpu-vram-total.txt
    rm -f /tmp/sensordata/gpu-vram-used.txt
    echo "scale=0; $(cat /sys/devices/pci0000\:00/0000\:00\:03.1/0000\:0a\:00.0/drm/card?/device/mem_info_vram_used)"/1048576 | bc | tr -d '\n' > /tmp/sensordata/gpu-vram-used.txt
    rm -f /tmp/sensordata/gpu-vram-used-percent.txt
    #if gpu-vram*.txt files do not exist, then
    #echo "scale=1; $(echo "scale=0; $(cat /sys/devices/pci0000\:00/0000\:00\:03.1/0000\:0a\:00.0/drm/card?/device/mem_info_vram_used)"/1048576 | bc)"\*100/"$(echo "scale=0; $(cat /sys/devices/pci0000\:00/0000\:00\:03.1/0000\:0a\:00.0/drm/card?/device/mem_info_vram_total)"/1048576 | bc)" | bc | tr -d '\n' > /tmp/sensordata/gpu-vram-used-percent.txt
    #if gpu-vram*.txt files exist, then
    echo "scale=1; $(cat /tmp/sensordata/gpu-vram-used.txt)"\*100/"$(cat /tmp/sensordata/gpu-vram-total.txt)" | bc | tr -d '\n' > /tmp/sensordata/gpu-vram-used-percent.txt
    # fan percent
    rm -f /tmp/sensordata/gpu-fan-percent.txt
    echo "scale=1; $(cat /sys/devices/pci0000\:00/0000\:00\:03.1/0000\:0a\:00.0/hwmon/hwmon?/pwm1)/2.55" | bc | tr -d '\n' > /tmp/sensordata/gpu-fan-percent.txt
    
    RANONCE=true
  fi
done

.conkyrc:

Summary
conky.config={
alignment="top_left",
minimum_width=460,
maximum_width=460,
minimum_height=1053,
border_inner_margin=2,
border_outer_margin=0,
border_width=0,
color0="16A085",
color1="05289B",
color2="0000DF",
color3="8F00AF",
color4="1300D9",
color5="4E00C5",
color6="181818",
default_bar_height=4,
default_bar_width=226,
default_color="FFFFFF",
default_graph_height=30,
default_graph_width=226,
xinerama_head=1,
double_buffer=true,
draw_shades=false,
draw_graph_borders=false,
show_graph_scale=false,
show_graph_range=false,
gap_x=1458,
gap_y=0,
font="Sans Serif:style=Bold:size=8",
own_window=true,
own_window_argb_value=224,
own_window_argb_visual=true,
own_window_colour="000000",
own_window_hints="undecorated,below,sticky,skip_taskbar,skip_pager",
own_window_transparent=false,
own_window_type="panel",
update_interval=3,
uppercase=false,
use_xft=true,
};

conky.text=[[
${image /home/user1/Documents/.conky/gradient.png}SYSTEM ${hr 5}

${alignc}'${nodename}'
${alignc}${exec "lsb_release -d | cut -f 2"}
${alignc}linux ${kernel}
${alignc}Uptime: ${uptime_short}

CPU, GPU, & MEM${hr 5}

CPU${goto 36}Frequency${goto 104}Usage${goto 233}|${goto 240}PROCESSES${alignr}${processes}
0${goto 36}${freq 1} MHz${goto 104}${cpugraph cpu1 12,94 4E00C5 1300D9}${goto 200}${cpu cpu1}${goto 222}%${goto 233}|${goto 240}${top name 1}${alignr}${top cpu 1}%
1${goto 36}${freq 2} MHz${goto 104}${cpugraph cpu2 12,94 4E00C5 1300D9}${goto 200}${cpu cpu2}${goto 222}%${goto 233}|${goto 240}${top name 2}${alignr}${top cpu 2}%
2${goto 36}${freq 3} MHz${goto 104}${cpugraph cpu3 12,94 4E00C5 1300D9}${goto 200}${cpu cpu3}${goto 222}%${goto 233}|${goto 240}${top name 3}${alignr}${top cpu 3}%
3${goto 36}${freq 4} MHz${goto 104}${cpugraph cpu4 12,94 4E00C5 1300D9}${goto 200}${cpu cpu4}${goto 222}%${goto 233}|${goto 240}${top name 4}${alignr}${top cpu 4}%
4${goto 36}${freq 5} MHz${goto 104}${cpugraph cpu5 12,94 4E00C5 1300D9}${goto 200}${cpu cpu5}${goto 222}%${goto 233}|${goto 240}${top name 5}${alignr}${top cpu 5}%
5${goto 36}${freq 6} MHz${goto 104}${cpugraph cpu6 12,94 4E00C5 1300D9}${goto 200}${cpu cpu6}${goto 222}%${goto 233}|${goto 240}${top name 6}${alignr}${top cpu 6}%
6${goto 36}${freq 7} MHz${goto 104}${cpugraph cpu7 12,94 4E00C5 1300D9}${goto 200}${cpu cpu7}${goto 222}%${goto 233}|${goto 240}${top name 7}${alignr}${top cpu 7}%
7${goto 36}${freq 8} MHz${goto 104}${cpugraph cpu8 12,94 4E00C5 1300D9}${goto 200}${cpu cpu8}${goto 222}%${goto 233}|
8${goto 36}${freq 9} MHz${goto 104}${cpugraph cpu9 12,94 4E00C5 1300D9}${goto 200}${cpu cpu9}${goto 222}%${goto 233}|${goto 240}MEMORY${alignr}${exec cat /tmp/sensordata/mem-used.txt} / ${exec cat /tmp/sensordata/mem-total.txt}MiB (${exec cat /tmp/sensordata/mem-used-percent.txt}%)
9${goto 36}${freq 10} MHz${goto 104}${cpugraph cpu10 12,94 4E00C5 1300D9}${goto 200}${cpu cpu10}${goto 222}%${goto 233}|${alignr}${execgraph "cat /tmp/sensordata/mem-used-percent.txt" 12,222 05289B 16A085 100}
10${goto 36}${freq 11} MHz${goto 104}${cpugraph cpu11 12,94 4E00C5 1300D9}${goto 200}${cpu cpu11}${goto 222}%${goto 233}|${goto 240}${top_mem name 1}${alignr}${top_mem mem_res 1}
11${goto 36}${freq 12} MHz${goto 104}${cpugraph cpu12 12,94 4E00C5 1300D9}${goto 200}${cpu cpu12}${goto 222}%${goto 233}|${goto 240}${top_mem name 2}${alignr}${top_mem mem_res 2}
12${goto 36}${freq 13} MHz${goto 104}${cpugraph cpu13 12,94 4E00C5 1300D9}${goto 200}${cpu cpu13}${goto 222}%${goto 233}|${goto 240}${top_mem name 3}${alignr}${top_mem mem_res 3}
13${goto 36}${freq 14} MHz${goto 104}${cpugraph cpu14 12,94 4E00C5 1300D9}${goto 200}${cpu cpu14}${goto 222}%${goto 233}|${goto 240}${top_mem name 4}${alignr}${top_mem mem_res 4}
14${goto 36}${freq 15} MHz${goto 104}${cpugraph cpu15 12,94 4E00C5 1300D9}${goto 200}${cpu cpu15}${goto 222}%${goto 233}|${goto 240}${top_mem name 5}${alignr}${top_mem mem_res 5}
15${goto 36}${freq 16} MHz${goto 104}${cpugraph cpu16 12,94 4E00C5 1300D9}${goto 200}${cpu cpu16}${goto 222}%${goto 233}|${goto 240}${top_mem name 6}${alignr}${top_mem mem_res 6}

Overall CPU Usage${goto 200}${cpu}${goto 222}%${goto 240}GPU Core Usage${alignr}${exec cat /tmp/sensordata/gpu-core-usage.txt}%
${cpugraph cpu0 30,226 8F00AF 0000DF}${alignr}${execgraph "cat /tmp/sensordata/gpu-core-usage.txt" 30,222 05289B 16A085 100}
CPU Temperature${goto 194}${exec cat /tmp/sensordata/cpu-core-temp.txt}°C${goto 240}GPU Temperature${alignr}${exec cat /tmp/sensordata/gpu-core-temp.txt}°C
${execgraph "cat /tmp/sensordata/cpu-core-temp.txt" 30,226 8F00AF 0000DF 100}${alignr}${execgraph "cat /tmp/sensordata/gpu-core-temp.txt" 30,222 05289B 16A085 100}
CPU Voltage${goto 190}${exec cat /tmp/sensordata/cpu-volts.txt}V${goto 240}GPU Voltage${alignr}placeholder V
${execgraph "cat /tmp/sensordata/cpu-volts.txt" 30,226 8F00AF 0000DF 1.60}${alignr}${execgraph "cat /tmp/sensordata/gpu-core-volts.txt" 30,222 05289B 16A085 100}
CPU Voltage (it8665)${goto 190}${exec cat /tmp/sensordata/cpu-volts-it8665.txt}V
${execgraph "cat /tmp/sensordata/cpu-volts-it8665.txt" 30,226 8F00AF 0000DF 1.60}
CPU Fans${goto 176}${exec cat /tmp/sensordata/cpu-fans.txt}${goto 204}RPM${goto 240}GPU Fans${alignr}${exec cat /tmp/sensordata/gpu-fan-percent.txt}%
${execgraph "cat /tmp/sensordata/cpu-fans-percent.txt" 30,226 8F00AF 0000DF 100}${alignr}${execgraph "cat /tmp/sensordata/gpu-fan-percent.txt" 30,222 05289B 16A085 100}
Intake Fans${goto 176}${exec cat /tmp/sensordata/intake-fans.txt}${goto 204}RPM${goto 240}GPU Frequency${alignr}${exec cat /tmp/sensordata/gpu-core-frequency.txt}MHz
${execgraph "cat /tmp/sensordata/intake-fans-percent.txt" 30,226 8F00AF 0000DF 100}${alignr}${execgraph "cat /tmp/sensordata/gpu-core-frequency-percent.txt" 30,222 05289B 16A085 100}
Exhaust Fan${goto 176}${exec cat /tmp/sensordata/exhaust-fan.txt}${goto 204}RPM${goto 240}VRAM Frequency${alignr}${exec cat /tmp/sensordata/gpu-vram-frequency.txt}MHz
${execgraph "cat /tmp/sensordata/exhaust-fan-percent.txt" 30,226 8F00AF 0000DF 100}${alignr}${execgraph "cat /tmp/sensordata/gpu-vram-frequency-percent.txt" 30,222 05289B 16A085 100}
HDD Fans${goto 176}${exec cat /tmp/sensordata/hdd-fans.txt}${goto 204}RPM${goto 240}VRAM Usage${alignr}${exec cat /tmp/sensordata/gpu-vram-used.txt} / ${exec cat /tmp/sensordata/gpu-vram-total.txt}MiB (${exec cat /tmp/sensordata/gpu-vram-used-percent.txt}%)
${execgraph "cat /tmp/sensordata/hdd-fans-percent.txt" 30,226 8F00AF 0000DF 100}${alignr}${execgraph "cat /tmp/sensordata/gpu-vram-used-percent.txt" 30,222 05289B 16A085 100}

DISKS${hr 5}
${goto 233}|
/dev/sdd${goto 100}${fs_used /} / ${fs_size /} (${fs_used_perc /}%)${goto 233}|
${fs_bar /}${goto 233}|
${goto 233}|
NETWORK ${hr 5}

${alignc}Intel Corporation I211 Gigabit Network Connection (rev 03)

#Down${goto 186}${downspeed enp8s0}${goto 240}Up${alignr}${upspeed enp8s0}
#${downspeedgraph enp8s0 30,226 8F00AF 0000DF}${alignr}${upspeedgraph enp8s0 30,226 05289B 16A085}
#Total${goto 186}${totaldown enp38s0}${goto 240}Total${alignr}${totalup enp8s0}
]]

Services/timers:

Summary

store-sensordata.timer

[Unit]
Description=timer for refreshing stored sensor data

[Timer]
AccuracySec=1s
OnBootSec=20s

[Install]
WantedBy=timers.target

store-sensordata.service

[Unit]
Description=get and store sensor data

[Service]
User=user1
Type=exec
ExecStart=/bin/bash /home/user1/.sensordata.sh
RemainAfterExit=false

[Install]
WantedBy=multi-user.target
WantedBy=conky.service

conky.timer

[Unit]
Description=conky auto-start timer

[Timer]
AccuracySec=1sec
OnBootSec=24sec

[Install]
WantedBy=timers.target

conky.service

[Unit]
Description=Conky
Wants=store-sensordata.timer

[Service]
User=user1
Type=simple
ExecStart=/usr/bin/conky --display=:0
RemainAfterExit=false

[Install]
WantedBy=multi-user.target
1 Like