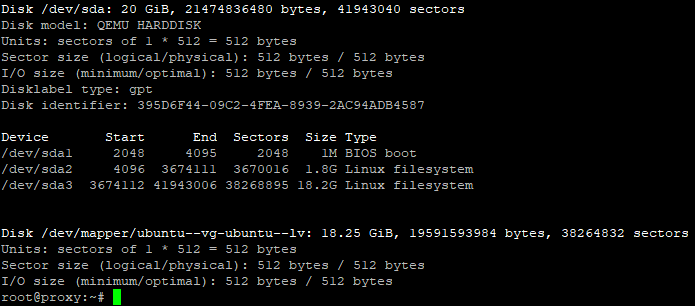
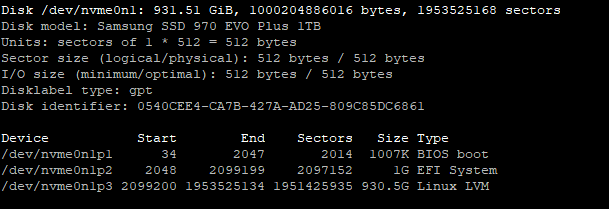
Hi all. I have a home server that had ESXi for 4 years with a 250GB NVMe SSD. I moved on to Proxmox last month and now I can monitor the hypervisor. In the last month, almost 20TB were written. I was alarmed. It is a simple setup with 4 VMs. A PBS, one VM with Nginx, a Plex one and a monitoring one. Now it is a single disk 970 Evo Plus 1TB with LVM and EXT4.
I think is the VMs, if I stop them, the writes are in the MB/hour range. I though it was the monitor application (CheckMK), but moving on this VM to a HDD didn’t solve the issue, only reduce it.
I checked the servers at work, I have a mirrored ZFS pool with 2TB 870 Evos and in 11 months in the worst hypervisor (6% wear, running also CheckMK with much more load) wrote about 63TB, which is much more acceptable, like half the writes, accounting that ZFS is also known for write amplification.
The data from the Plex server is written to a 2x8TB mirrored ZFS pool, so that is not the issue. I tried to disable the swap, enabled TRIM at VM level… I don’t know what more to do. Any thoughs?
Proxmox has built-in disk IO graphs. CheckMK has per VM disk usage. They seem to be the same. Around ~3.5MB/s between all VMs in the last 24h. That’s less than 300GB/day. I am seeing more than double.
20,000,000 MB / 30 / 24 = 27,777 MB … so 27GB/hour on average, or about 7MB/s on average.
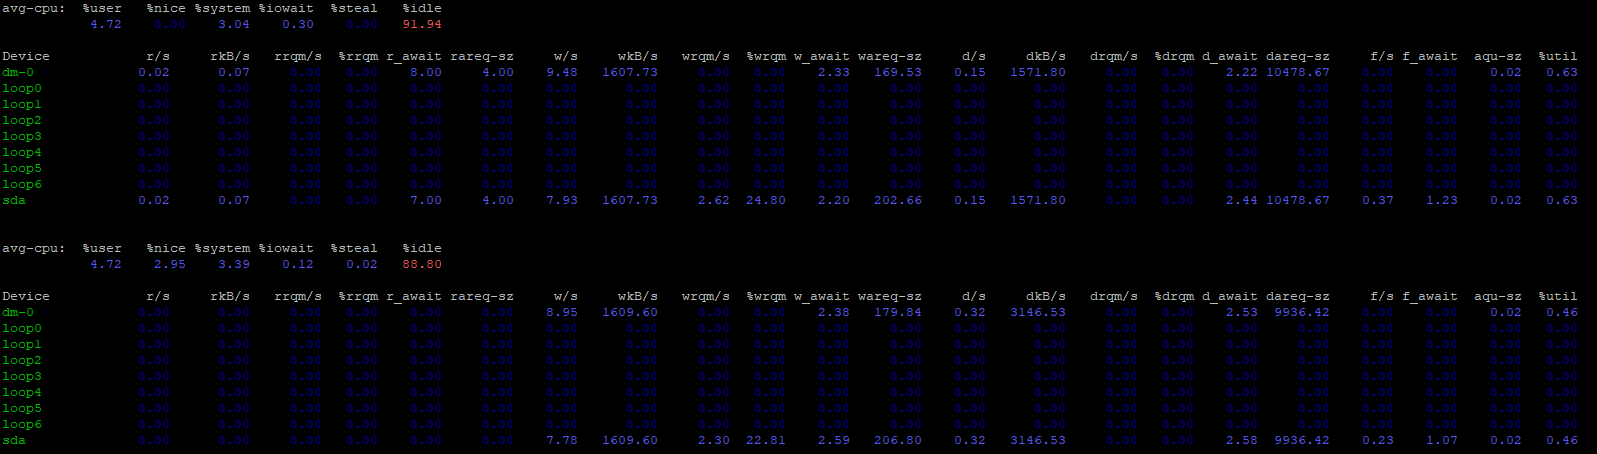
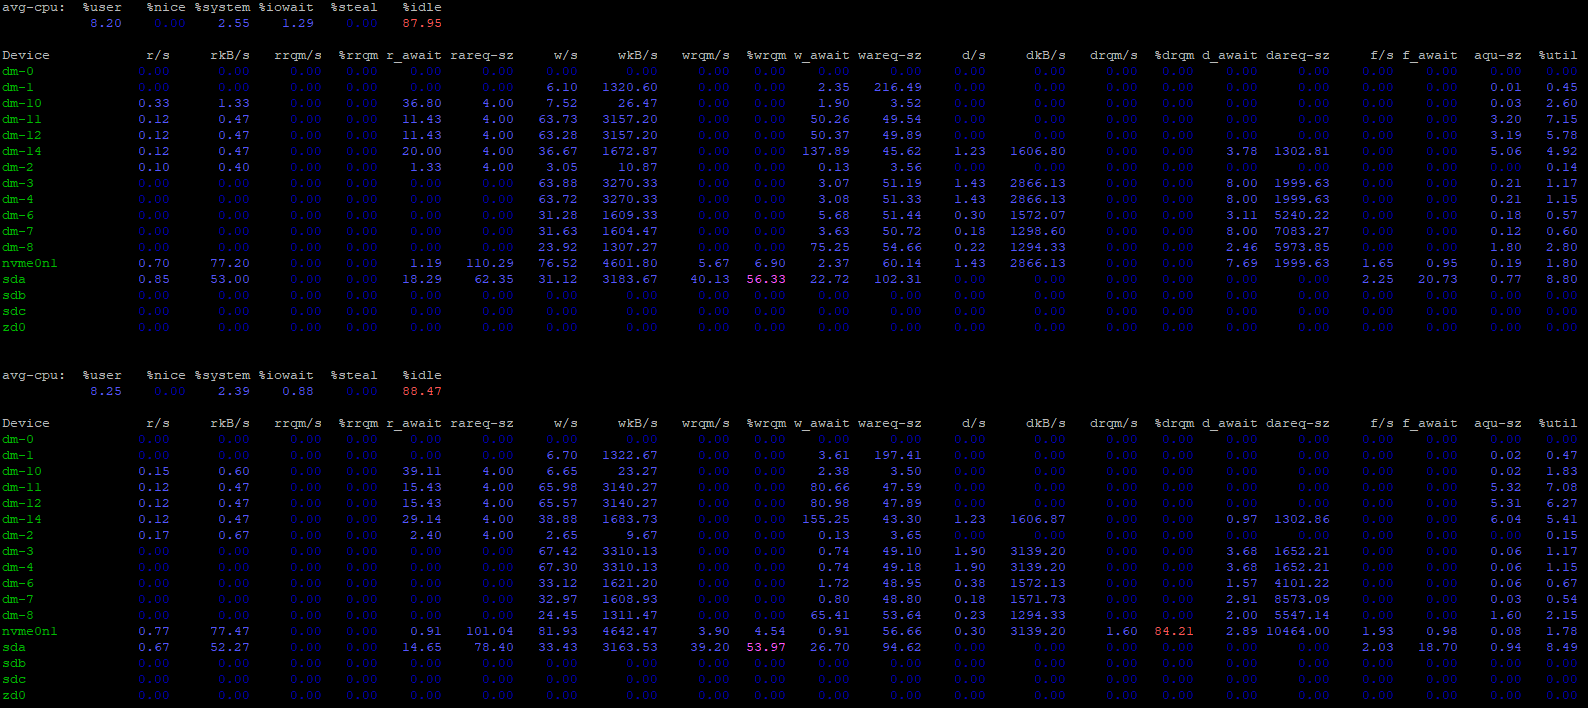
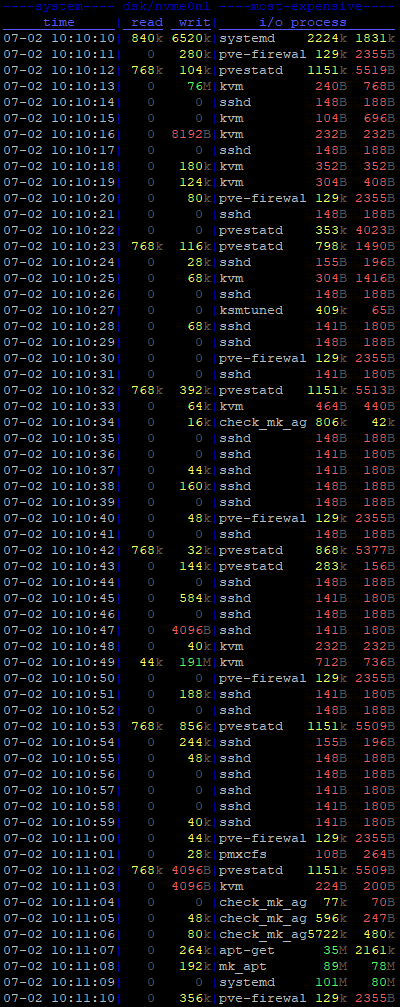
can you try iostat -x 1 and see what you get over the course of a second or iostat -x 60 and see what you get over the course of a minute.
I’m guessing probably something is rewriting entire blocks when not needed, and you should be able to see write sizes and write queue sizes on your block devices.
I’m also guessing something is syncing writes when not needed.
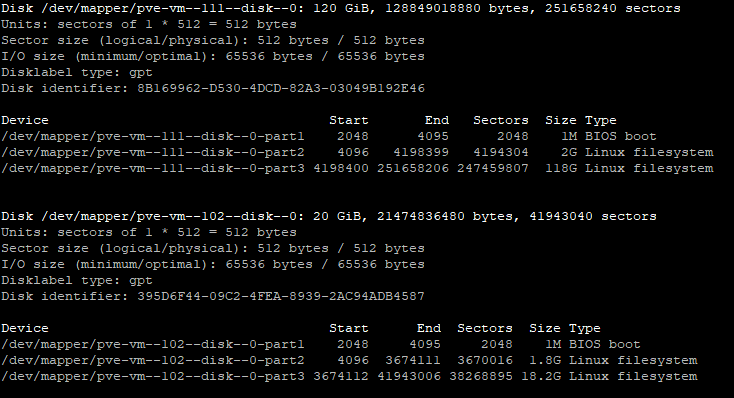
They are .raw disk images in an EXT4 filesystem on top of LVM. They are writing more than my VMs at work, which are on top of ZFS and should be worse (but it isn’t).
I am seeing 400GB written in the las 25hours, 2VMs writing at 3.5MB/s between the two (so over 300GB in 25h?). I have to account the Proxmox itself.
Is it normal to have a 64KB I/O size? Does that mean that when I try to write a block, 64KB are written as minimum? If I count the number of lines and count that as a write, counting each of that writes as 64KB, the number add up, but I don’t know if that makes sense.
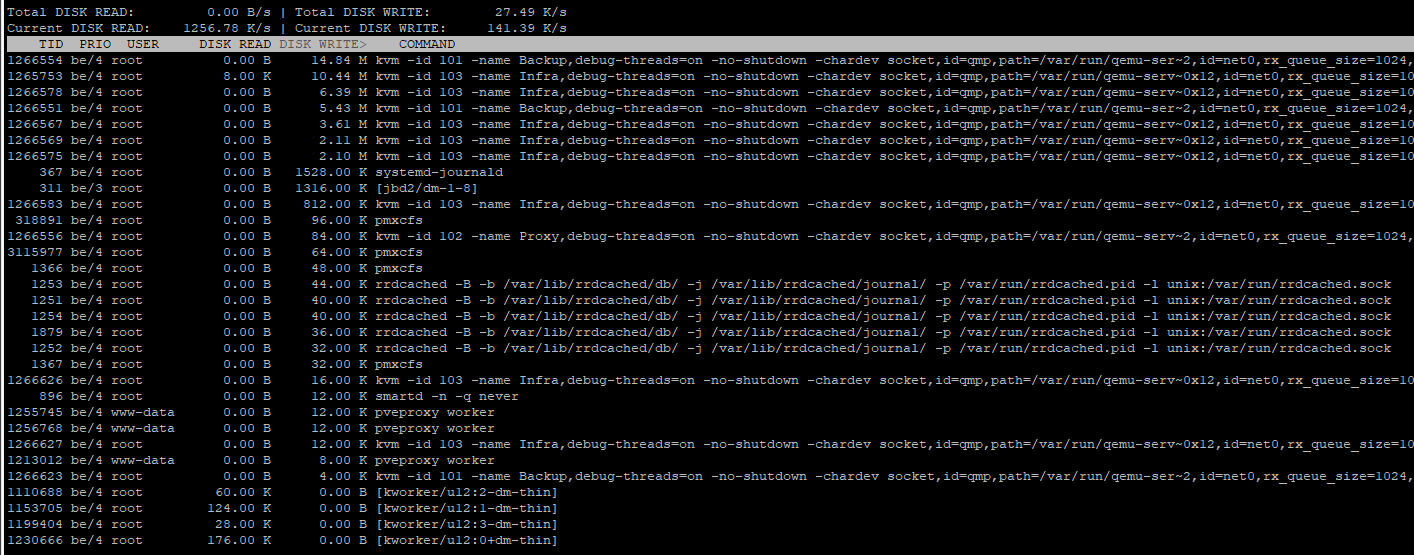
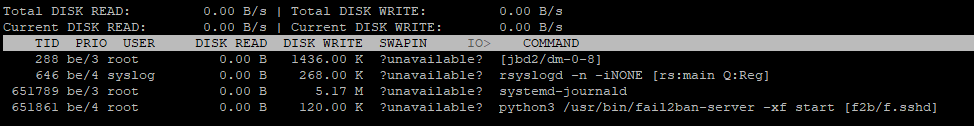
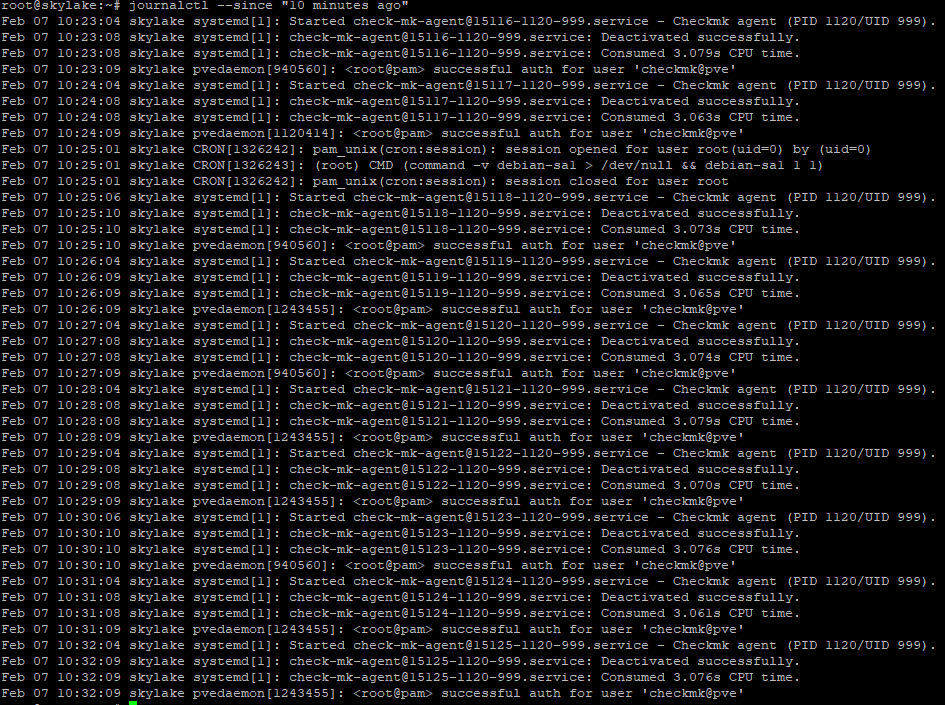
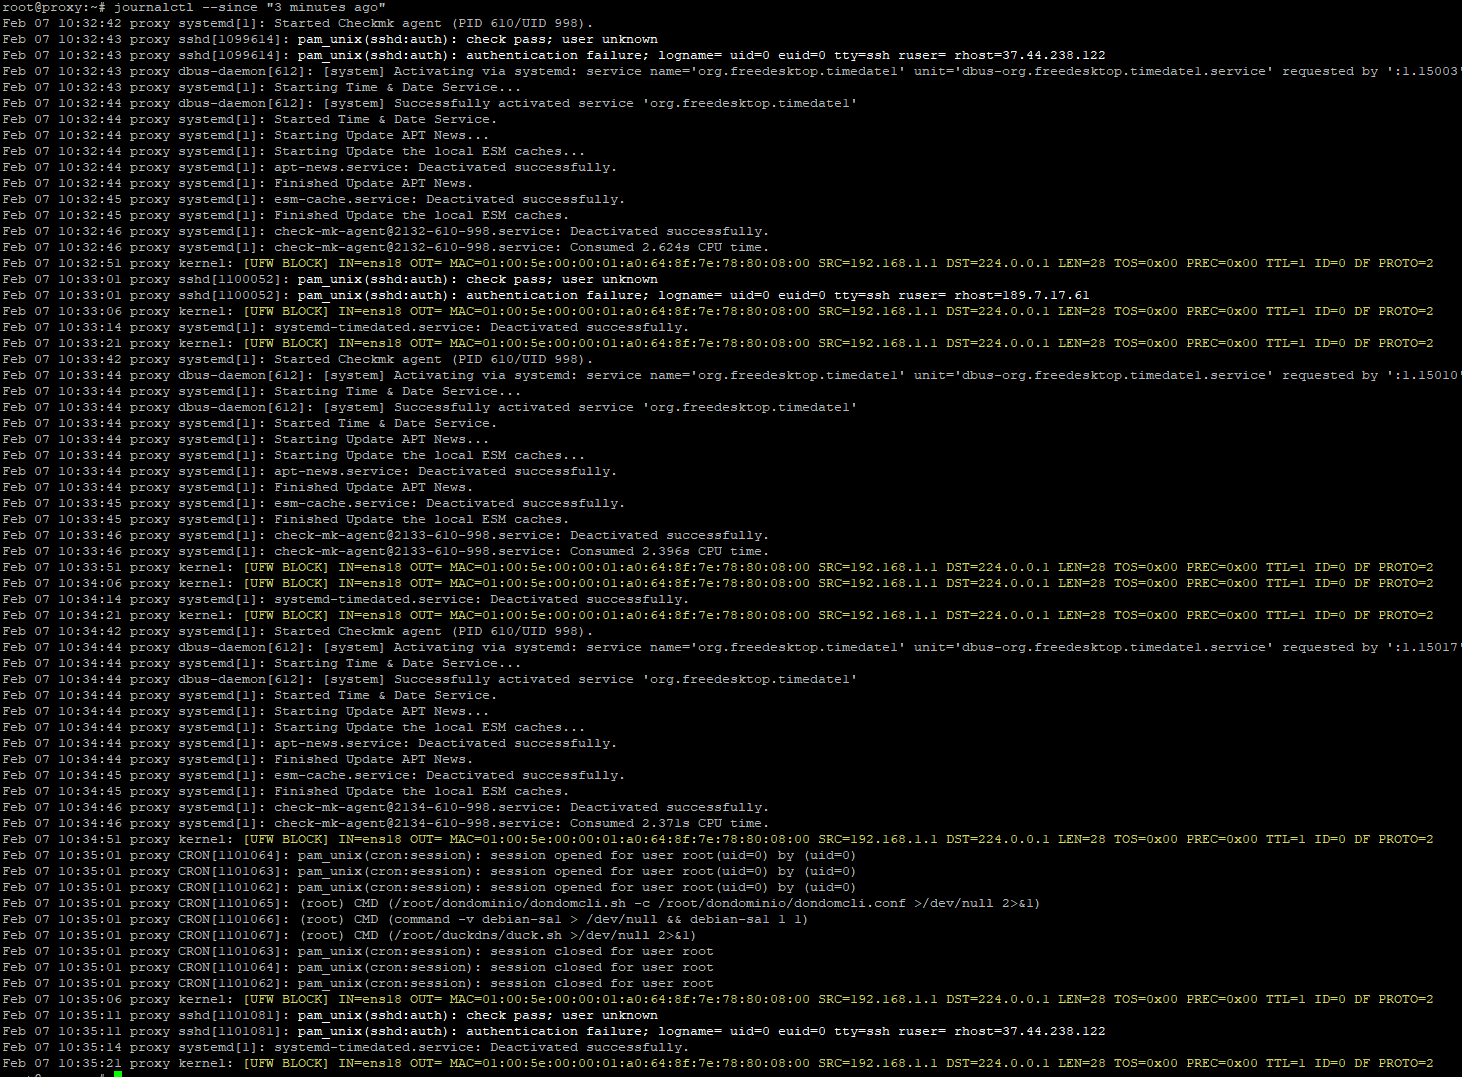
Ok, so I found the problem. It was a plugin in my monitoring client. Everything seems normal now. What I don’t understand is why iotop showed systemd-journald as the one doing the writes
Typically yes. Some flash is even worse at 128K / block.
Some flash / FTL controllers do magical things internally like “small write coalescing”.
for example:
if you want to write 4k at offset 1000, and 32k at 5000, 16k at offset 3000. Those 3 writes totaling 52k of data might get written into a single 64k block somewhere behind the scenes that’ll already be pre-prepared / pre-erased and ready to take on new data at relatively low latency. This data will eventually be rewritten again, in the background in order to be merged with nearby data on block boundaries.
So, assuming no new writes you get 4x 64k blocks = 256K of writes for the sake of 52k of data across 3 writes. (5x amplification)
But if you then follow with a 3 new 4k writes at offsets 1004,1008,1012, and 2 new 16k writes at offsets 3016/3032 … you’ll end up with 1 more immediate 64k write.
And then those two blocks of randomly written stuff will be merged with nearby previously written data across 3 places, so you’ll end up getting 5 block writes 320k instead of naive 8 (512k) for the sake of writing down 96k of data. (3x amplification).
You can imagine that if you’re able to leave more data to pile up in this buffer, you’ll have more opportunity to de-amplify writes. At the cost of having to keep track of where data is and some read amplification (having to merge data from this buffer with nearby underlying data when the OS asks for it
You’ll just have to monitor SMART data and plan to get a new drive at some point - there’s no point in trying to compute this from 1st principles and fundamentals, stuff like that coalescing above is secret sauce of drive vendors, and who knows what else they do.