GPU Passthrough Performance Numbers: Ryzen NPT Patch vs Buggy NPT vs Native Windows

Hi all!

I’m doing a benchmark suite right to get some “hard” numbers how a Windows VM with KVM performs in gaming. Wendel did live testing in a great live stream but for someone who is looking for written number I wanne share my findings in this thread.
I hope someone find it useful or entertaining :wink: Goal is it to share my performance numbers in “KVM virtulized Gaming”: AMD NPT Patch vs Buggy NPT vs Native Windows

To the methology:
Each number is an average of at least 3 benchmark runs to keep peaks or drops some kind in check. I test the following games or benchmarks because they are in my (Steam-) library :wink: :

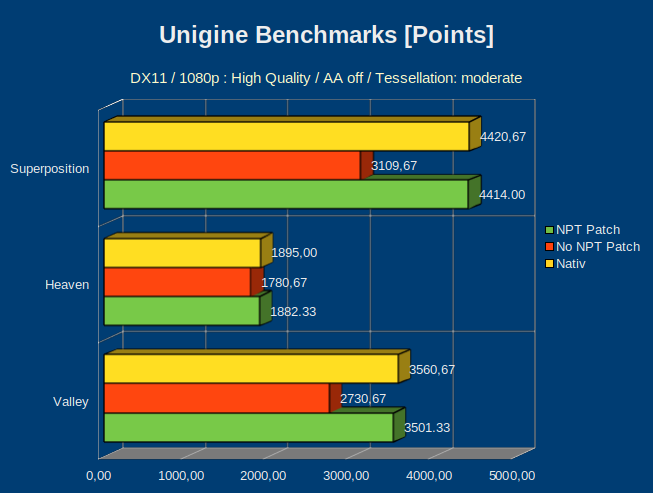
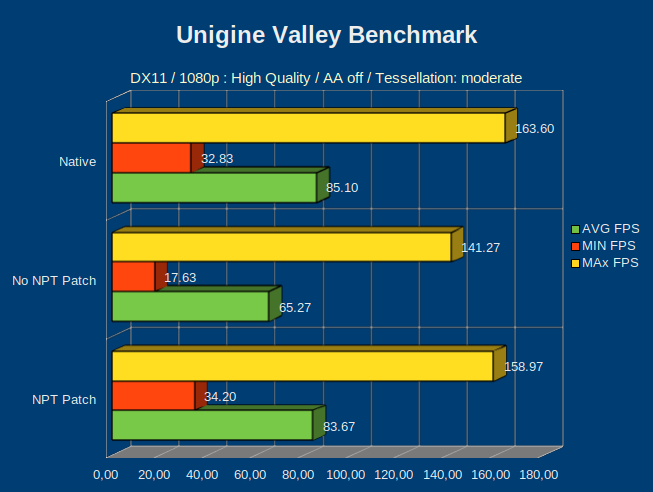
  • Unigine Vally (DX11)
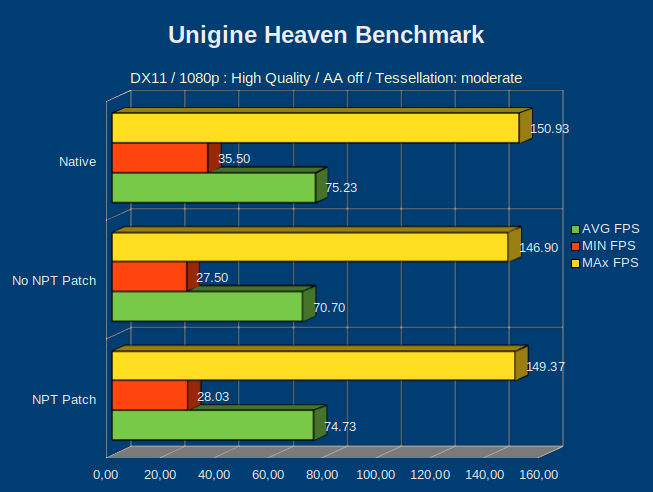
  • Unigine Heaven (DX11)
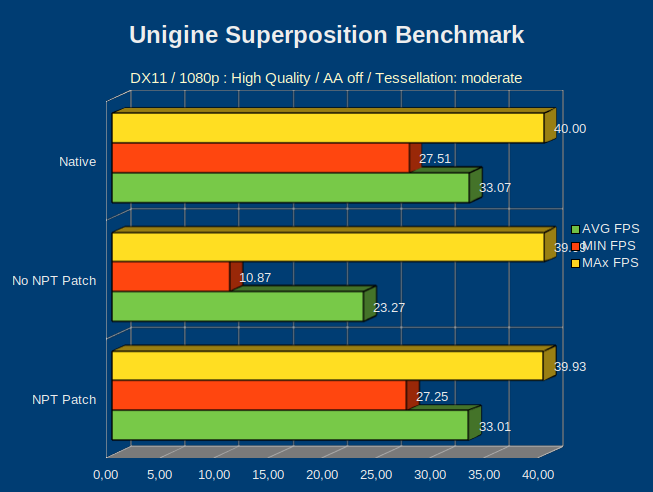
  • Unigine Superposition (DX11)
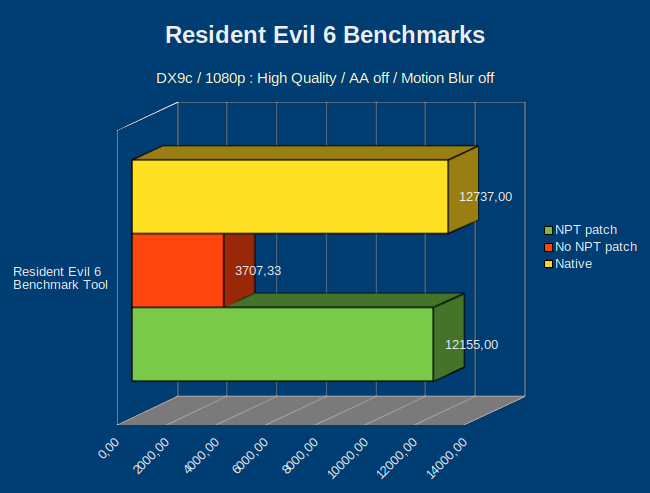
  • Resident Evil 6 Bechmark Tool (DX9c)
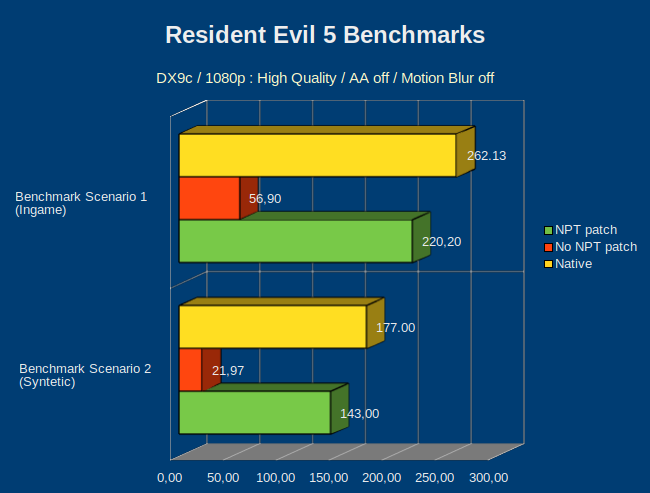
  • Resident Evil 5 Benchmark 1 (DX9c)
  • Resident Evil 5 Benchmark 2 (DX9c)
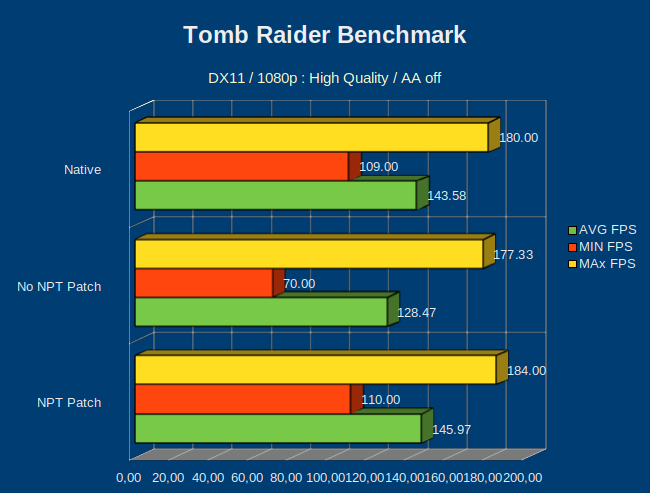
  • Tomb Raider (DX11)
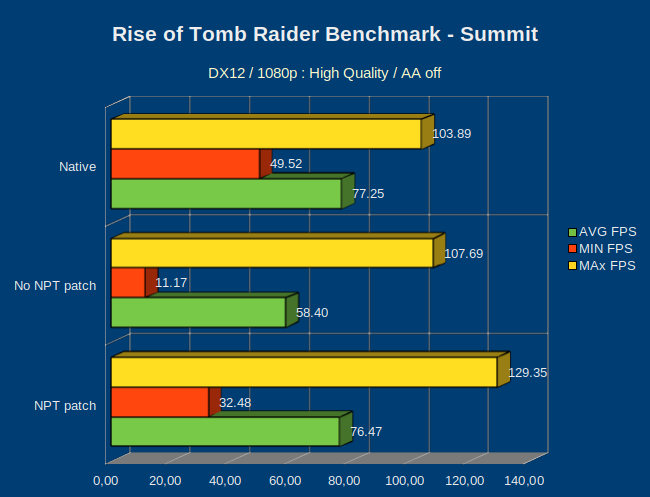
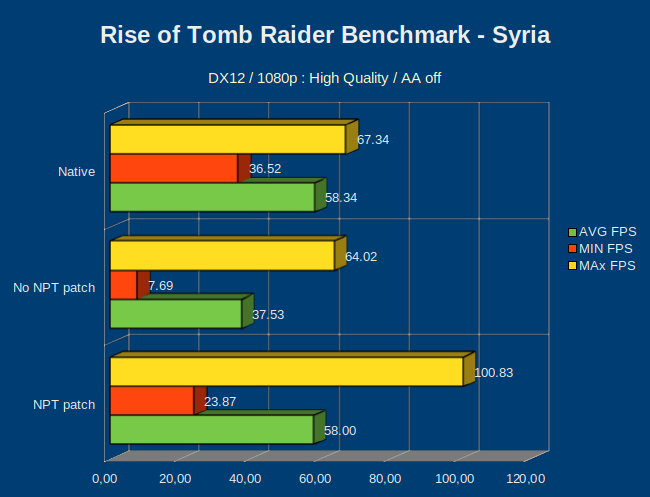
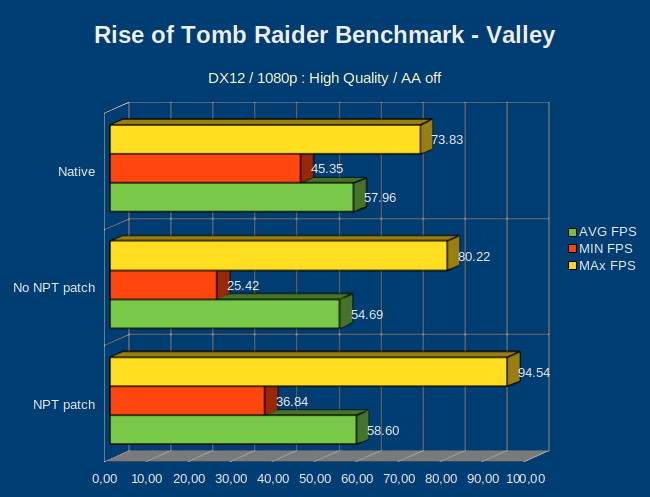
  • Rise of Tomb Raider (DX12)
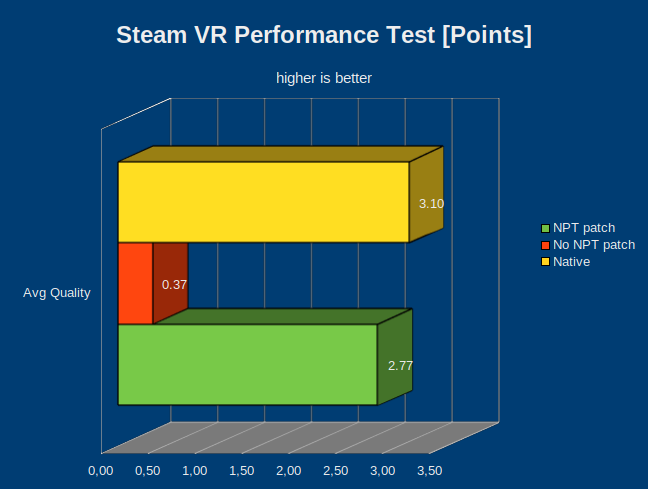
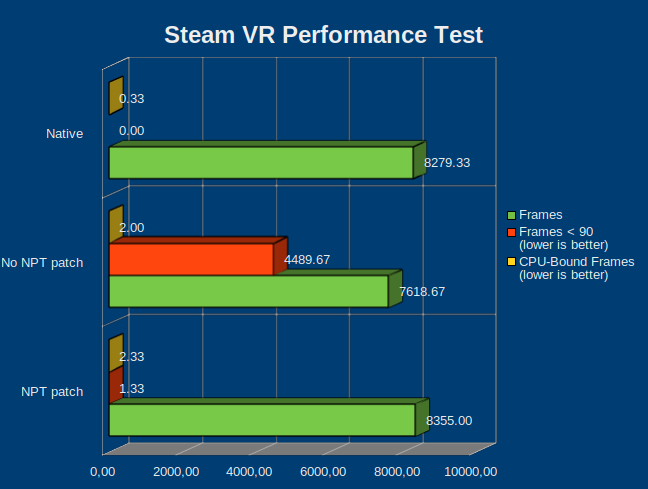
  • Steam VR Performance Test
  • Ashes of the Singularity: Escalation (DX12 and Vulkan)

The Host System is:
MoBo: ASUS ROG Crosshair IV Hero BIOS 17.01
CPU: AMD Ryzen 5 1600x pstate OC to 4.1 GHz
RAM: 16 GB Corsair Vengeance LPX 3200 @ 3200 MHz 16-17-17-17-36 CL’s
OS: Ubuntu 17.10 with NPT Patch Kernel “4.14rc7-custom1” / Kernel 4.14rc7 for none NPT numbers
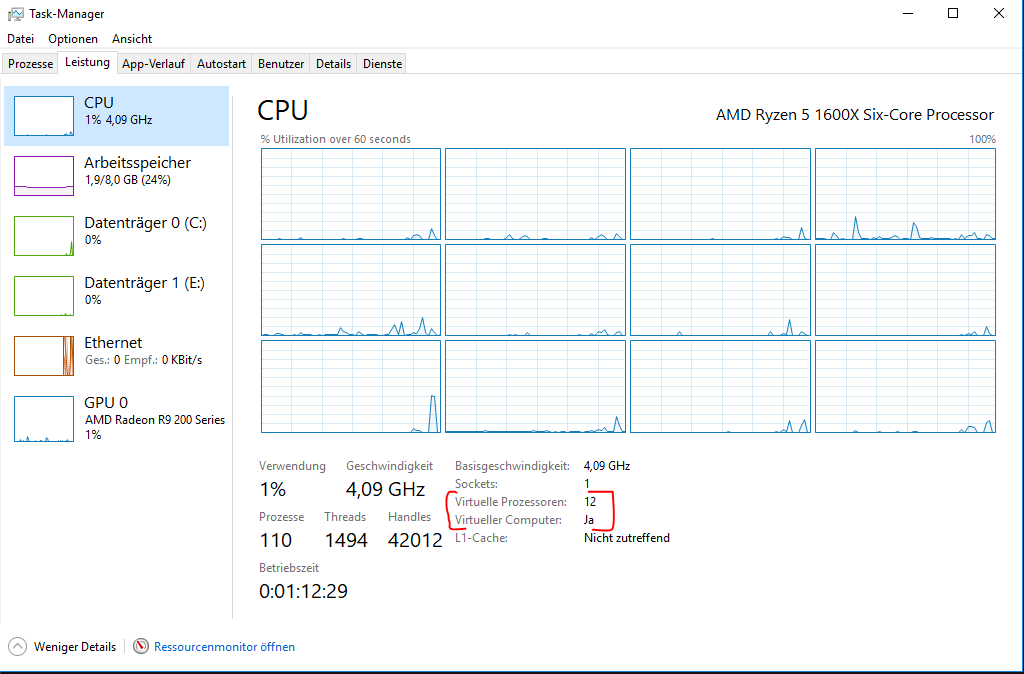
Guest System:
KVM based
VCPUs: 12
RAM: 8.1 GB
Passthru GPU: XFX Radeon R9 280x GPU-OC: 1100 MHz / VRAM-OC: 1600 MHz
OS: Windows 10 pro FCU
Radeon Software: Crimson Relive 17.9.3

Benchmark Results

image

image

image

image

image

image

image

image

image

image

image

image

image

image
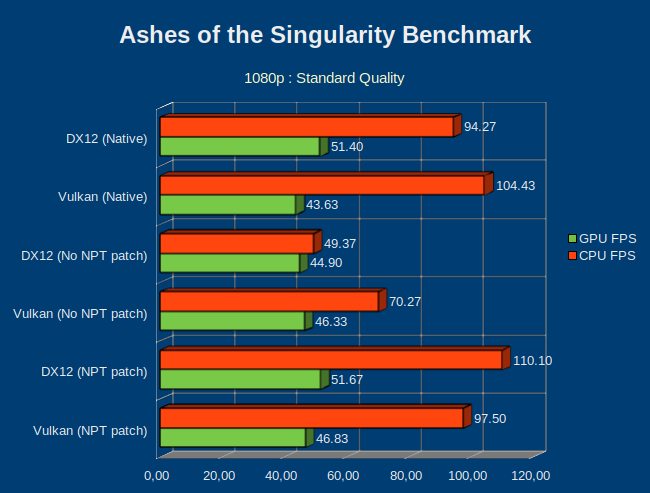
Remarks: Ashes behaves a little bit … strange… for some reason it refused to use the primary Graphics card in PCIe x16 Slot 2 (XFX R9 280X) instead it uses always the card in PCIe x16 Slot 1 (Sapphire RX 560). Additionally the the use of a second monitor let crash the game instant if the Vulkan API were activated. Resulting in ripp of the 1st display driver card an put the R9 card in the first PCIe16 Slot… Strange game!

Some final thougths…
DX9c games benefit maaaaassive from the NPT fix! In fact DX9c games were not really playable with the buggy NPT. It was very choppy and extreme load sensitive. With more objects to draw the performances dropped very fast. With the NPT patch you remove the FPS penalty of >60%. In “newer” DX9 games virtalized gaming is on par with native game play. In “older” DX9 Games like RE5 where the framerate is already near 200 FPS the virtulization penalty is good measuarble but far from noticable.

Games using DX11, DX12 and Vulkan got a little performance bump in MIN and MAX FPS but what is very improved is the smoothness of the games! With the NPT patch the VM gaming experiences is undistinguishable from playing on a native Windows.

Attachments:
As requested, the source libreOffice ODS file for the charts can be viewed here: https://drive.google.com/file/d/1BQ5BD14cX-9C0Ep37cbTfmkgfZNeOyoj/view?usp=sharing

13 Likes

<< reserved for even more future text? :wink: >>

1 Like

This is awesome.

Just for reference from July of last year:

He also has numbers, though not as detailed as yours. This is nice for seeing how it has progressed.

4 Likes

Thanks! I think so too. Are not so many informations out there about that topic

3 Likes

I’ve recently done a similar thing, though I didn’t test nearly as many games/benchmarks and failed to do much testing with the broken NPT enabled. For what it’s worth, here are mine. Let me know if it’d be worth my creating a separate thread for this? I’m new here. System specs are:

Fedora 26, 4.13.10 with NPT patch applied
Ryzen 7 1700 at 3.8Ghz
Gigabyte AX370 Gaming K5
Radeon R9 380 (host)
Strix GTX 1080 (mild OC) (passthrough)
16GB 3200Mhz Trident Z (the intel optimised sort) running at 2933Mhz

In the QEMU XML for the VM I gave 8 cores (cores 0 through 7 pinned). The setting used were very similar to those recommended by Wendell in his first Ryzen passthrough write-up.

3DMark Firestrike:
VM with patched NPT: 6510 Combined, 3986 CPU, 7329 graphics (47.8/42.0fps)
Baremetal: 7765 Combined, 8002 CPU, 7725 graphics (49.9/44.64fps)

Cinebench CPU:
VM with patched NPT: 819
Baremetal: 1663

Unigine Heaven (ultra):
VM with patched NPT: 2639, 104fps (min 9.0 max 205)
Baremetal: 2907, 115fps (min 22.5 max 250.4)

Unigine Superposition (ultra):
VM with patched NPT: 4115 (min 25.4fps, avg 30.78fps, max 35.8fps)
Baremetal: 4334 (min 26.8fps, avg 32.4fps, max 37.6fps)

Middle Earth: Shadow of War:
VM with patched NPT: 86fps (min 21, max 202)
Baremetal: 106 (max 152, min 40)

I’m feeling pretty damn happy with the performance since the patch, and I can’t see myself actually restarting and booting into windows in the future at all. I’m a happy camper :grin:

2 Likes

Hi Mrjakesk8,

thanks for your numbers! Your results here are fine and welcome! Can you please add the number of VCPUs you are used? Its may be helpful to evaluate some of the scores. Just update your post please :slight_smile:

thanks a lot! :slight_smile:

And jaah! I’m too! I don’t think I will start a native Windows any longer! I’m very impressed how smooth and performant the VM with the games run! :smiley: And… somehow it feels Windows 10 behaves much more robust inside a VM then native O_o?

3 Likes

I know what you mean actually. Though benchmark numbers are slightly lower, the “feel” of navigating around the desktop and so on seems to be more consistently smooth in the VM now. I’m loving it.

I’ll add the VCPU config now

3 Likes

I think I’m done! :smiley: So many funny charts smile

First off, thank you and kudos to the work you’ve done.

Speaking of charts… I don’t often see much about data on performance like how you’ve done here. This is fairly new for me. Is there by a gracious chance you’d have warm AMD love inside and share with us a google spreadsheet with all the data so I can a) see it all, and b) look at how the graphs end up as they are.

I’m interested in knowing more about the different methods many hardware/software testers use to gain metrics, and the way in witch they gain insights. This would add even more value (probably for me only, lol) to an already valuable post).

Cheers for everything.

1 Like

Hi Njin,

I will post my source Calc/ODS spreadsheet tomorrow on my Google Drive. But if you expect some kind of dark arcane black voodoo magic… you will maybe disappointed… my spreadsheet is just a half german half englich CSV, used to store the results of each benchmark run and a pivot table to aggregating the individual results to a streamlined average without peaks or drops to finally build the charts.

The used sample size of 3 runs per benchmark is the bare minimum you can choose. Because it is the smalles amount of empiric data to show a “trend”. But I think thats decent enough because I just wanne show a trend.

Instead of framerates I would have preferred to show frameTIMES. But badly tools like Riva Statisics Server to capture such data did not run in the VM. I think Riva was confused with the virtual chipset and so on.
The frametime had the advantage to show drastically better performance drops, (micro) stutter or inconsistent/fickle image rendering.
In other words frametime histograms can show way better smoothness, framerate is more a total raw graphics power metric.
Especially with the NPT bug in DX11 games with frametime histograms you would very quick see how choppy the gameplay was and how huge the improvement the NPT fix is!

But after all… the framerate mostly I presented here shows the great improvement we got in virtulized AMD environments anyways.

If you want to learn more about benchmarking? Then I would suggest you to look on Youtube the Gamers Nexus and Tech Deals Channels. Both explain very good how they measure thinks and for what reason. I watch them very often too.

Until tomorrow njin! Have a nice day! :slight_smile:

2 Likes

Have you tried using ocat?

1 Like

Good morning filthyscym,

no I have not. But I will try it out this evening!
Thanks alot for the tipp! :slight_smile:

Good luck in your testing! :smiley:

1 Like

Odd that a few games run better in a VM with the NPT patch than on bare metal.

Only slightly and usually a Max fps spike. But still pretty cool.

Thanks for the information.

1 Like

Yeah… I thought the same… I retested Ashes of the Singularty with Vulkan API right now. The results now are much closer but for GPU framerate in a VM has still minimal advantage. Again, 3 runs in VM and 3 runs on native Windows, then calculating the average:

Ashes - Vulkan API - Bare Metal:
GPU framerate: 43.267 FPS
CPU framerate: 106.267 FPS

Ashes - Vulkan API - NPT patched KVM VM:
GPU framerate: 43.667 FPS
CPU framerate: 97.367 FPS

There are some possibilities:

  1. Maybe the sample size of now 6 runs is much to low…
  2. Windows on bare matel do some thing more what it does not in virtulized enviromnents ( Windows: ah… I’m in a VM, some expert uses me! Better I turn off the whole noob automation crap!)
  3. The emulated SATA controller from QEMU is better then the hardware controller in my Crosshair 6 Hero or some hidden cache is play…

O_o? Questions over questions :wink:

1 Like

I doubt this one. I have no experience, but when set up with full pass through is windows even aware it is running in a VM? I know nVidia cards can detect it but does other stuff really care?

1 Like

Jup - Windows is aware of it:
image
Its of course german :wink: but the Task Manager says:
Virtual Processors: 12
Virtual Computer: Yes

Its possible to hint this via some more lines in the QEMU/ libvirt VM definition xml file. But I would only configure it if I had to use a nVidia card. With my AMD card I don’t need such special things. I’m very happy with the performance now :slight_smile:

2 Likes

Okay cool, thanks for that, the more you know.

Did you test with npt=0 or npt=1, and if so which is faster? Also can you paste your .xml file on pastebin or somewhere where I can see how you configured your cpu? Thank you for posting the benchmarks.

1 Like

Hi Hondaman,

sorry for the late repsonse… I had a very busy week.

No I did not tested explicitly NPT= off. But there are a rare bug in the KVM_amd module. Once in 20 or 25 boots of my host machine, the NPT cames for some reason not really on.
In that rare cases, the performance in Unigine Valley for example will drop from avg. 83 FPS to ~30 FPS and below!
I reboot my host and the problem is gone. These numbers match to that what bseto posted here: Patch NPT on Ryzen for Better Performance | Level One Techs
Now the SVM/NPT-Fix is here, I really see no reason to test NPT off. I think nobody should do this.

To my libvirt VM definition file. I did nothing special. My CPU config looks like the following:

<vcpu placement='static'>12</vcpu>
...
<cpu mode='host-passthrough' check='none'>
 <topology sockets='1' cores='6' threads='2'/>
</cpu>

I tested Wendels tipps to core pin the VCPU and declare IOThreads and pin them to. On my ASUS board and my Ryzen 5 1600X it makes things worse! Even if I reduce the VCore count a littlebit I notice a light performance degreasement inside my Windows 10 VM. There are a lot Postes on the VFIO_PCI blog for Intel tweaks… but overall… it makes it complicated and I notices no improvement. For my systems the simple default of libvirt and QEMU are just fine. I only changed the cpu-mode as Wendel suggested from “host-model” to “host-passthrough”. I think that makes the most difference in the VM.

Viele Grüße
Marf :slight_smile:

1 Like