I just went through a long bout of hardware testing, as we’ve been seeing some pretty bad performance issues in Proxmox recently. At this point we’re pretty certain the VirtIO drivers have just gone downhill. Initially I can tell you I’m getting vastly better performance in Windows Svr 2016 using 0.1.065 drivers for Win8, which you can’t even download anymore, but I don’t recommend doing this with anything in production, as I just had Proxmox shit the bed during a Crystal Disk Mark test. First time this has happened on this machine and I don’t think it’s a coincidence.
Anywho, I thought people might like to see a comparison of a 4 disk RAIDZ2 vs a 4 disk Pool of Mirrors, HGST vs WD Blacks. Mind you, these tests aren’t comprehensive. I should have gathered an average over so many executions of the tests, but what I ended up doing was setting up the zpool, running the tests from top to bottom, then bottom to top. As long as the results didn’t vary wildly on the return trip, I’d move on. If they did vary wildly, then I got an average.
In order to get these numbers I needed to gimp my Proxmox box down to 4GB of memory, set the ARC max to 500MB (yeah, 500 megabytes), and do one pass through of the test before I started recording numbers. This helped assure that my results were not muddied by cache. And here’s the command used to do the testing.
fio --name=random-writers --ioengine=sync --iodepth=4 --rw=randwrite --bs=4k --direct=0 --size=256m --numjobs=16
Also, you’ll note that there’s a section for zvol 8k that isn’t filled in. Every time I’ve run this command against a zvol, it’s basically been testing the speed of the system memory. I get ~7GB/s every time, and the test completes instantly.
So the test runs 4GB worth of 4K random writes against the disks. If you’re not familiar, this is the absolute hardest operation for spinning disks to complete. Well, one 4K block isn’t hard. But when it’s followed up by another random 4K block, and another, and another, until you get all 4GB, yeah it’s pretty hard.
The iodepth is kept low so that the disks do not get a chance to test their native command queuing code. This. Test. Is. Brutal. But if you want to know exactly what your disks are capable of, this is one way to find out.
8K vs 128K. I should mention here that I’m using ZFS for these tests, because that’s what we use for our virtual hosts. ZFS’s default block size is 128K, and it has been suggested elsewhere that 128K does not work well with virtual machine disk formats like qcow2. I thought that this was because most operating systems use 4K block sizes for their file systems by default. So I created datasets, one with 8k and one with 128k.
Comp vs No-comp. Compression. Personally I don’t need to be sold on this. I’ve done a lot of work with databases, and several years ago it came to light that we (as an industry) had been thinking about compression in completely the wrong manner. We had always thought about compression from a standpoint where CPU cycles were scarce, we never re-examined compression on modern CPUs until relatively recently (I think I was coming around to this way of thinking back in 2013, and I’m pretty sure I was late to the party).
If you spend a little extra time compressing the data, then when you go to ask for the data again, you end up getting the data right next to it as well, which you probably also need. This works out exceptionally well for databases, and I feel it should work roughly as well for virtual machine disk files.
And finally, all drives are fresh from the blister pack. Both HGST and WD Blacks are 2TB 7200 RPM drives. I’m going to run these tests again against some 15k RPM drives I have laying around. Honestly, this test is where the rotational speed of the drive matters. By forcing the disks to not take advantage of native command queuing, when they complete one write operation, they often have to wait for the platter to come full circle before they hit the point where the next write operation will be written. Latency affects speed.
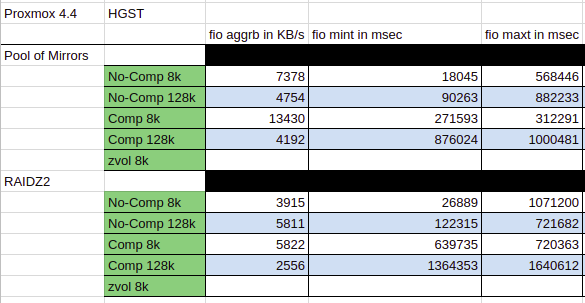
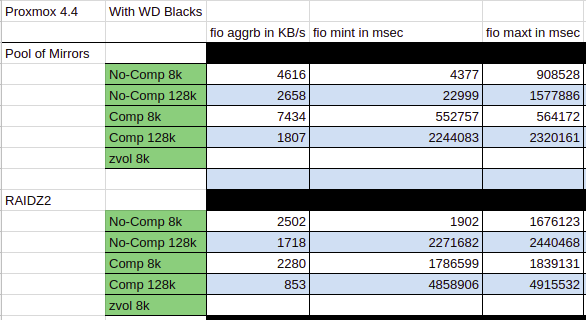
And quite surprisingly the WD Blacks lost pretty handily to the HGST disks. I’m still very surprised by the HGST Comp 8k, but I ran that test a few times and got roughly the same result.
And now after all of that, I don’t really know what to say. Thoughts and opinions?