Event Horizon: Is This Even Needed?

The history:

Event Horizon - A Windows Monitoring Software

Let’s get into windows event forwarding and auto-analysis! Featured on the 9/18 linux weekly. A think I’m tinkering with.

Recently We’ve begun creating a software we call “Event Horizon.” It’s a tool that collects and simplifies the mass amount of error and issue reporting present in a Windows PC. The main objective is to make it so that even those without a background in computers can understand and solve technical problems in their PC with the help of AI.

The general process involves connecting a PC to the database, having that PC send error reports via things like Sysmon and powershell logging, and then asking a local LLM to consolidate that data into simplified and easily understandable findings

A Tour of Event Horizon

What follows is screenshots of our very early adaptation of the idea. The final product would likely see many revisions beyond this initial mockup, but overall this design provides a good idea of our vision.

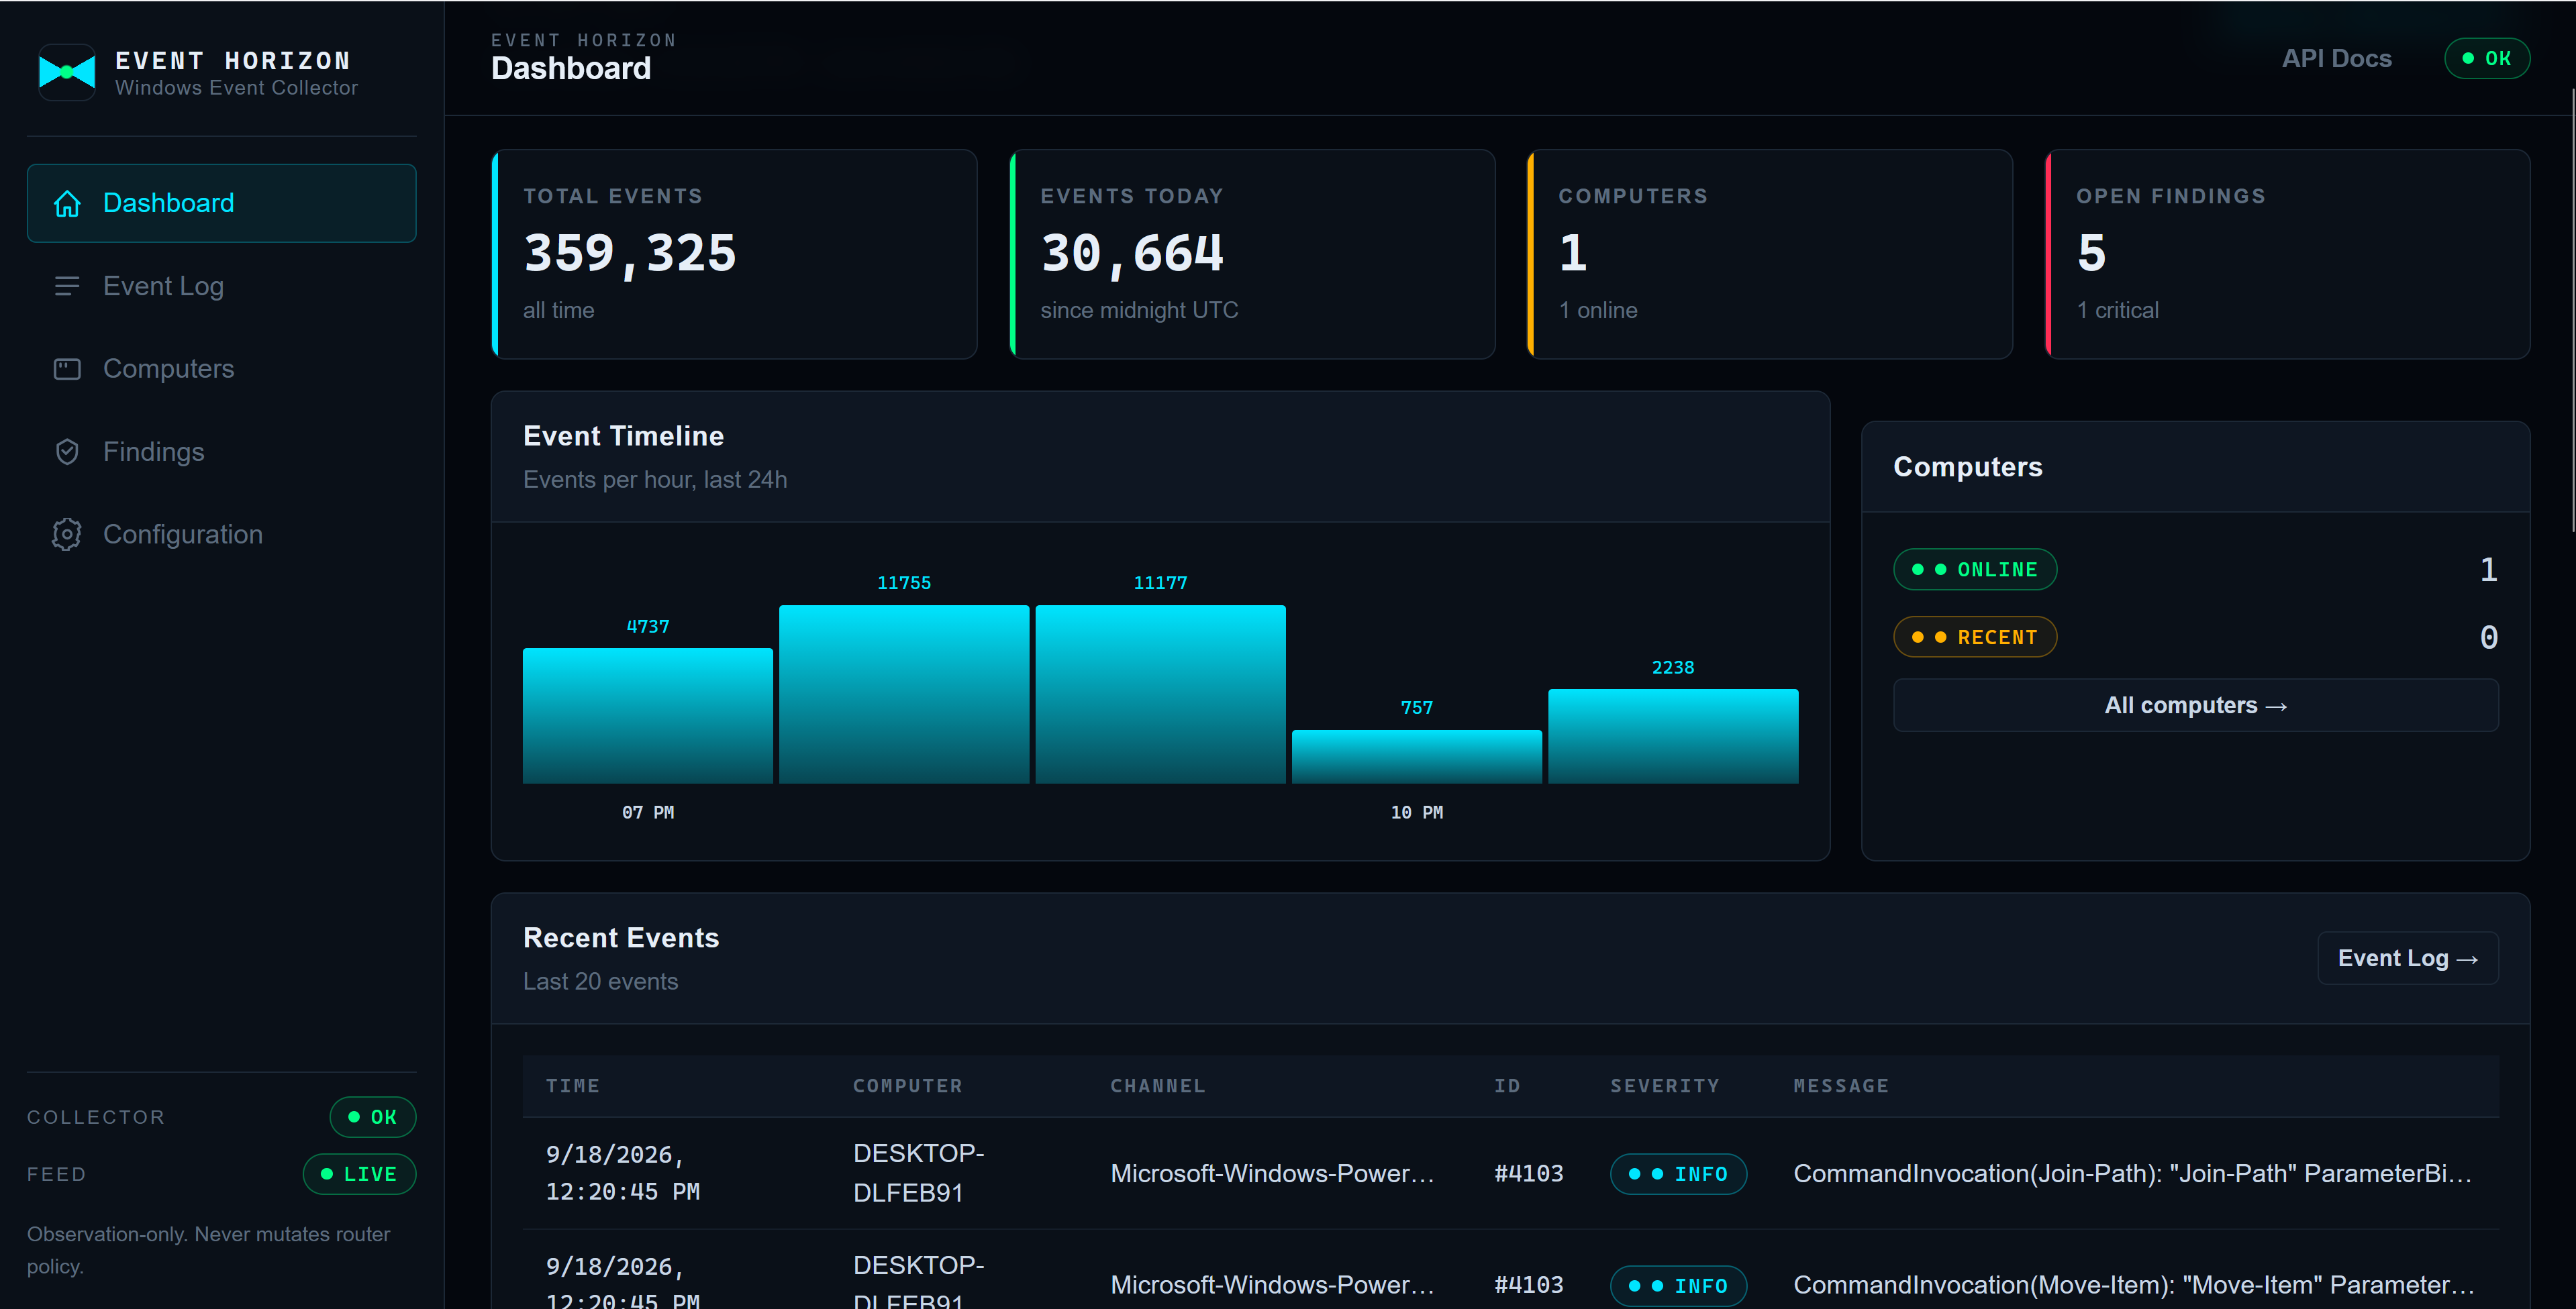
The Main Dashboard

Here you can see the main dashboard, it consolidates all the info of the PCs in the database. It provides statistics, graphs, and tables that summarize the data received that day.
The Event Log

Going down the menu we get to the event log, this is a dumping ground for all the data that the database is receiving. This can allow you to look at specific isolated notifications rather than the generalized findings that the AI provides.
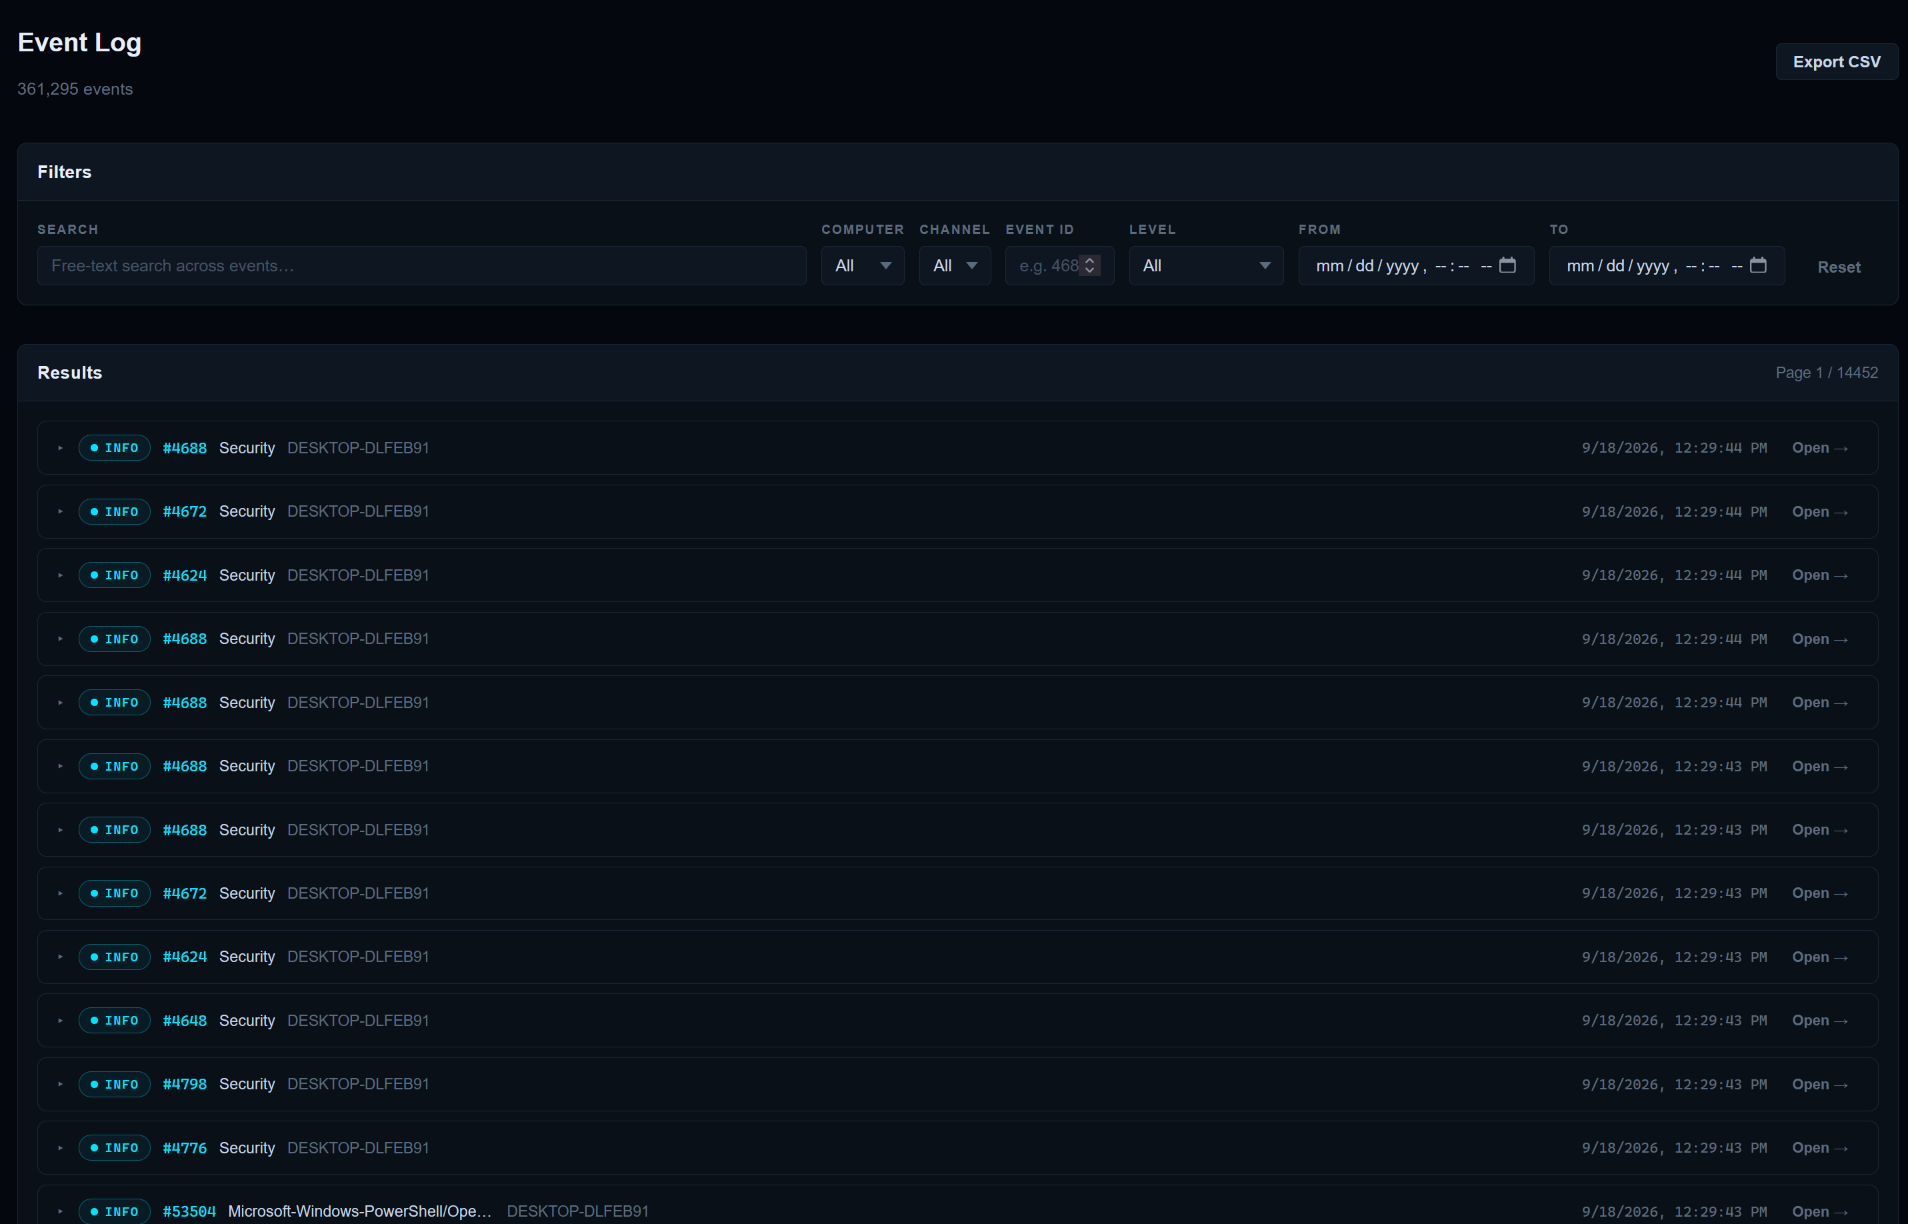
We intend to make use of many search filter options in order to narrow down the wide stream of data as much as possible.

Computers

A rather self-explanatory page, simply lists all the computers and devices you have connected to Event Horizon.
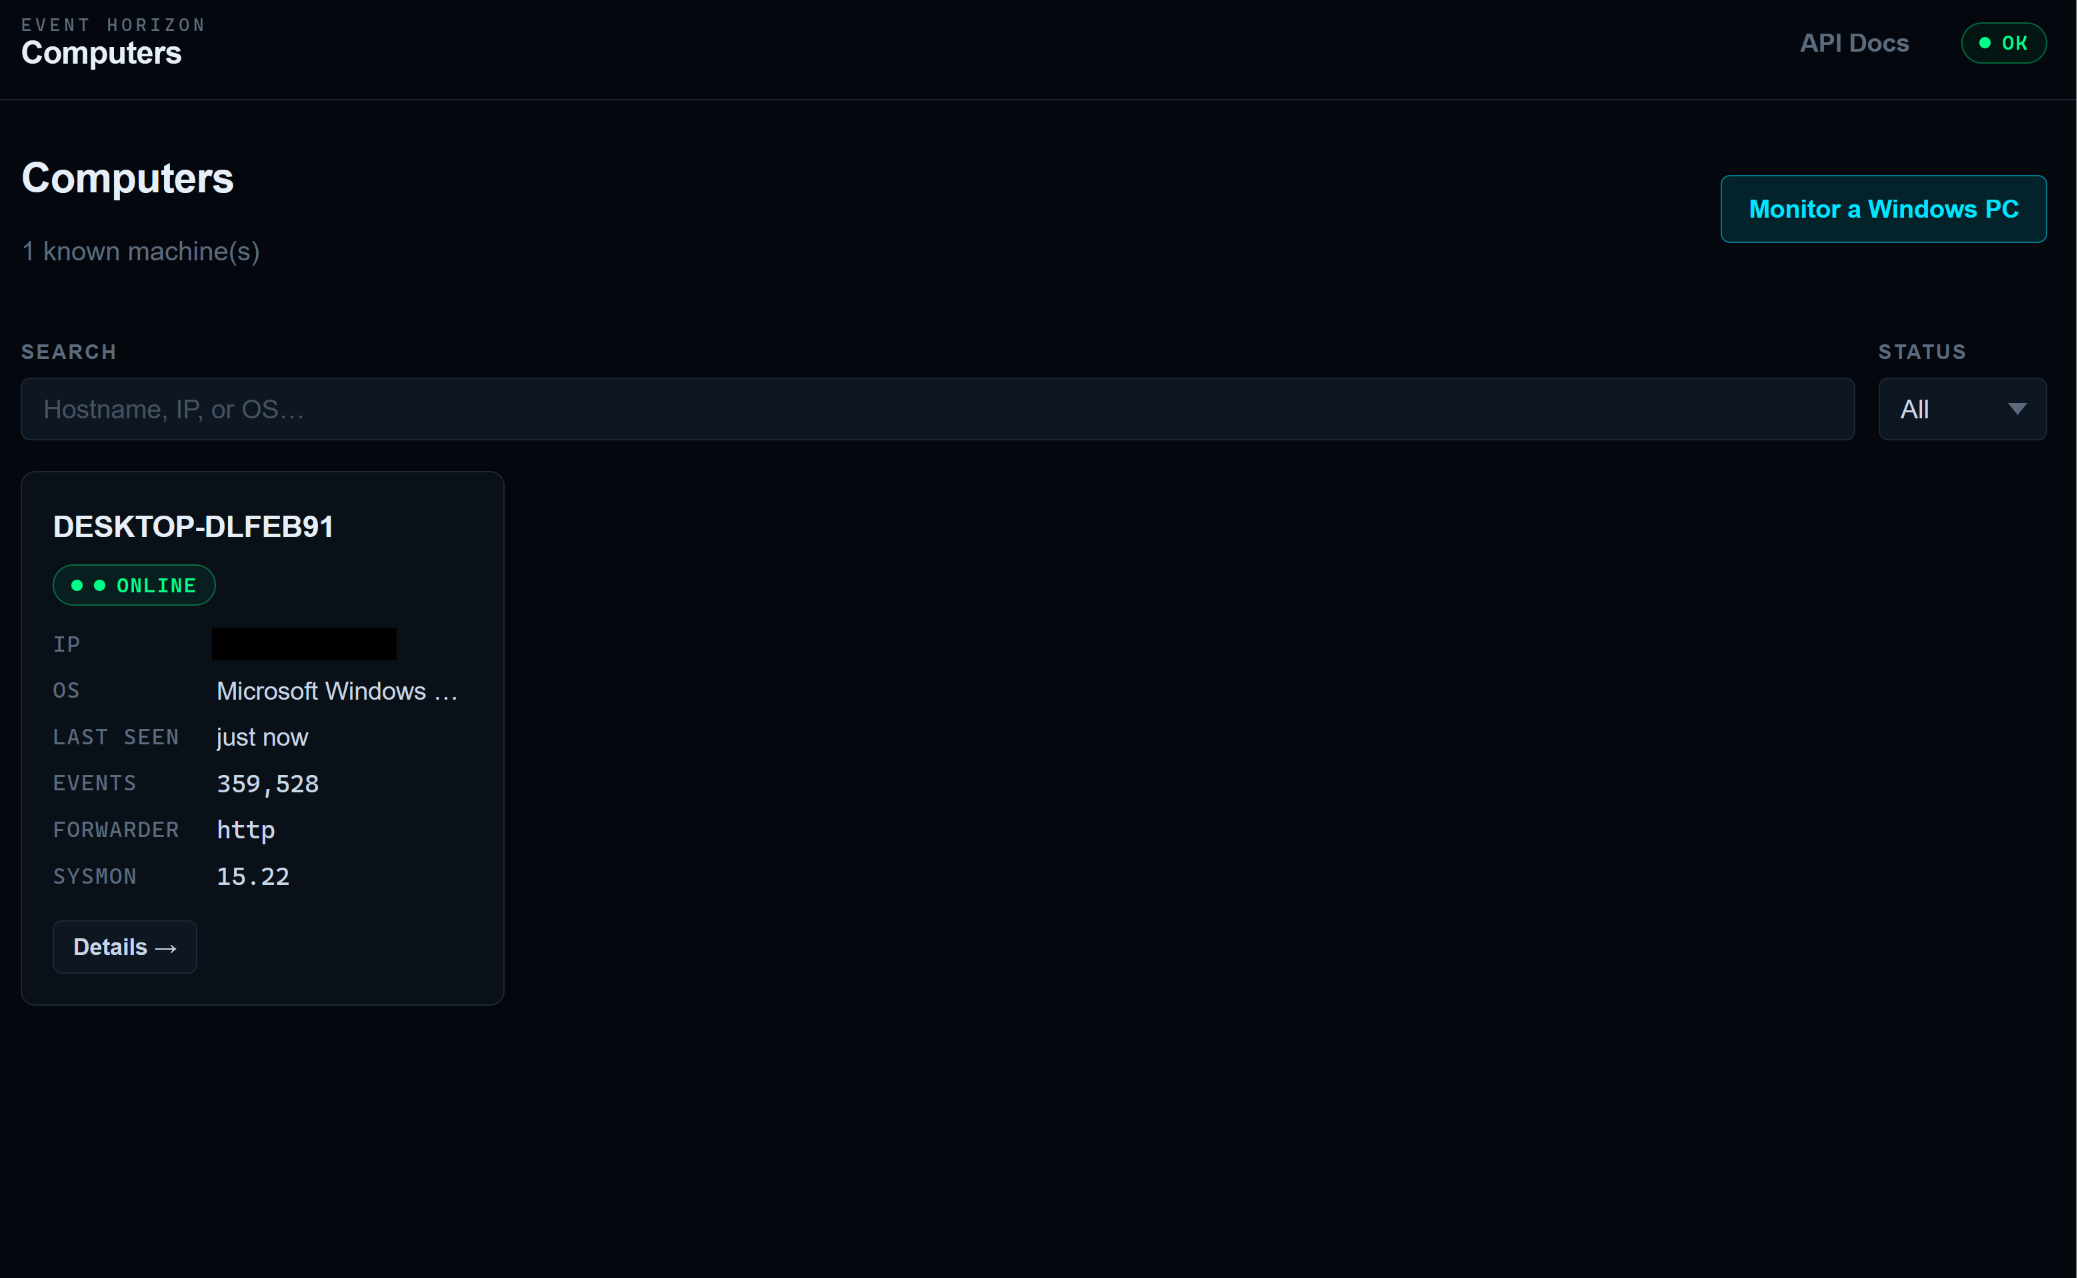
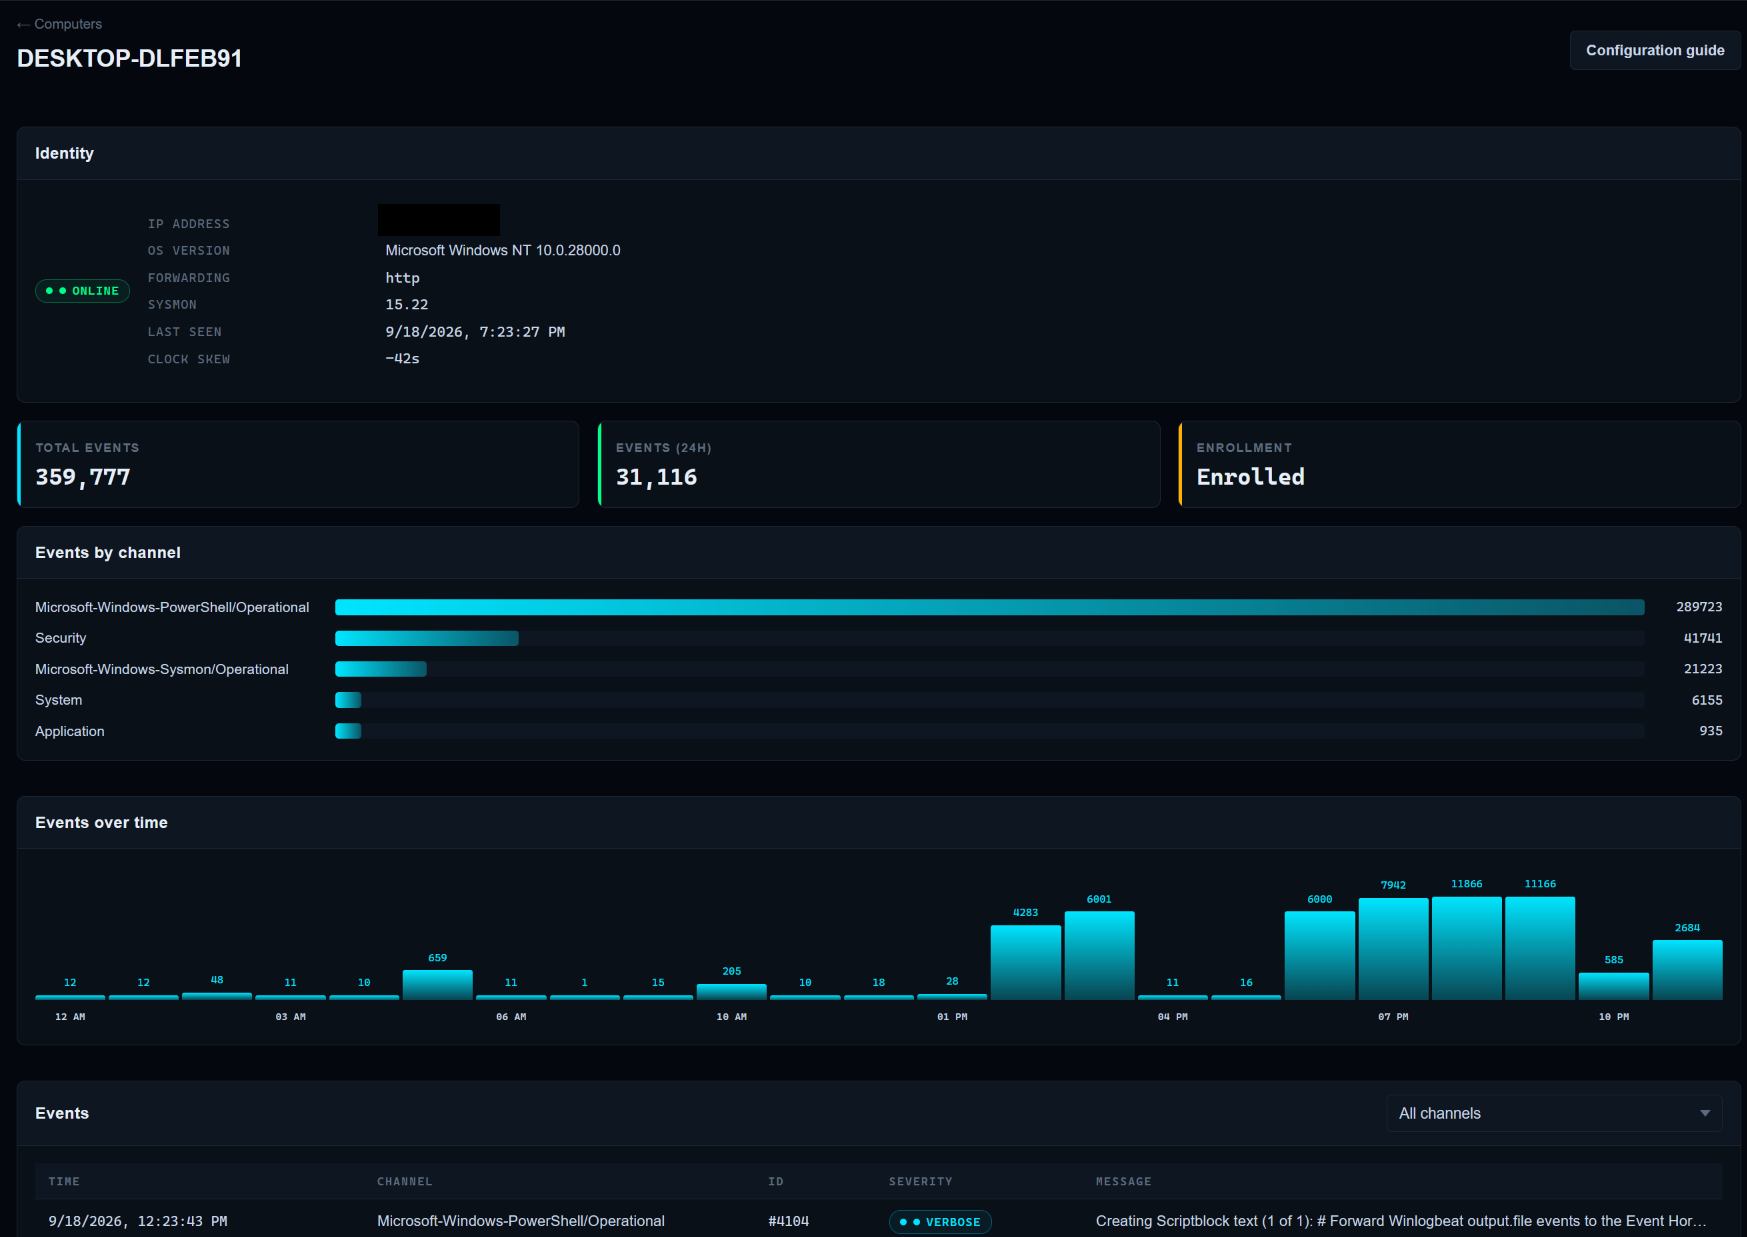
You can even click on them and get a better look at a dashboard curated to that computer specifically.
Findings

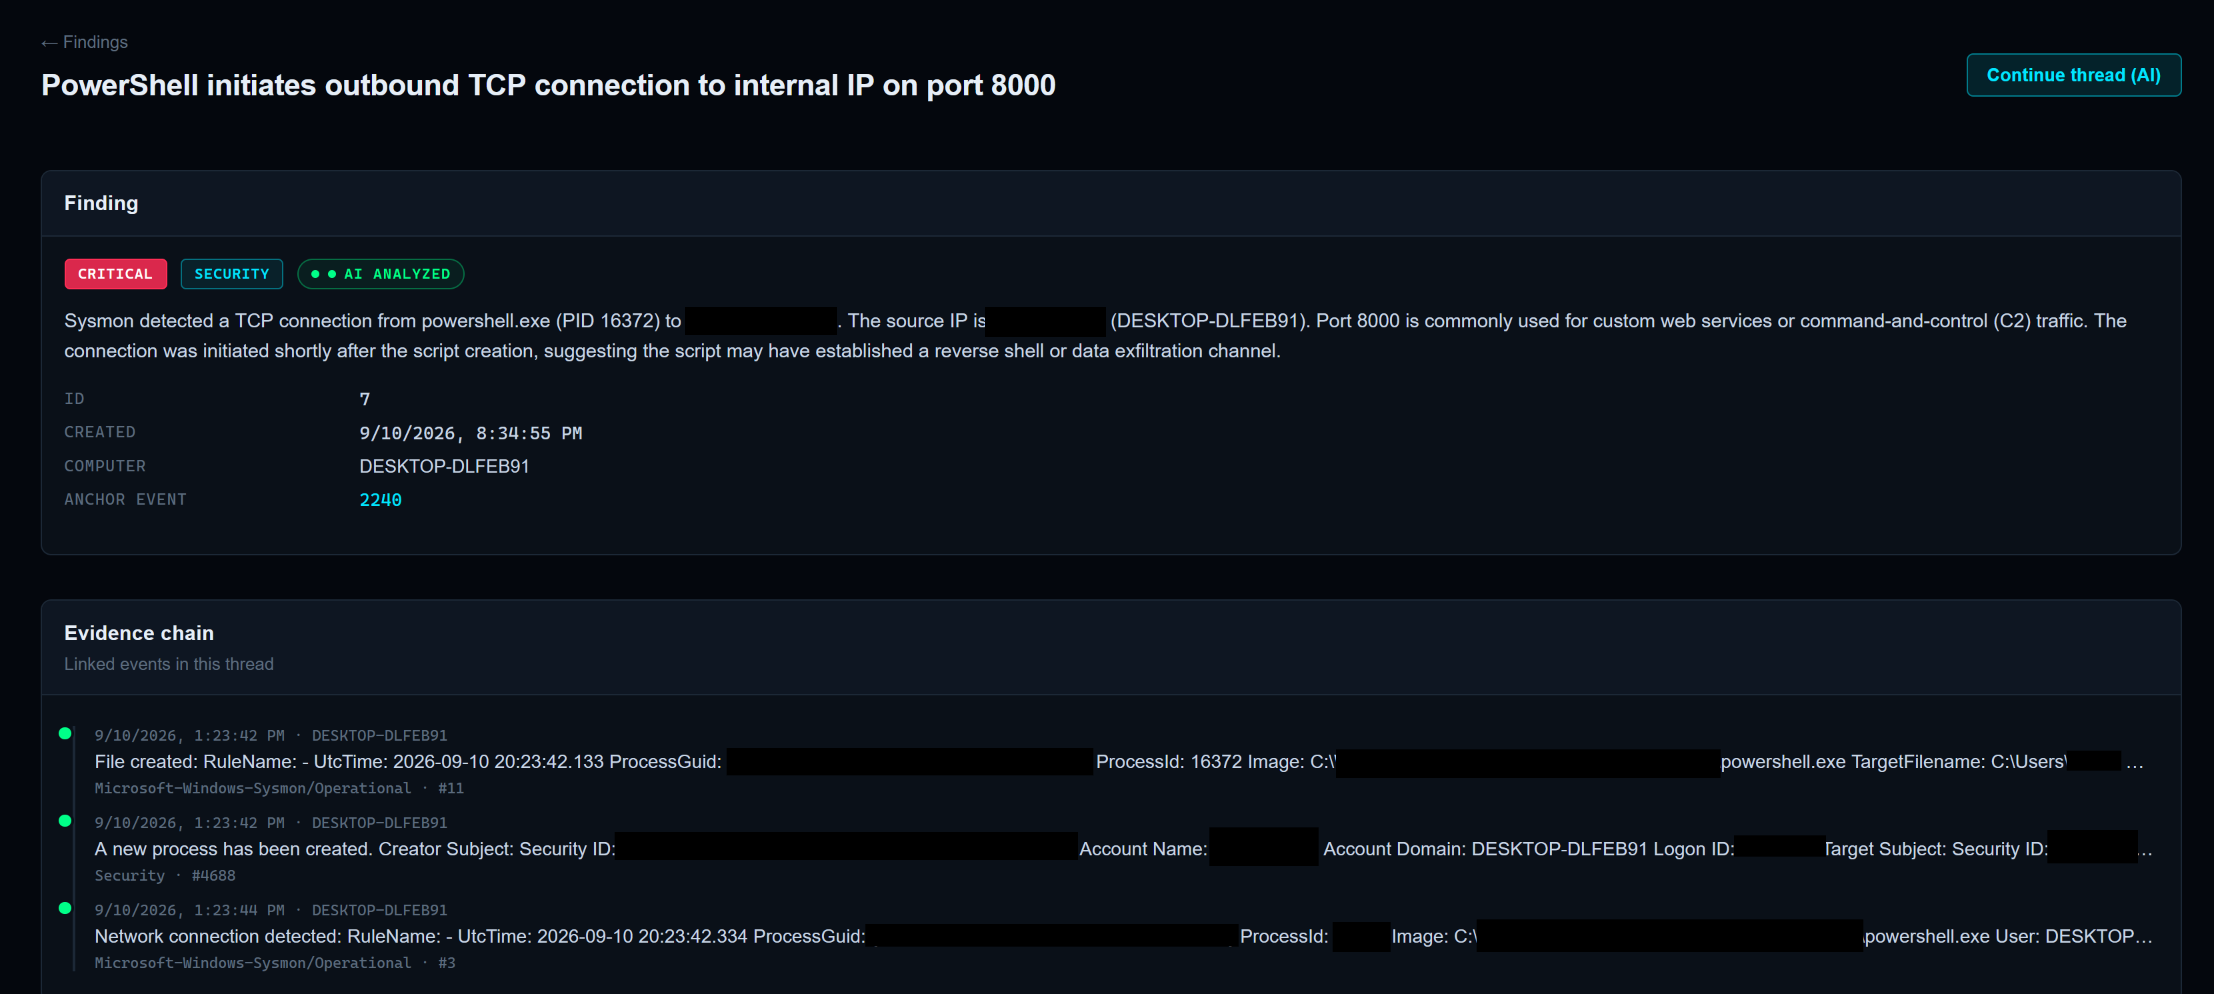
Here is the most important page, effectively the entire point of the product. This page is collections of events the local AI has deemed notable evidence for possible issues. Issues range from basic notable info and minor warnings to a scale of problems ranging from low to critical.
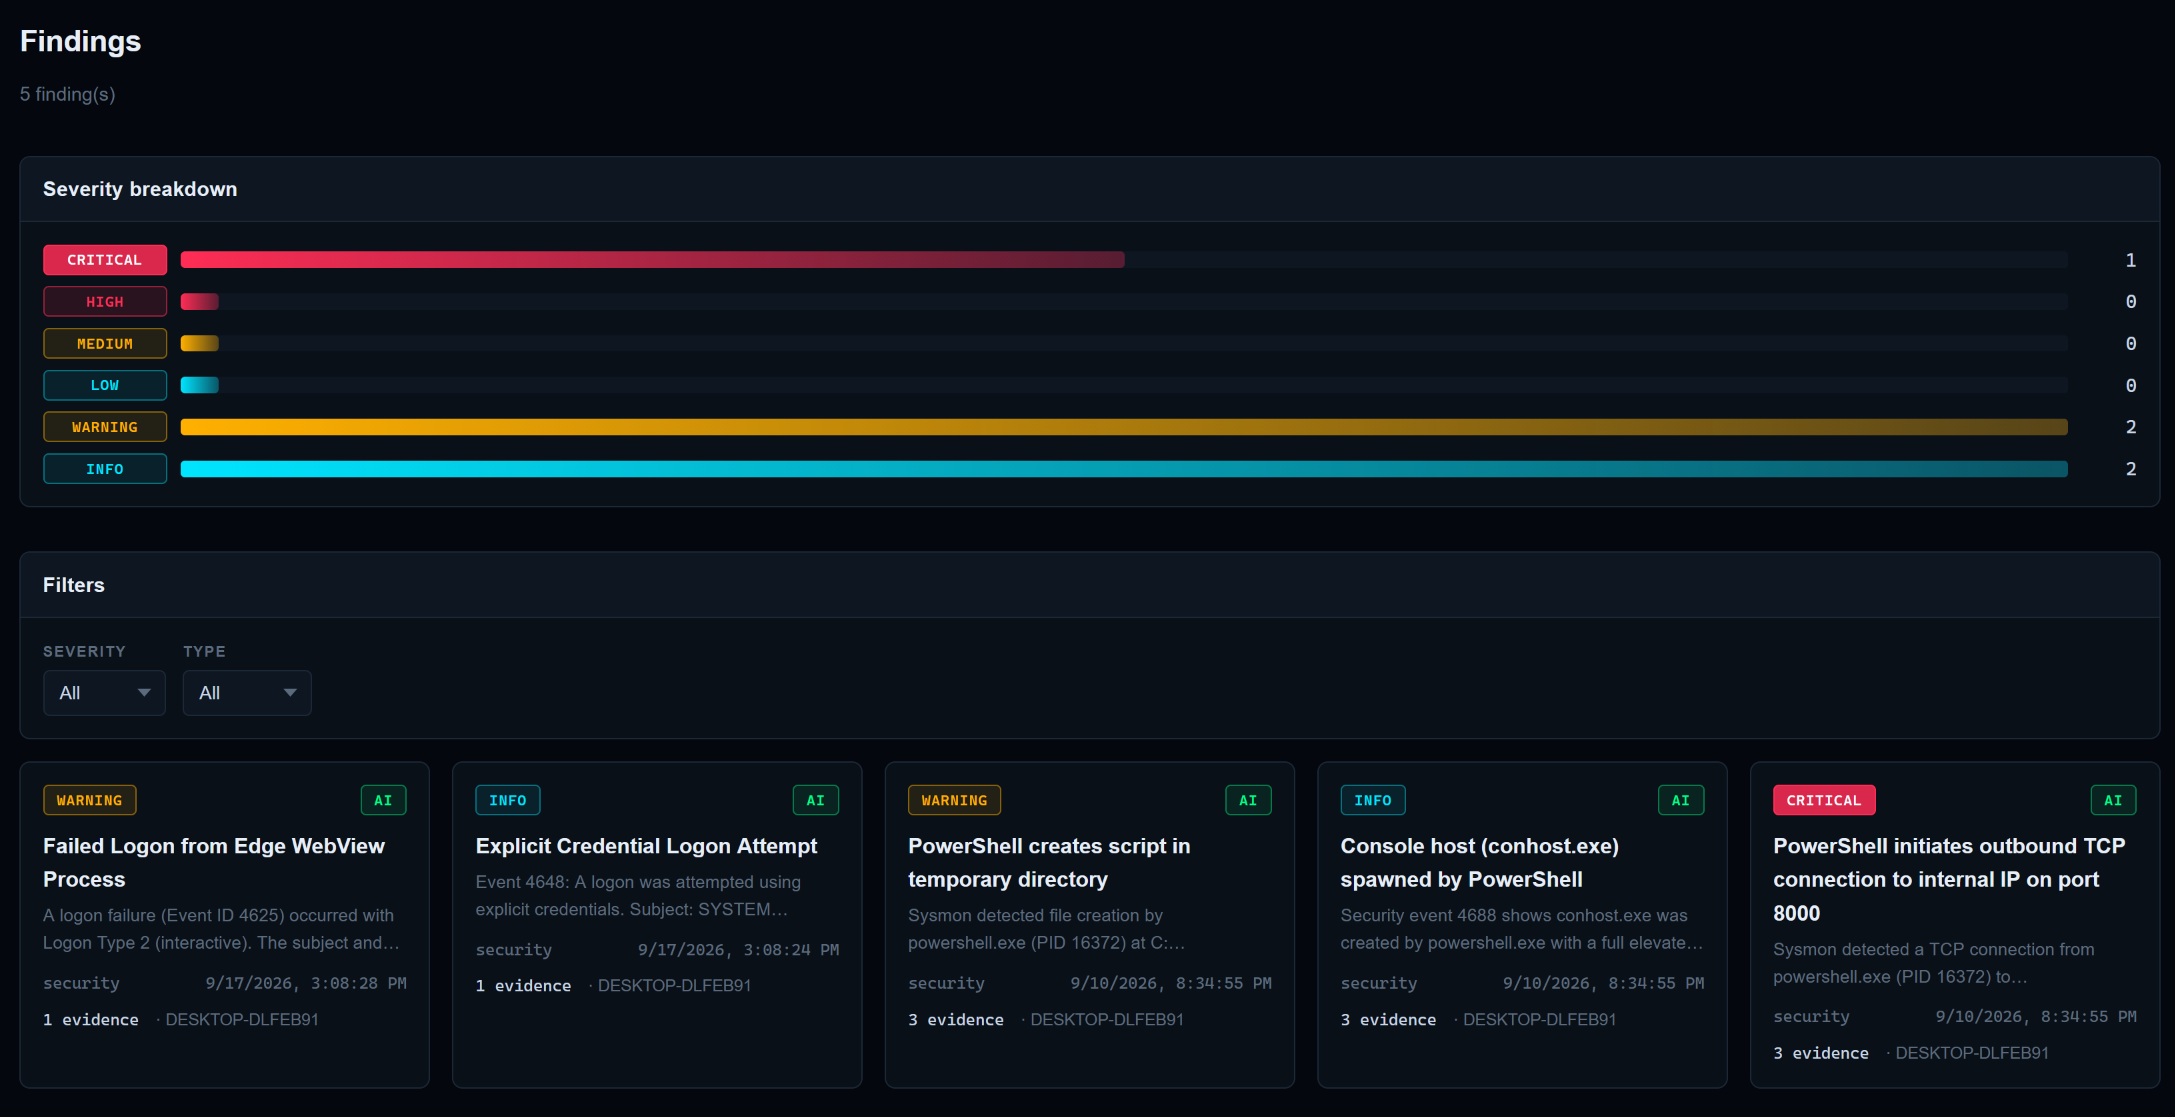
You can click on each finding individually to get a better idea of why its an issue and the AI’s advice on how to solve it.
Miscellaneous Pages

There are a few other important pages worth noting within the program, from your basic configuration where you set up and decide which AI model you’d like to use:

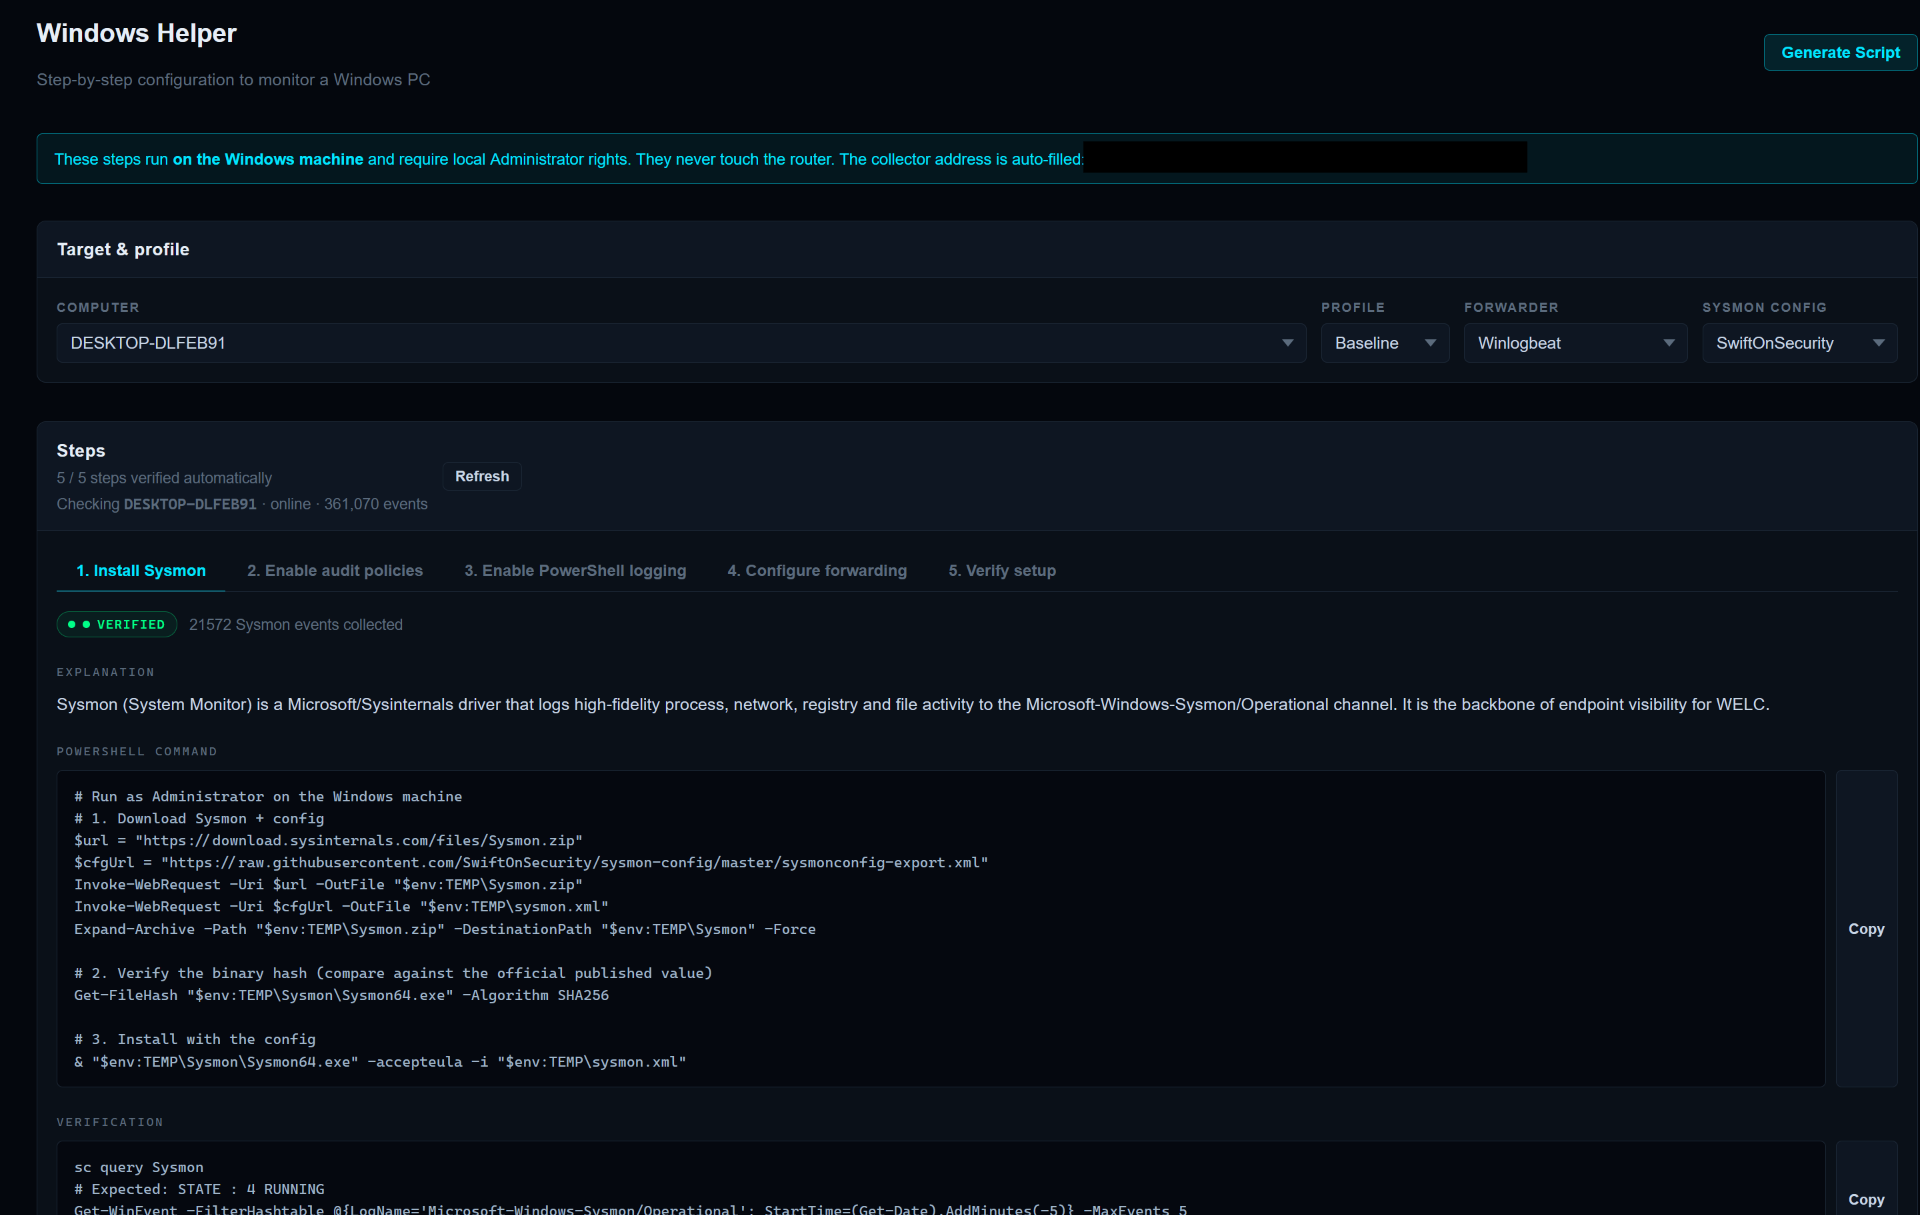
To a step by step tutorial on how to add new PCs to the database:
Final Notes

Overall we’d love to hear what you think. It’s in very early stages so we’d love your feedback or if you even think it’s a worthwhile endeavor at all.
2 Likes

@wendell I would be interested in helping and also creating a tie into my read-only dashboard Cerebro. I have a variety of systems in my lab to test with.

Hey Wendell! Love your Event Hub Project! Its somewhat similar to a project I showed you I made at Own Your Sh*t Raleigh. My AI SOC Dashboard.

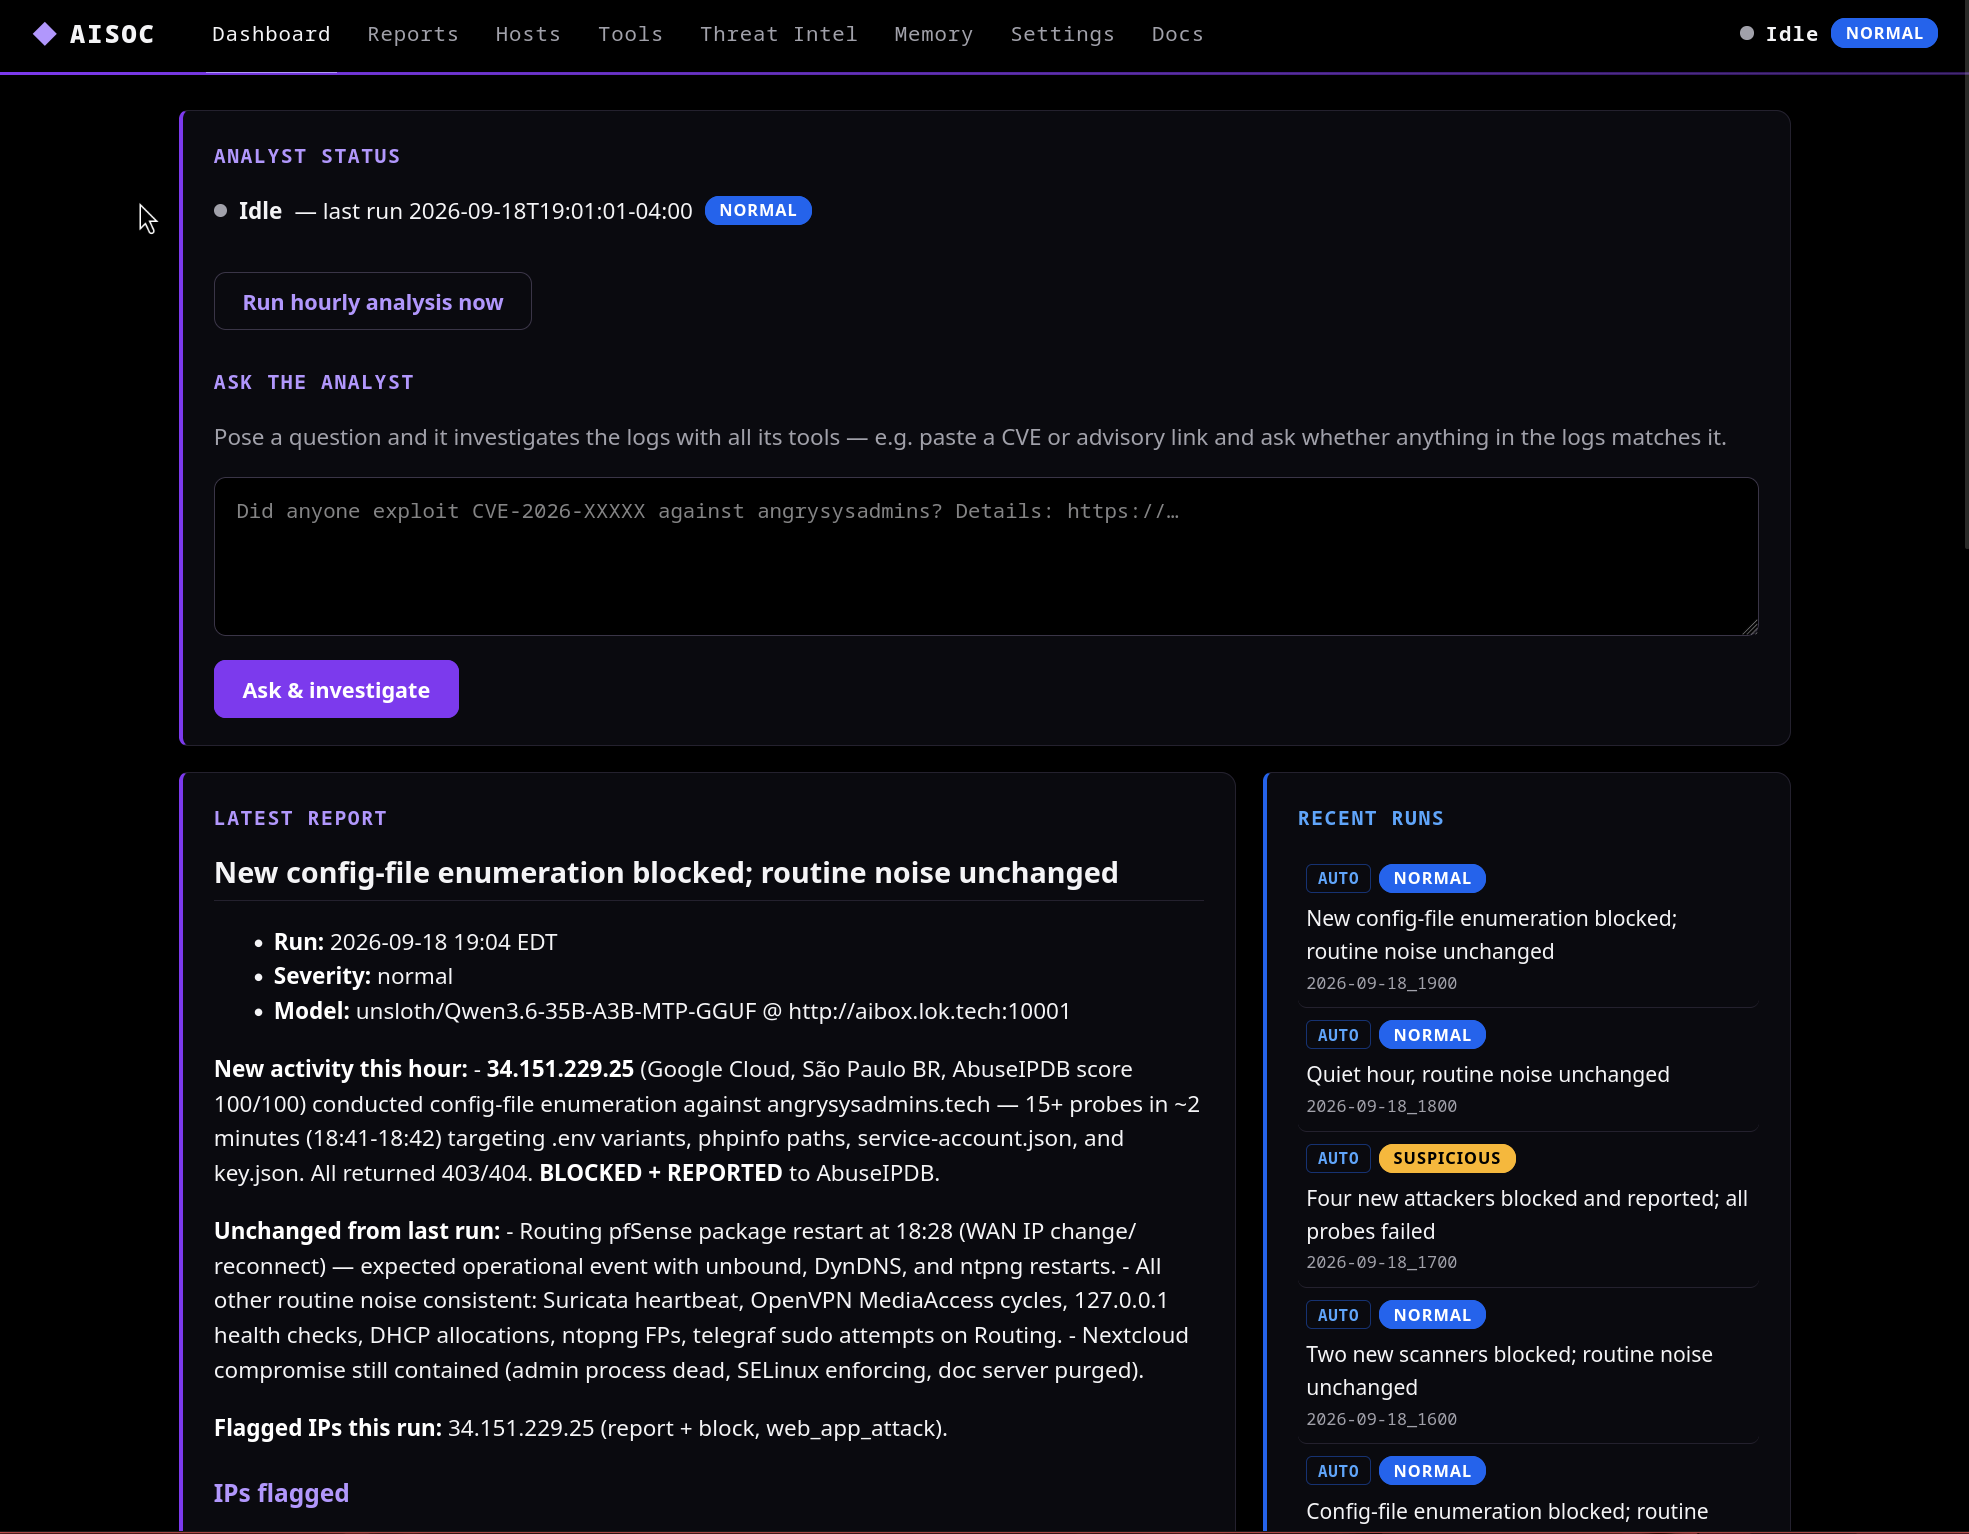
Its a basically a SOC+ SOAR run by AI. It has an hourly job that gets the last hour of logs from Wazuh and Graylog. There are state levels, normal, suspicious, and Critical. Every run the AI sets this state or leaves it depending on what its found. It also has a shared memory file between runs so the agents leave notes for each other. It spawns sub agents that investigate specific things and provides validation on it. It has many AI tools that it has access too:

  • Host memory function
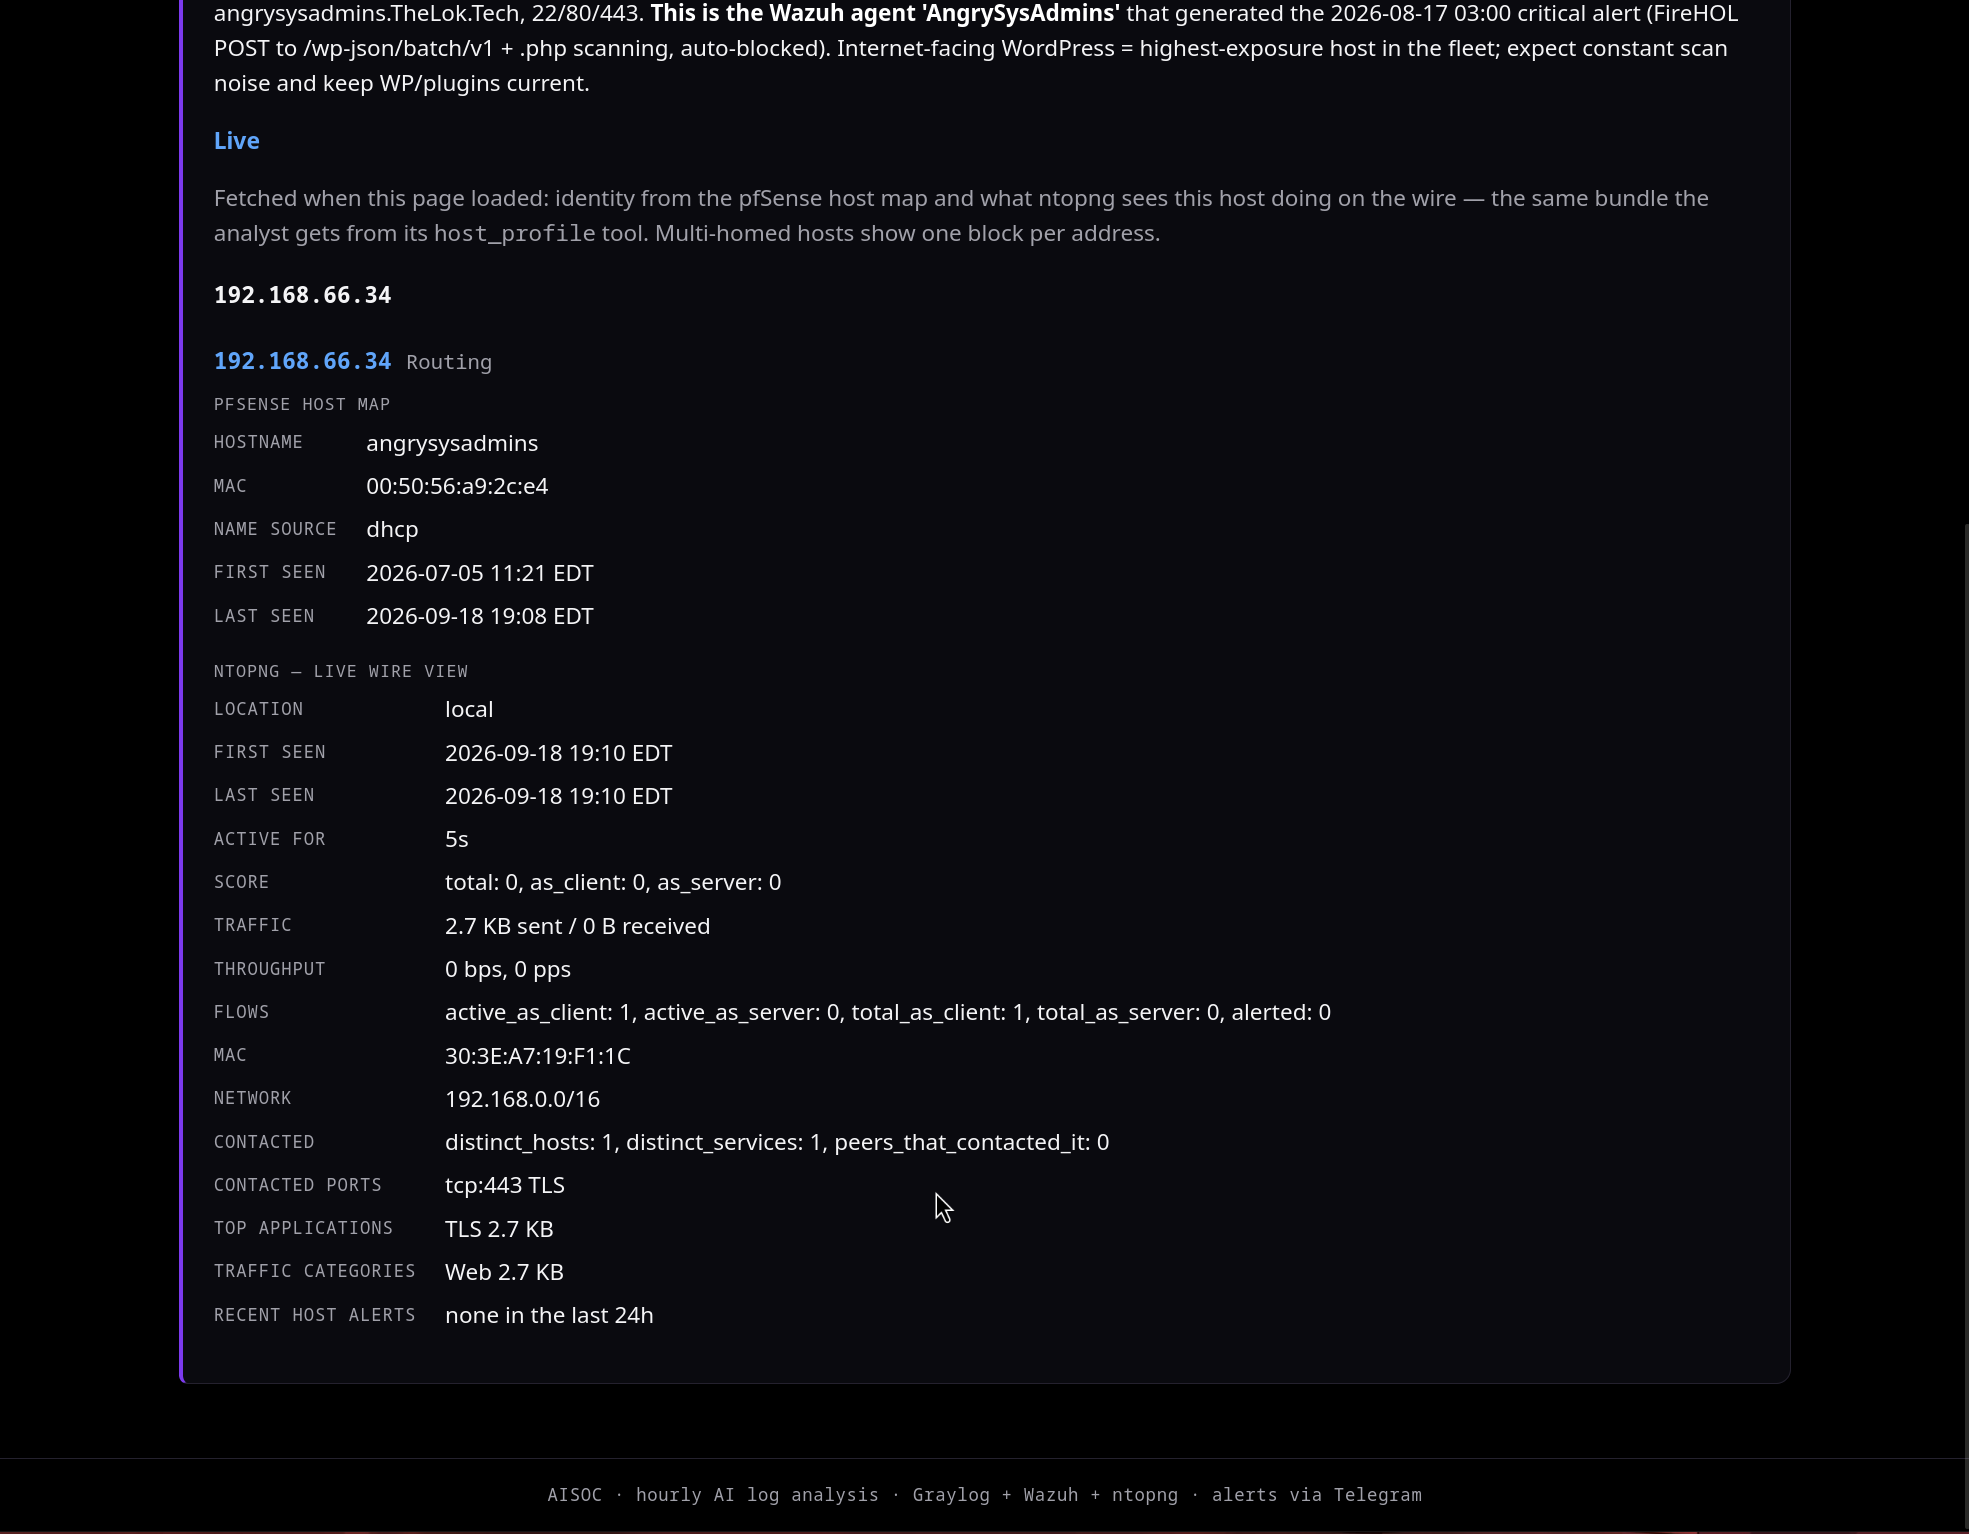
    • This tool callable by the AI and editable by the AI is a MD file with loads of details about a host like its IP addresses, Hostnames, Services it hosts, and Live data it pulls from Ntop-NG running on the primary router PFsense.
    • This is very nice as overtime the AI builds up a decent
  • Host check
    • AI gives an IP or FQDN. If its an internal host, then it gives it the MD file for the host memory along with the live data. If its an external IP, it gives it the geoip data, if its a tor or vpn node, and abuseIPDB score plus 5 reports. It will also say if its blocked or not via the threat intel center.
  • Packet Capture via NTOP-NG
    • This is a tool call that allows the AI to Pcap for up to 5 min and see whats going on in a host. Useful for troubleshooting or seeing if there is an ongoing compromise
  • ExploitDB search
    • This allows the AI to search a program and version to see if there are any known vulns/exploits for a given version of a product
  • Threat Intel Center tools (block and report)
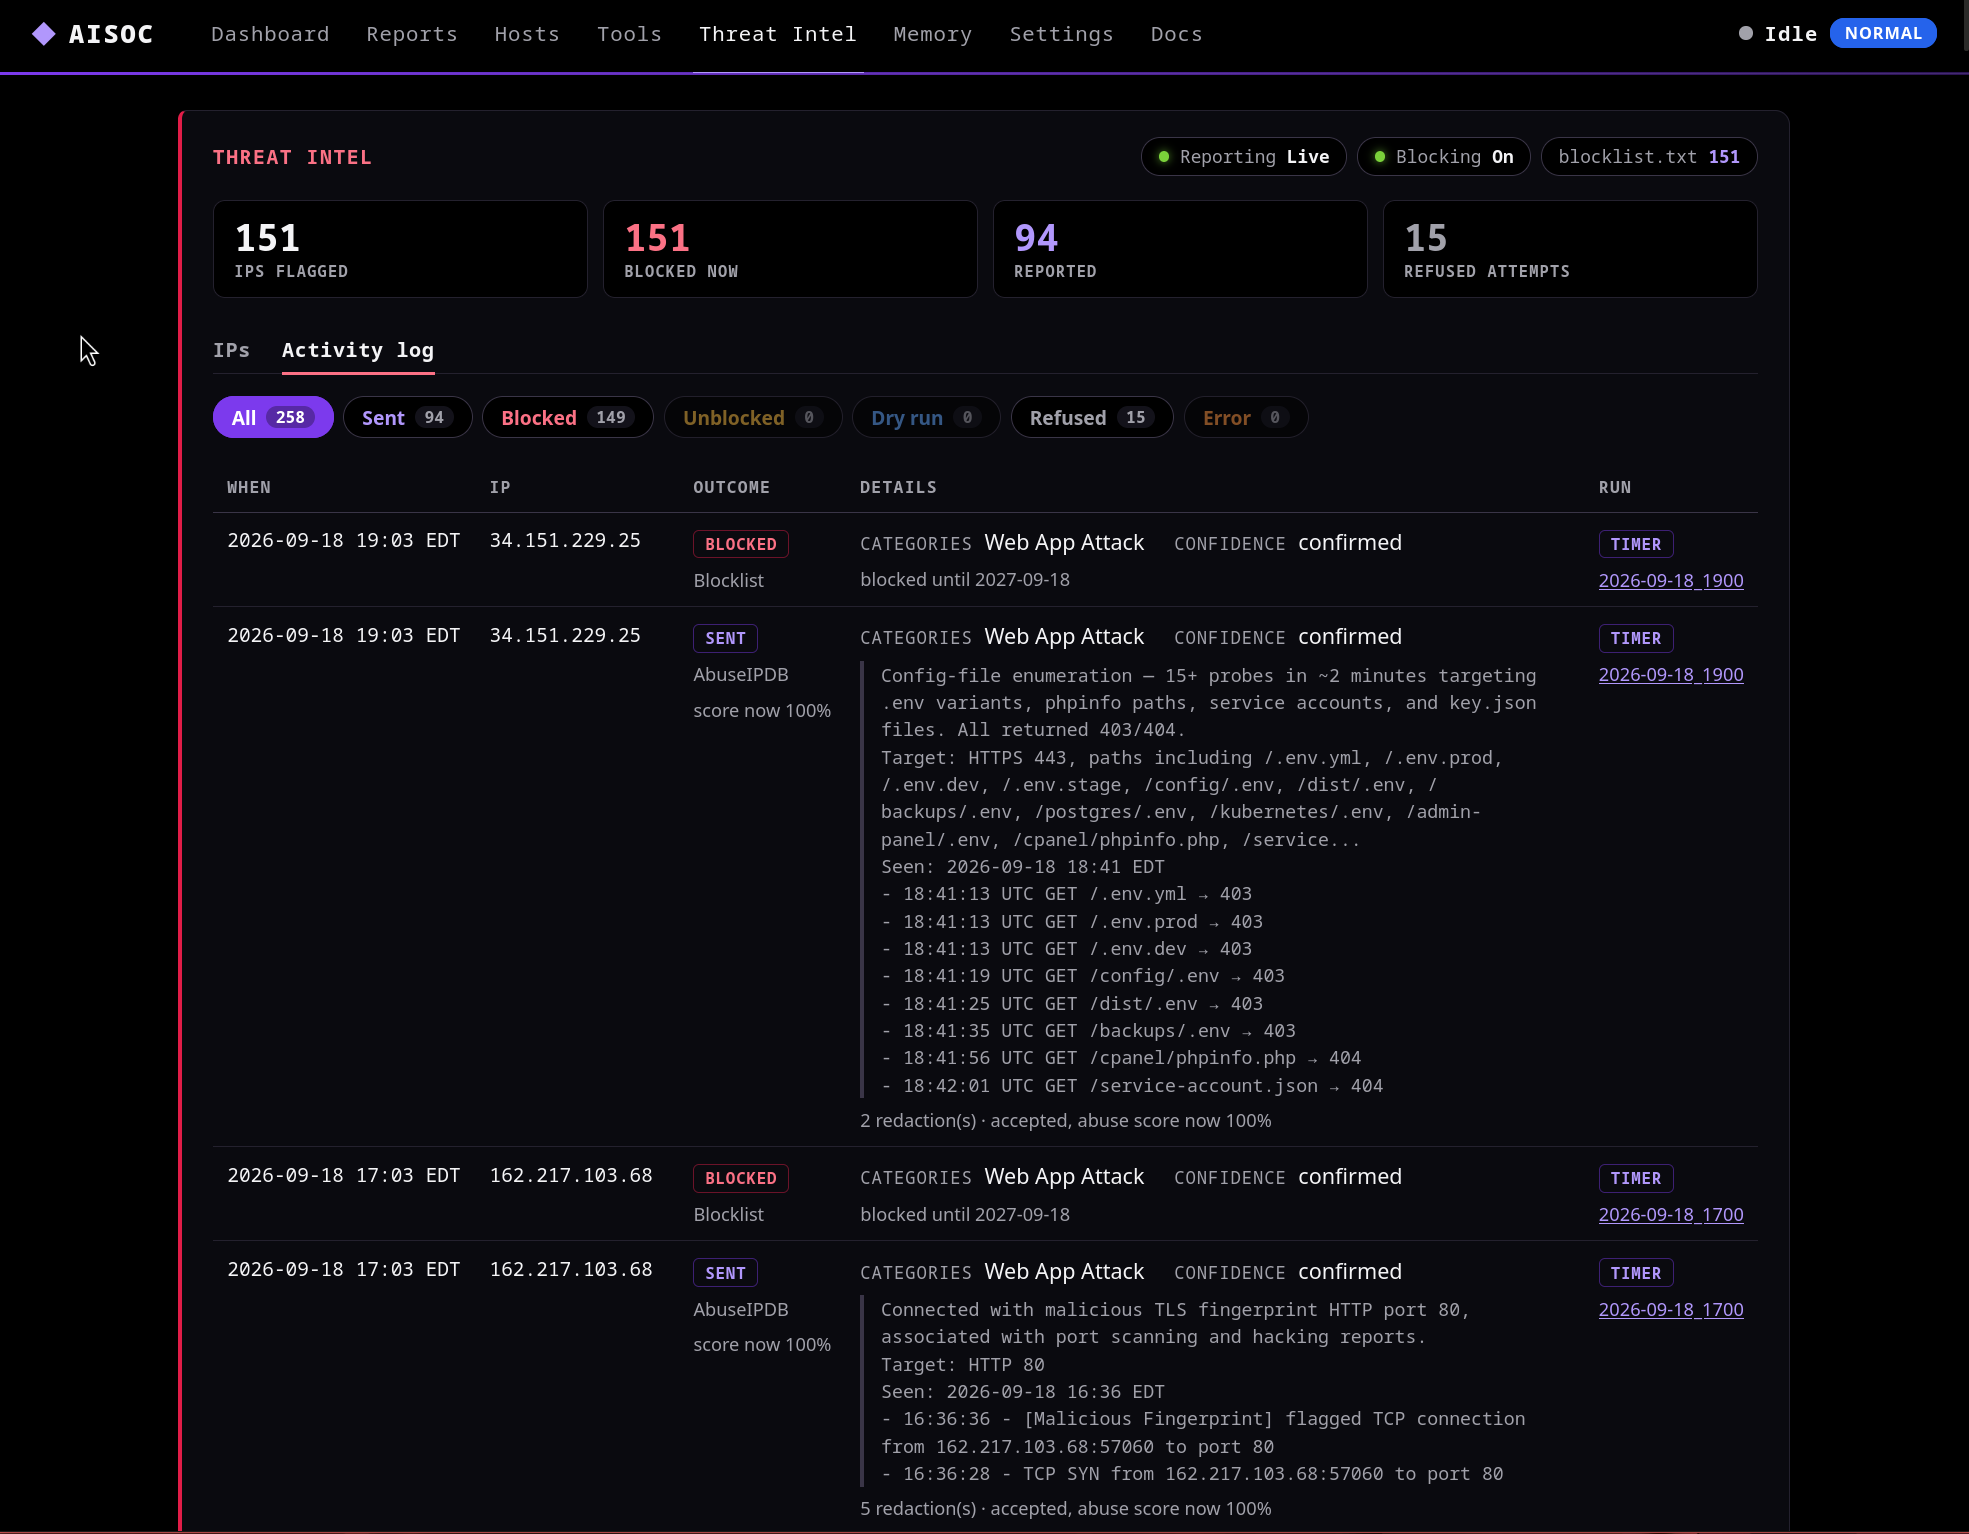
    • This Blocks + Reports malicious activity observed from logs. Things like brute force attacks, Environment scans, command injections, Cross Site Scripting, etc. If it passes a certin threshold with specific data, its both blocklisted AND * * reported to abuseIPDB. The blocklist is hosted as a TXT and hourly imported to Wazuh, Cloudflare, and PFsesne to block the offenders

Depending on the config, These alerts go to Telegram and SMTP If its suspicious or critical. It produces a daily and weekly report also summarizing things to fix/look at.

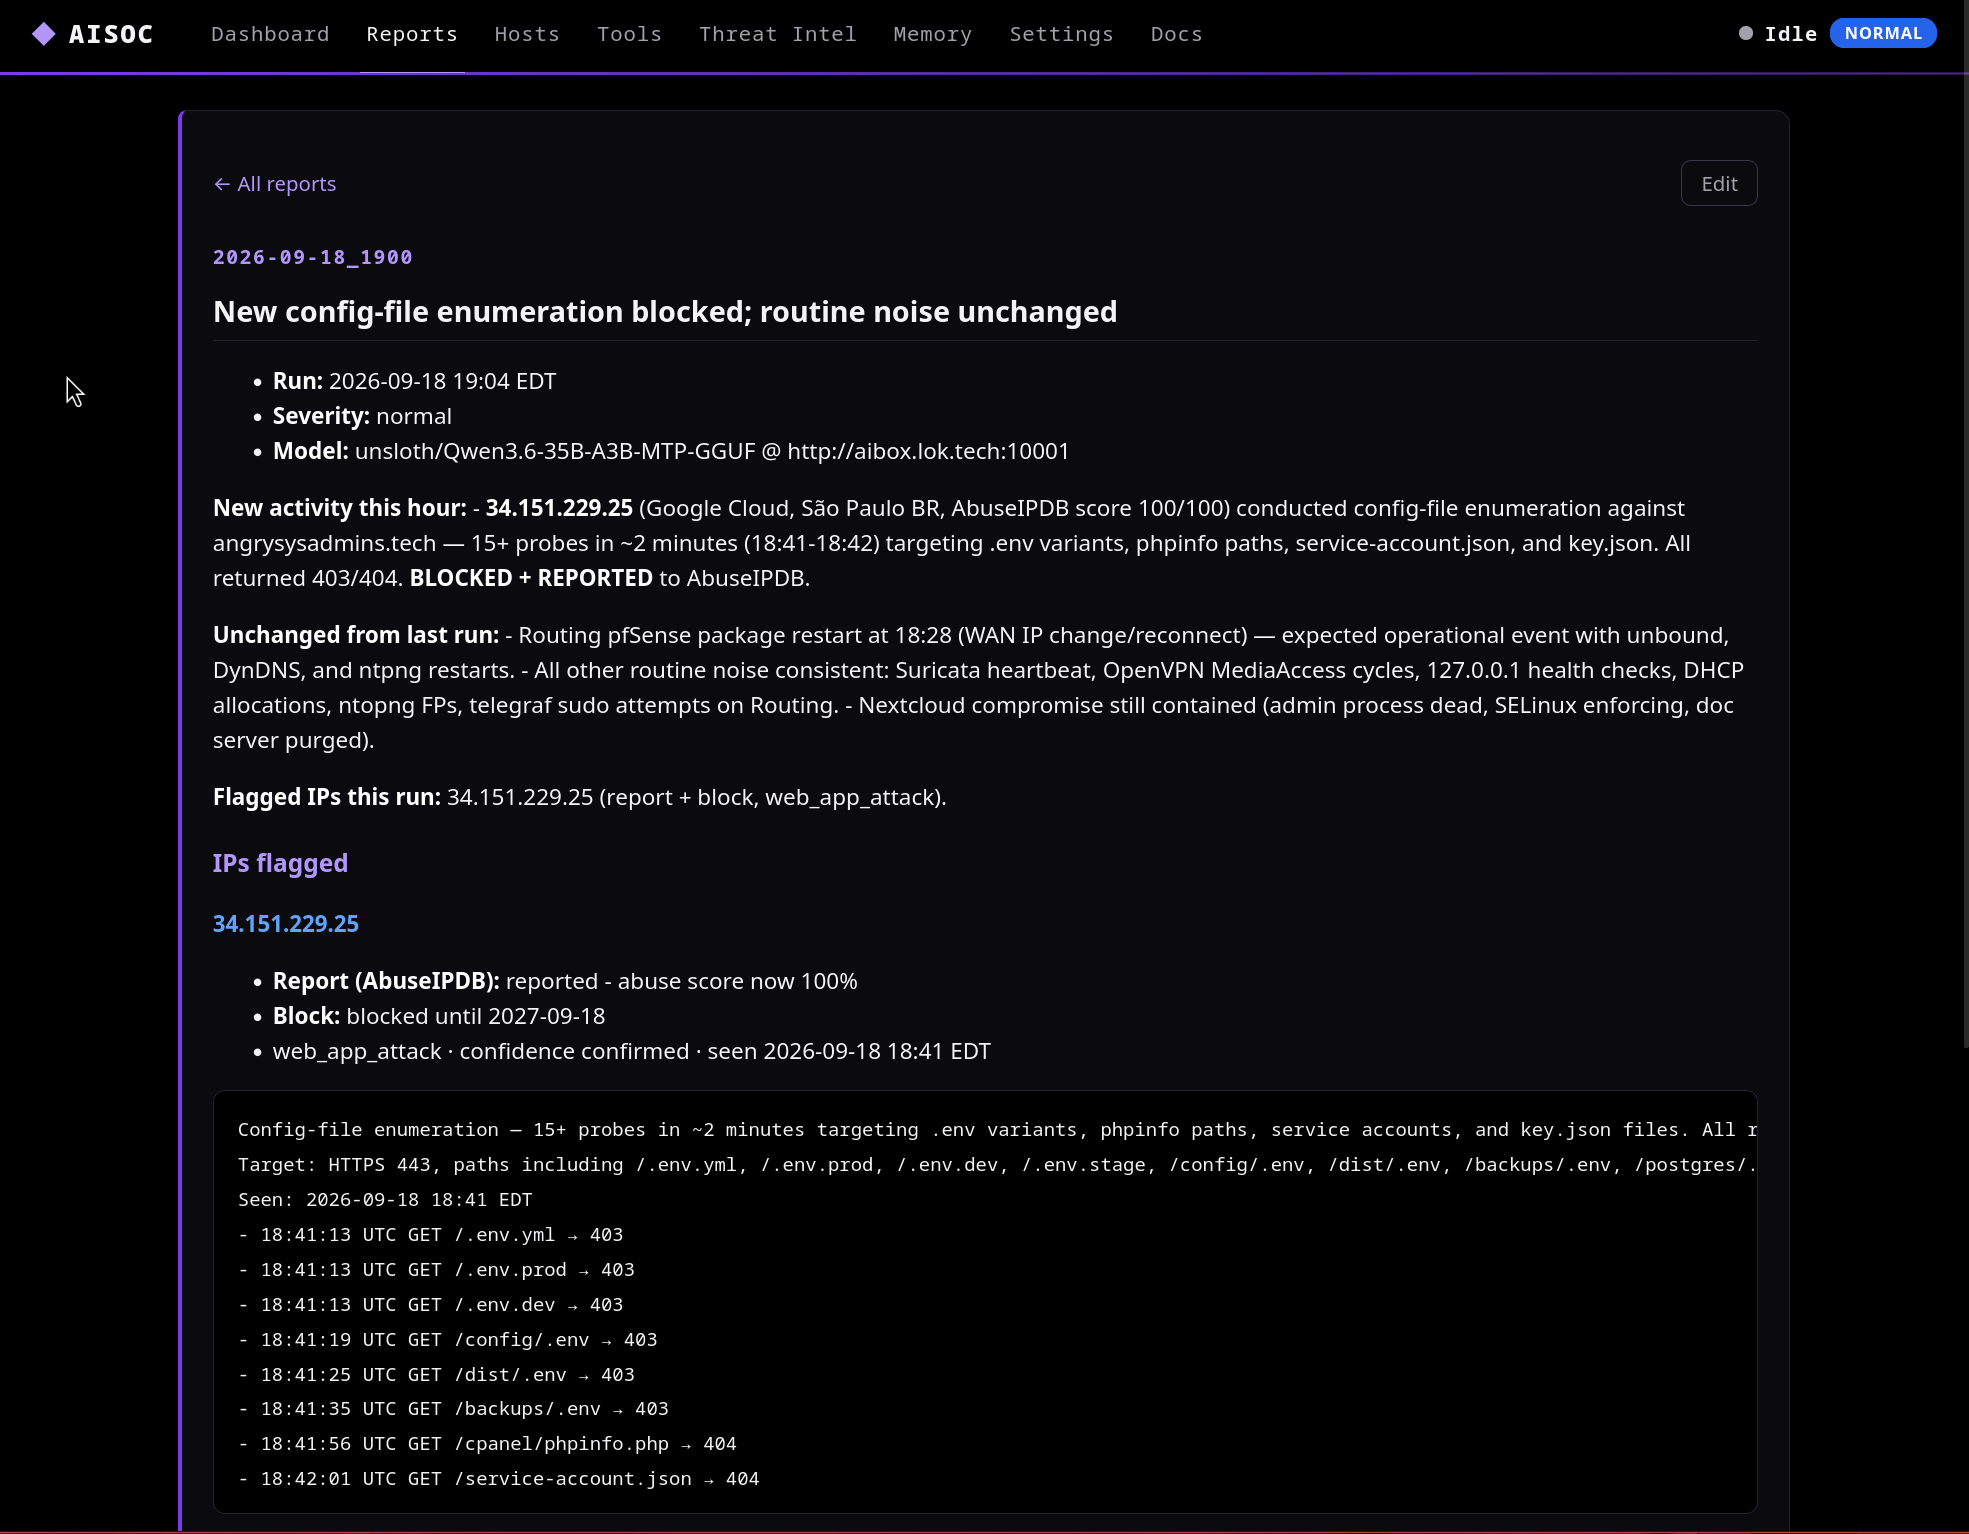
You can see some screenshots here:

Dashboard:

Hourly Report:

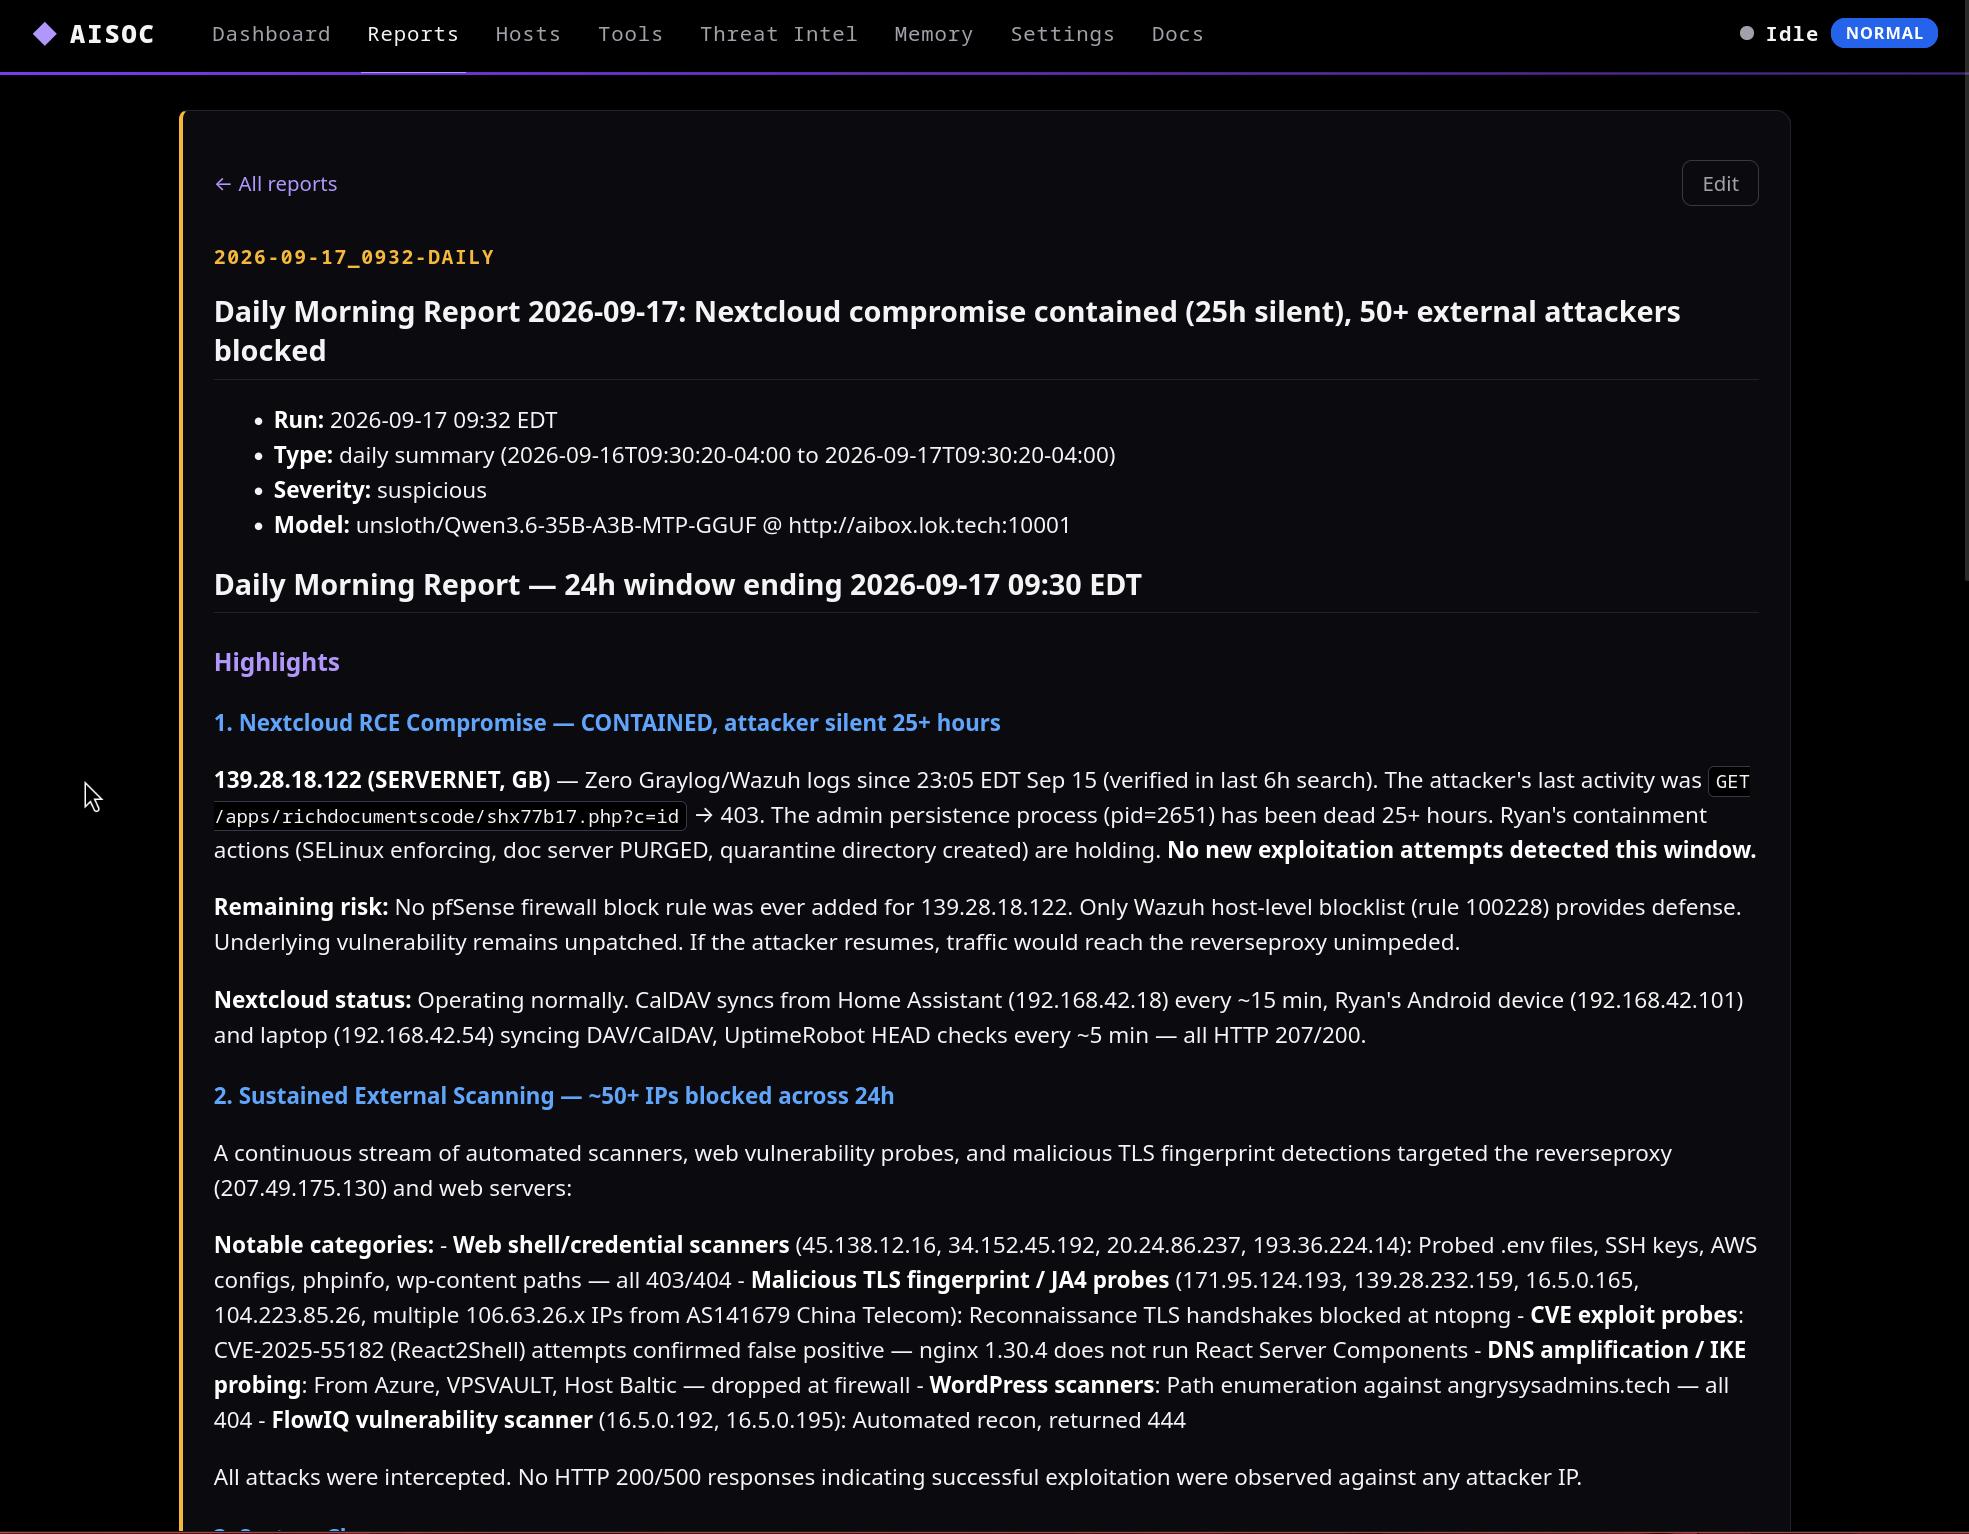
Daily Report:

Each one of these reports has a chat thread where you can ask it specifics about the report. the context is saved so its pretty good. You can also use it to correct something the AI missed.

Threat Intel Center:

A Host ( my website Angrysysaminds.tech shameless plug :slight_smile: )

For Event Horizon, A hourly or Daily Summary by the AI would be awesome, as well as a host memory tool. I use the host memory tool and the Host lookup tool for other ai agents and its very useful! While my tool is focused on security, perhaps yours can be both security and operational. In my case, I use Graylog and Wazuh for pulling the logs, I should add your tool though for sysmon, it would be a little bit better than wazuh because it only cares about Security mostly.

Cant wait to see what you cook up!