DeepSeek Deep Dive R1 at Home!

Thanks, double-checking you use this? bartowski/Mistral-Large-Instruct-2411-GGUF · Hugging Face

I didn’t find any unsloth but did stumble on “SOAR” models like julien31/Soar-mistral-123b · Hugging Face which seems more for research and for some reason they use 2407 instead of 2411.

It doesn’t sound like they were planning an actually larger model. I am also doubtful that their medium is the new large, will hold up.

Yes, exactly that one. I run it at either Q5_K_M or Q6_K, I don’t feel much difference.

1 Like

Yeah that might be a big challenge for the next months. How to see what you can’t benchmark?

Beside

  • human preference from chatarena, which imho is kind of useless (i don’t care that people prefer that chatgpt’s way to write compared to grok or whatever, models are too powerfull for it imo)
  • Benchmark that you can RL against
  • Math/code that you can also RL against

Beside math and code (and may be agentic behavior to some extent) where we might gain performance for some times, for the rest we fall into goodhart’s law:

“When a measure becomes a target, it ceases to be a good measure”.

Wikipedia: goodhart’s law

Or rather, when the models themselves are still incapable, and not getting anywhere closer to doing the kind of jobs that relied on long context, exact understanding, and yes, agentic behaviour, the kind of things they pay humans well for, despite being supposedly human or super-human level at a lot of benchmarks previously thought difficult. Though I shudder to think of the day they at last could, perhaps not without some fundamental architectural change.


Back on topic, after some memory finetuning and a driver and CUDA toolkit update, my current setup could do 42tok/s prompt processing and 6.2tok/s token generation at 0 context, and 28tok/s and 5.3tok/s respectively at 36K, with the ~250GB q2_k quant of DeepSeek-R1-0528 on the latest ik_llama.cpp, with 4x64GB DDR5-4800@36-40-40-78 & 10us tREFI, an 1CCD (so 64GB/s tops in RAM bandwidth, 62GB/s benchmarked with this setup) Ryzen 7 7800X3D, and an Nvidia video card with 16GB VRAM.

Until some significant improvement happens for running 2R 2DPC on a desktop platform that’s not some too-expensive and blingy G.Skill kits with some silicon lottery wins, there’s probably not much more room for improvement without going workstation or used server. Even then, a hypothetical ~90GB/s read bandwidth on a platform unconstrained by the IF bottleneck and running at maybe DDR5-6400 might get you ~9tok/s token generation, and not much more prompt processing speed.

3 Likes

Two years ago, I started talking with peers about my worries regarding AI’s development. While AI has gotten steadily better at scoring well on tests or helping users get practical results, we haven’t seen any huge leaps in the core technology, transformative advances “step-function improvements,” but they’re still missing.

This slow progress is causing problems for companies planning their workforces. Many businesses have already cut staff, assuming AI would soon deliver massive productivity jumps. But those game-changing benefits might still be a decade away. The danger is that people are mistaking small, gradual improvements—or even clever tools like “agentic workflows” (AI systems that automate multi-step tasks)—for revolutionary breakthroughs. For example, some companies are excited about AI that can plan and execute complex tasks automatically. But these systems are often just advanced versions of the same technology that powers smart auto-complete suggestions. They’re helpful, but not fundamentally new. If companies act on unrealistic expectations, they could end up with skill gaps or operational issues that take years to fix.

As time passes without major AI breakthroughs, the gap between what people hope AI can do and what it actually can do will grow clearer.

1 Like

Anyone else using openweb-ui 6.15 with ik_/llama.cpp and not seeing tokens per second statistics? In Models, I have also checked “Usage”. Same problem as described in https://www.reddit.com/r/LocalLLaMA/comments/1lt1z1a/how_do_i_see_my_tokens_per_second_speed_im_using/ and prompts me to ask what others see… does it only work for ollama?

I’ve looked through the Github issues couple of times and tried other stuff like explicitly putting “none” in API key and also toggled the model to Local instead of External.

A brief look at the browser’s debug console, with llama-server configured via direct connection, revealed no such info in the HTTP exchanges. All they had were the three (completion, prompt, and total) token counts, all in turn displayed by the UI, even though more information is visible in ik_llama.cpp’s own debug output.

So yes, it’s probably Ollama specific.

Someone might be interested in adding them, though I expect that might end up breaking someone else’s parsers and clients. But yes, an option for extended usage info would be nice to have.

1 Like

Can someone explain me what these value actually mean in the sweep benchmark?

Screenshot From 2025-07-08 18-08-01

Like PP is the prompt processing length while TG is the amount of token to be generated. I figure N_KV is the context size but what is the difference between T_PP s and S_PP t/s and the last two for TG?

T_{PP|TG} is the total time taken to do prompt processing and token generation.

From the first row, 512 total tokens to PP / the 5.574s taken in total gives you the 91,85t/s. Same for the TG.

2 Likes

Ahhh now it makes sense, thank you.

@lerner

So ik_llama.cpp is not quite as updated as mainline llama.cpp in terms of how “openai compliant” its server endpoint is. The usual completions and chat endpoints work fine in my usage, however anything special like out of band tool-calling endpoints or other things generally require you run some kind of reverse proxy or openai compliant server pass through e.g. this guys FastAgentAPI maybe.

As far as I know the only way to get the tok/sec is to estimate it on the client side which I do in my little python async streaming chat app using this ds_token python library. It only works for DeepSeek but gives a good enough estimate for models which use other tokenizers.

I’ve used OpenWebUI successfully with ik_llama.cpp for basic features, but haven’t messed around with the multiple additional models and features which it tries to use and might not be fast enough with default settings. I haven’t tried this lately, but last this is how I started it:

#!/usr/bin/env bash

source venv/bin/activate

# IT DOES NOT HONOR HOST and PORT ENV VAR SO PASS IT MANUALLY
# https://docs.openwebui.com/getting-started/env-configuration/#port

export DATA_DIR="$(pwd)/data" # to clean up just do rm -rf ./data
export ENABLE_OLLAMA_API=False
export ENABLE_OPENAI_API=True
export OPENAI_API_KEY="none"
export OPENAI_API_BASE_URL="http://127.0.0.1:8080/v1"
#export DEFAULT_MODELS="openai/foo/bar"
export WEBUI_AUTH=True
export DEFAULT_USER_ROLE="admin"
export HOST=127.0.0.1
export PORT=3000

export ENABLE_TAGS_GENERATION=False
export ENABLE_AUTOCOMPLETE_GENERATION=False

open-webui serve \
  --host $HOST \
  --port $PORT
1 Like

Hi people! Can anyone explain me how to estimate how much VRAM the context will use, for example in Deepseek-R1, with different sizes except seeing if it OOMs or not? Like how can I estimate how much VRAM a 32k or 64k context would use?

Also is there a llama.cpp flag to tell llama.cpp on which CUDA device is should store the context?

tl;dr;

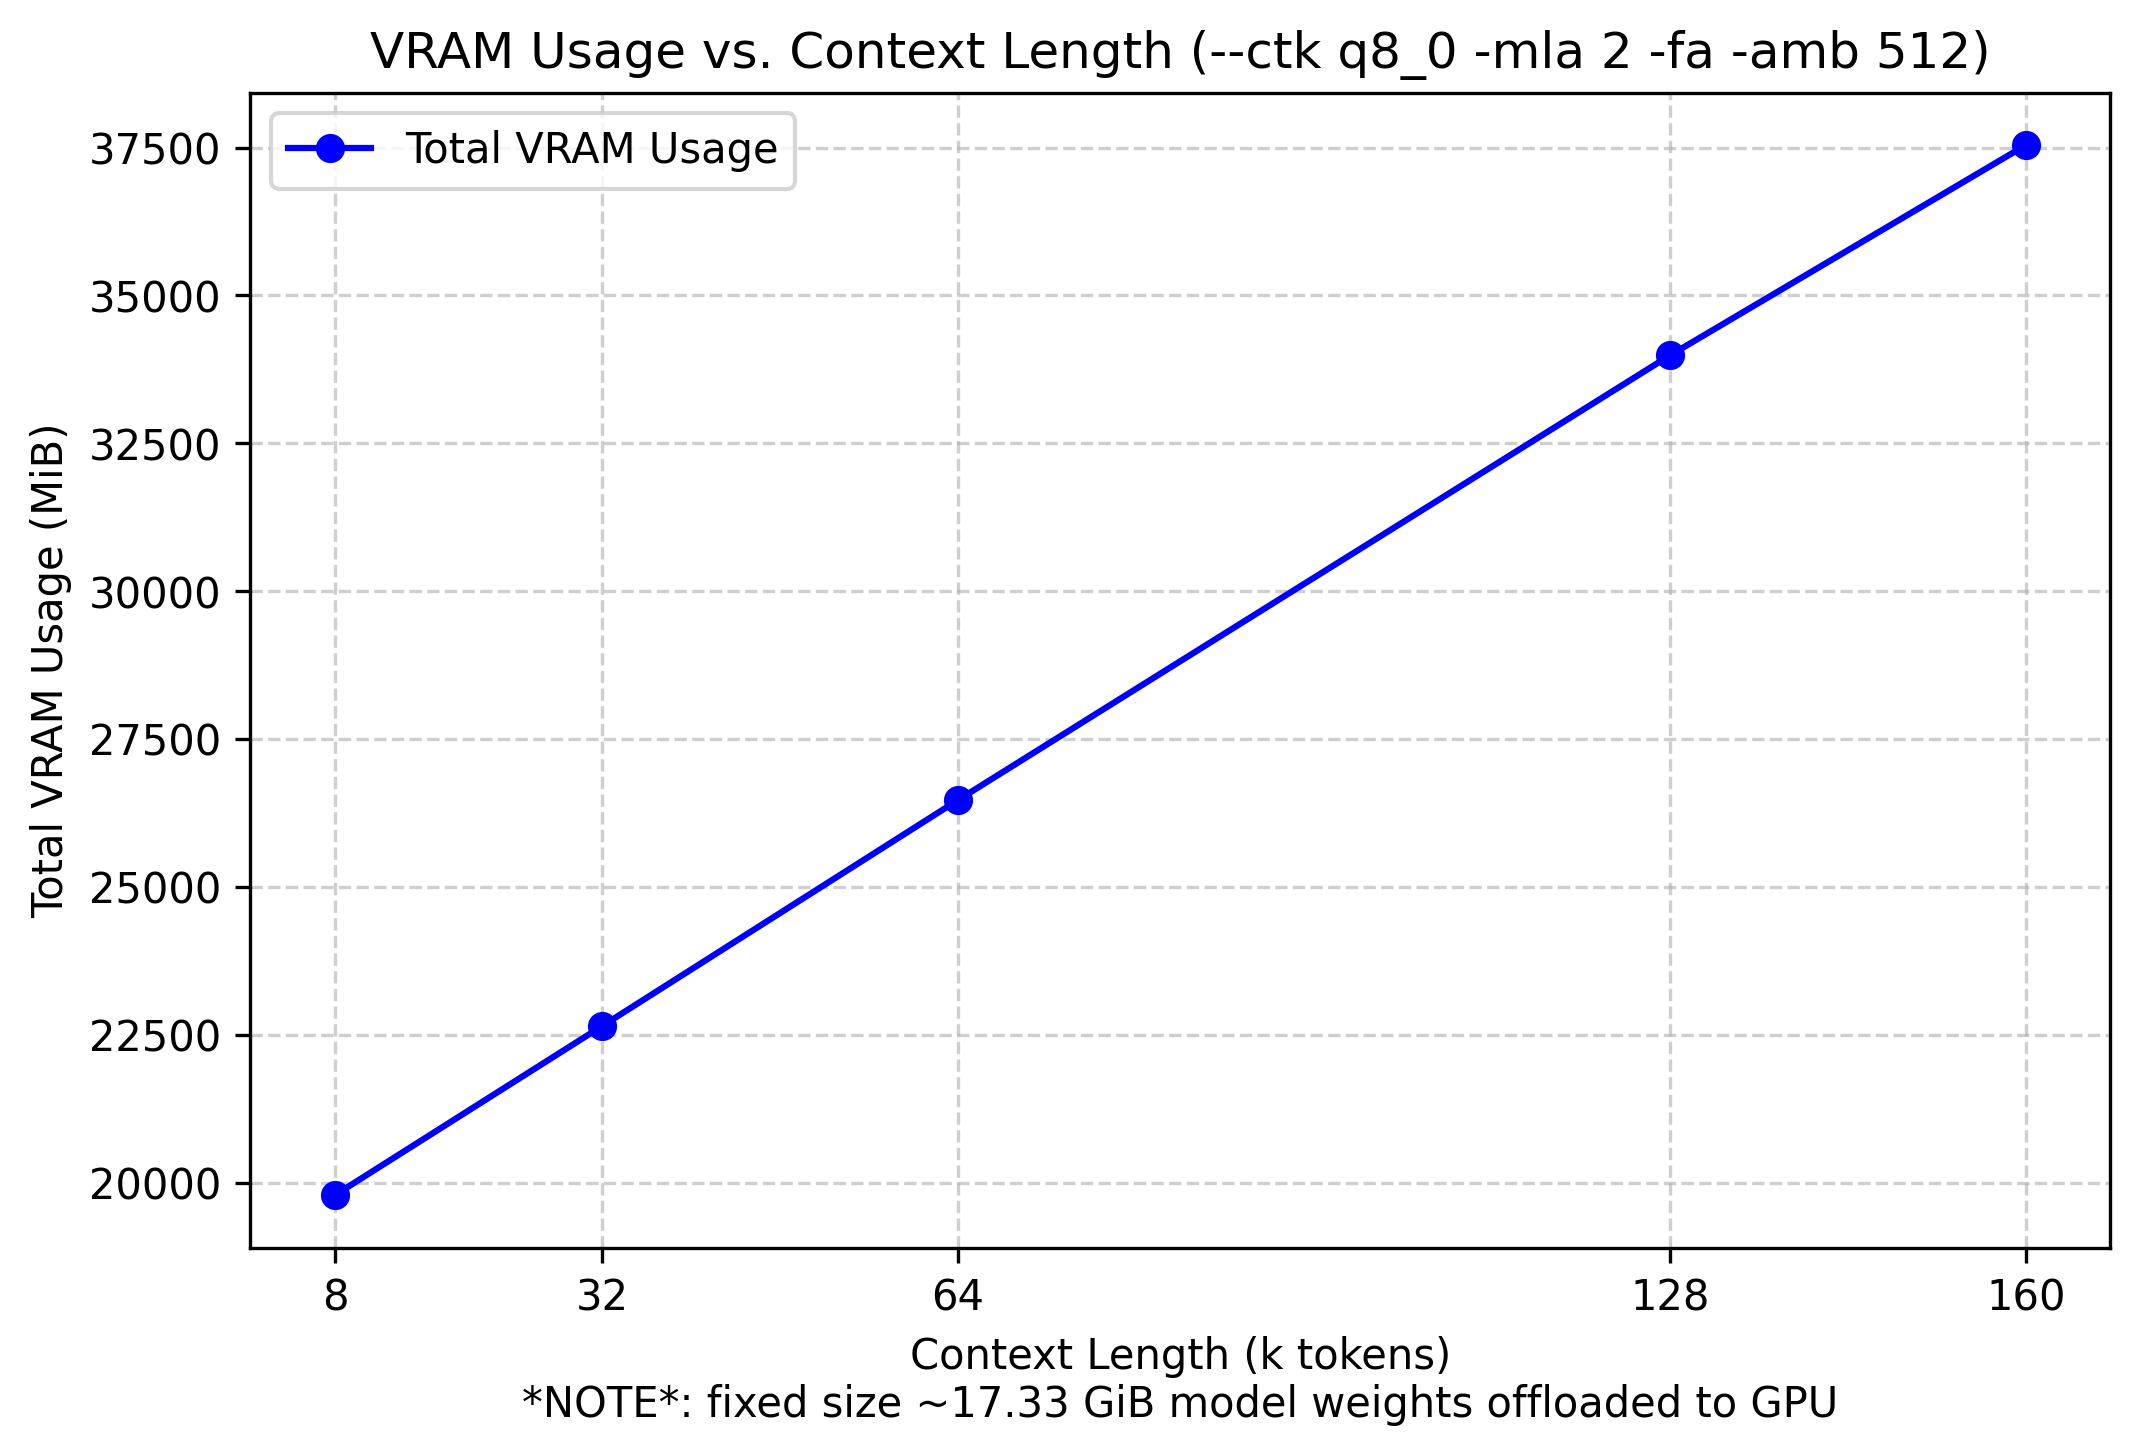
For deepseek specifically, the VRAM usage will be the amount due to offloaded tensor weights plus KV-cache that grows linearly due to MLA. For most LLMs it grows exponentially as they don’t use MLA.


I made this chart when experimenting with ubergarm/DeepSeek-V3-0324-GGUF

So this chart will vary depending on the exact model and kv-cache quantization you choose. More below.

The Deets

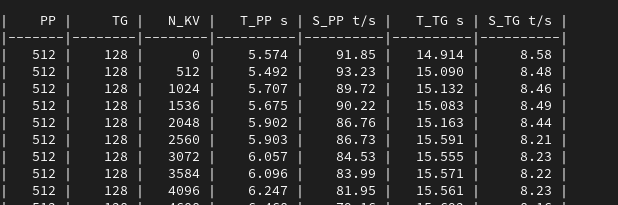
It varies widely by model, and the easiest way is to start up a few times with different settings and note the debug logs that tell you how much VRAM is being used e.g.

  1. Vary the size of the kv-cache entries e.g. -ctk f16 -ctv f16 or -ctk q8_0 -ctv q8_0 etc.
  2. Vary the context length e.g. -c 8192 and -c 16384 etc.
  3. Note the logs on startup e.g.
# for deepseek only uses `-ctk` and ignores `-ctv` as it is MLA:
llama_kv_cache_init:      CUDA0 KV buffer size =   612.02 MiB
llama_kv_cache_init:      CUDA1 KV buffer size =   554.64 MiB
llama_new_context_with_model: KV self size  = 1166.62 MiB, c^KV (q8_0): 1166.62 MiB, kv^T: not used

# for a non-MLA you'll see something like
llama_kv_cache_init:      CUDA0 KV buffer size =  5120.00 MiB
llama_new_context_with_model: KV self size  = 5120.00 MiB, K (f16): 2560.00 MiB, V (f16): 2560.00 MiB

Also is there a llama.cpp flag to tell llama.cpp on which CUDA device is should store the context?

tl;dr; I don’t know.

Notice it tells you which CUDA0/CUDA1 device has how much of the buffer assuming you are using multi-GPU config.

So I’m not sure if that can be adjusted to put all the KV-cache buffer on a single fastest GPU for example. Looking at some of the arguments available in the help:

    -sm,   --split-mode SPLIT_MODE  how to split the model across multiple GPUs, one of:
                                      - none: use one GPU only
                                      - layer (default): split layers and KV across GPUs
                                      - row: split rows across GPUs
    -ts,   --tensor-split SPLIT     fraction of the model to offload to each GPU, comma-separated list of proportions, e.g⟩
    -mg,   --main-gpu i             the GPU to use for the model (with split-mode = none),
                                    or for intermediate results and KV (with split-mode = row) (default: 0)

So I never change these settings, but maybe using -mg would do something? You could try and then observe the output logs. I’d not recommend changing -sm though. And no need to use -ts when using -ot

I swear I saw an experimental PR on mainline llama.cpp by fairydreaming perhaps to put all the kv-cache on a single GPU or on a single NUMA node or something, but it didn’t yield any gains. Ahh here is that reference

There was some more chatter about cuda device order here but don’t think it answers your question.

What are you trying to achieve by manually placing the kv-cache on one GPU or another?

3 Likes

@ubergarm Hey nice work as always! I’m waiting DeepSeek-TNG-R1T2-Chimera and see how it goes!

I was wondeirng, and this is probably a very big ask, but do you have these models at hand? I still want to compare PPL but for some reason I keep getting nans. It is mostly to see how models behave of these sizes.

DeepSeekV3 0324: Q2_K_XL (Unsloth), IQ3_XXS (Unsloth), IQ4_XS (Unsloth), IQ2_K_R4 (yours), and Q8_0 baseline (not sure if it’s out there)
DeepSeek R1 0528: Q2_K_XL (Unsloth), IQ3_XXS (Unsloth), IQ4_XS (Unsloth). You have already published the PPLs for your ones so that’s great for a comparison (IQ2_K_R4, IQ3_K_R4, Q8_0)

I can run any of these (except Q8_0s ones) and well I just want how they compare to those quant sizes, without nans. If you need any donation or similar for this I will be glad to do so.

For example, Q8_0 is 1.93% better than IQ3_K_R4 (that’s really close for that size lol) and 9.15% better than IQ2_K_R4 for R1 0528. So I wonder how it looks vs the unsloth ones.

Sorry for the long message!

2 Likes

Ran into the same issue with two 3090s but thanks to this post it was quickly resolved. Currently benchmarking DeepSeek-R1-0528-IQ3_K_R4

3 Likes

As stated by ubergram if you are offloading layers to the gpu you should be able to use the “-mg” flag. Last time I tried it didn’t work as expected but since then llama.cpp changed the way it works (before this year, when -ts 1,1 for exemple you had half the layers in each gpu + ctx on the first, now it’s more like they each have the same amount of vram used)

But you can also point llama.cpp to gpus using ```
CUDA_VISIBLE_DEVICES=X .llama-server…


Where X can be the cuda id of the gpu or multiple ids.

I am currently running Llama 3.3 70b with the unsloth quants on two 3090. Still looking for the best quant to get a larger context running on those two cards but wow is that fast. About 18t/s.

1 Like

@ubergarm Amazing work as always on quant of ubergarm/DeepSeek-TNG-R1T2-Chimera-GGUF · Hugging Face

Running on:

Fedora 41
Ryzen 7 7800X3D
192GB RAM
RTX 5090x2 (X8/X8 PCIe 5.0)
RTX 4090x2 (X4/X4 PCIe 4.0)
RTX 3090x2 (X4/X4 PCIe 4.0)
RTX A6000 (X4 PCIe 4.0)

Running with

./llama-server -m '/models_llm/DeepSeek-TNG-R1T2-Chimera-IQ3_KS-00001-of-00007.gguf' -c 16384 --no-mmap -ngl 999 \
-ot "blk.(0|1|2|3|4|5|6|7).ffn.=CUDA0" \
-ot "blk.(8|9|10|11).ffn.=CUDA1" \
-ot "blk.(12|13|14|15).ffn.=CUDA2" \
-ot "blk.(16|17|18|19|20).ffn.=CUDA3" \
-ot "blk.(21|22|23).ffn.=CUDA4" \
-ot "blk.(24|25|26).ffn.=CUDA5" \
-ot "blk.(27|28|29|30|31|32|33).ffn.=CUDA6" \
-ot "ffn.*=CPU" \
-fa -mg 0 -ub 2048 -mla 1

It supports 32k and 64k ctx without issues, but for time I did the test with 16K only.

Got

llm_load_tensors:        CPU buffer size = 129603.59 MiB
llm_load_tensors:  CUDA_Host buffer size =   607.58 MiB
llm_load_tensors:      CUDA0 buffer size = 25932.96 MiB
llm_load_tensors:      CUDA1 buffer size = 20097.95 MiB
llm_load_tensors:      CUDA2 buffer size = 20097.95 MiB
llm_load_tensors:      CUDA3 buffer size = 25154.49 MiB
llm_load_tensors:      CUDA4 buffer size = 15426.02 MiB
llm_load_tensors:      CUDA5 buffer size = 15297.82 MiB
llm_load_tensors:      CUDA6 buffer size = 35999.45 MiB
....................................................................................................
llama_new_context_with_model: n_ctx      = 16384
llama_new_context_with_model: n_batch    = 2048
llama_new_context_with_model: n_ubatch   = 2048
llama_new_context_with_model: flash_attn = 1
llama_new_context_with_model: mla_attn   = 1
llama_new_context_with_model: attn_max_b = 0
llama_new_context_with_model: fused_moe  = 0
llama_new_context_with_model: ser        = -1, 0
llama_new_context_with_model: freq_base  = 10000.0
llama_new_context_with_model: freq_scale = 0.025
llama_kv_cache_init:      CUDA0 KV buffer size =   180.00 MiB
llama_kv_cache_init:      CUDA1 KV buffer size =   126.00 MiB
llama_kv_cache_init:      CUDA2 KV buffer size =   126.00 MiB
llama_kv_cache_init:      CUDA3 KV buffer size =   162.00 MiB
llama_kv_cache_init:      CUDA4 KV buffer size =   144.00 MiB
llama_kv_cache_init:      CUDA5 KV buffer size =   126.00 MiB
llama_kv_cache_init:      CUDA6 KV buffer size =   234.00 MiB
llama_new_context_with_model: KV self size  = 1098.00 MiB, c^KV (f16): 1098.00 MiB, kv^T: not used
llama_new_context_with_model:  CUDA_Host  output buffer size =     0.49 MiB
llama_new_context_with_model: pipeline parallelism enabled (n_copies=1)
llama_new_context_with_model:      CUDA0 compute buffer size =  2735.01 MiB
llama_new_context_with_model:      CUDA1 compute buffer size =  1524.01 MiB
llama_new_context_with_model:      CUDA2 compute buffer size =  1476.01 MiB
llama_new_context_with_model:      CUDA3 compute buffer size =  1476.01 MiB
llama_new_context_with_model:      CUDA4 compute buffer size =  1476.01 MiB
llama_new_context_with_model:      CUDA5 compute buffer size =  1476.01 MiB
llama_new_context_with_model:      CUDA6 compute buffer size =  1476.02 MiB
llama_new_context_with_model:  CUDA_Host compute buffer size =   184.02 MiB
llama_new_context_with_model: graph nodes  = 3542
llama_new_context_with_model: graph splits = 367

main: n_kv_max = 16384, n_batch = 2048, n_ubatch = 2048, flash_attn = 1, n_gpu_layers = 999, n_threads = 8, n_threads_batch = 8

|    PP |     TG |   N_KV |   T_PP s | S_PP t/s |   T_TG s | S_TG t/s |
|-------|--------|--------|----------|----------|----------|----------|
|  2048 |    512 |      0 |   10.472 |   195.56 |   61.475 |     8.33 |
|  2048 |    512 |   2048 |   10.906 |   187.79 |   61.989 |     8.26 |
|  2048 |    512 |   4096 |   11.650 |   175.80 |   62.586 |     8.18 |
|  2048 |    512 |   6144 |   12.380 |   165.43 |   63.525 |     8.06 |
|  2048 |    512 |   8192 |   13.099 |   156.35 |   64.193 |     7.98 |
|  2048 |    512 |  10240 |   13.842 |   147.95 |   64.489 |     7.94 |
|  2048 |    512 |  12288 |   14.564 |   140.62 |   65.574 |     7.81 |
|  2048 |    512 |  14336 |   15.314 |   133.73 |   65.829 |     7.78 |

Model itself is pretty good, and a good amount faster than other IQ3 quants. I could load 1 layer extra on the A6000 and get a bit bit more speed. Also can increase ub a bit but it is quite at the limit.

2 Likes

I guess you’ll find @ubergarm and maybe others at BeaverAI Club Discord :slight_smile: Spotted from last huggingface links @Panchovix posted.

edit: I’d be interested in a zoom but might not have the time to gather people and coordinate.

1 Like

@Panchovix

Thanks for testing the new quants and glad they are working out for you both in terms of speed and quality!

A lot of thoughts here.

First, if you are seeing nan while calculating perplexity that generally means there is a problem caused by some kind of numerical instability issue. It is possible to have a clean perplexity run using the CPU only backend, but then see nan when using CUDA as each backend implementation takes a different code path. A few reasons this might be happening:

  1. Implementation issue that requires more accurate accumulator during inferencing. ik and I will try to check for this before merging code into main, I’ve only seen it occasionally around DeepSeek MLA and the GLM4 model I did which we fixed before releasing.
  2. Bad download (check the sha256sum of all the gguf parts against what huggingface says). Usually you’ll see all DDDD or nan immediately with this issue.
  3. Forgot to compile with -DGGML_CUDA_IQK_FORCE_BF16=1 which is required for ik_llama.cpp when running DeepSeek arch models to prevent overflow of the usual FP16 accumulator.

FP16 has a narrower range of representable values than FP32, TF32, and BF16, making it more susceptible to overflow. FP16’s 5-bit exponent limits its maximum value to 65,504, whereas FP32, TF32, and BF16 use an 8-bit exponent, offering a broader range. Overflow in FP16 results in Inf (infinity) values, which can propagate errors and lead to NaN (not-a-number) values, severely degrading model accuracy.
Accuracy Considerations — NVIDIA TensorRT Documentation

I too am curious to compare the perplexity/kld scores of some more of these other models with my own. In general in my own testing, the quant recipes I have using ik_llama.cpp tend to score better on perplexity than similar size mainline quants. Keep in mind ik wrote pretty much all the quants that mainline still uses (except the og q8_0 and q4_1 stuff), so his new quants are higher quality and he’s working all the time on improving PP speeds as you know. TG speeds are generally memory bandwidth bound, so better quality in smaller size is the only way to help there.

I have not measured all of the quants you listed, but have measured some. I’ll DM u with some info on that and perhaps if you can figure out the nan issue you can take some more measurements to add to what I know.

Dual 3090s is a really nice size for fully offloaded dense 70B’s yeah. What size quant are you running currently? You can go with -ctk q8_0 -ctv q8_0 to get more context at half the size of full fp16 without much penalty in quality. But given standard attention models kv-cache grows exponentially it is hard to get a huge context. Most models don’t do super well past 40k anyway in my own experience.

You might be able to increase PP speed by increasing batch size too e.g. -ub 2048.

Yeah I’m on that discord, feel free to at me or dm me on there and eventually I’ll check in and find it!

1 Like