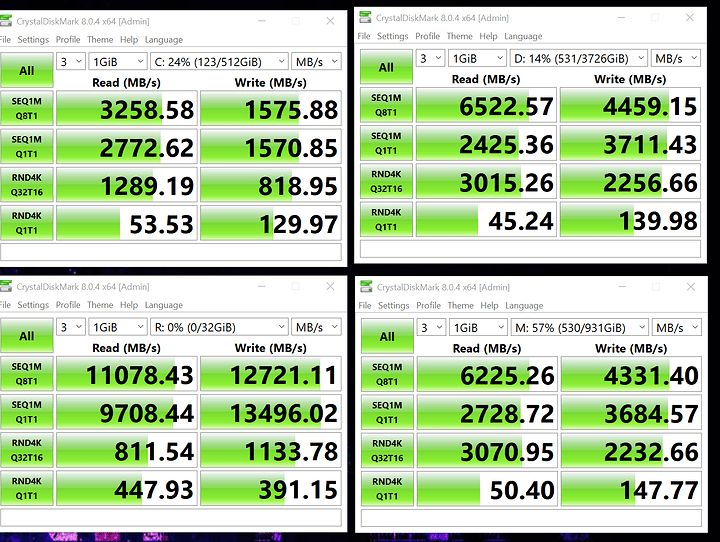
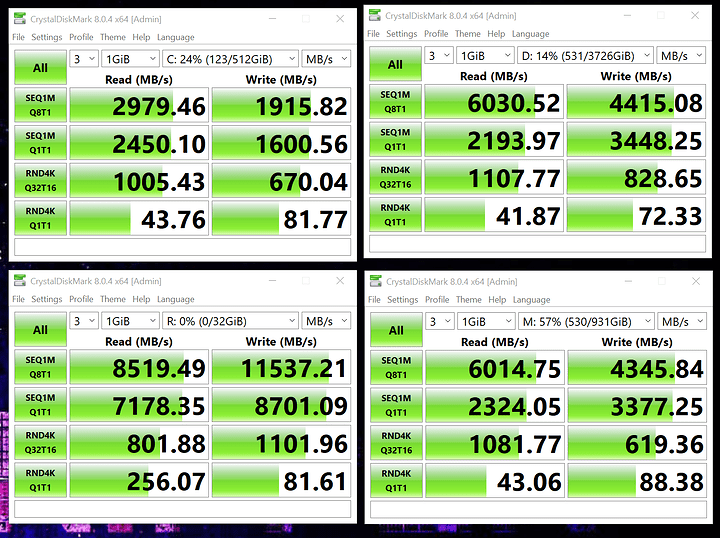
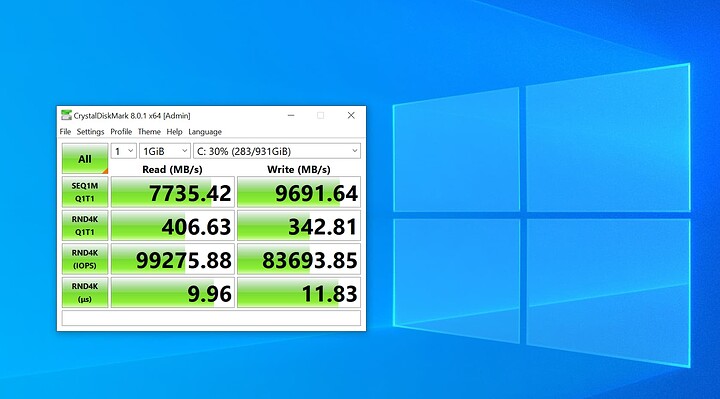
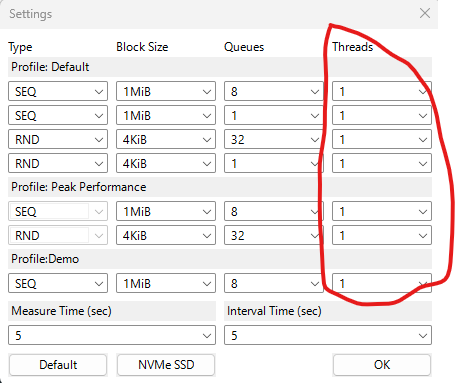
So, I’ve run a couple quick benchmarks on some drives just to experiment with them, but I’m not entirely sure how to interpret the results. In particular, I’m curious about the variation in relative speeds from test to test (frankly, I don’t have a full understanding on what each benchmark is exactly doing compare to each other, only sequential vs. random. And still I don’t know all the determinants of performance in each). Hence, I thought I may ask the hive mine for its thoughts.
The drives tested:
- C: a 1TB PCIe 3.0x4 SSD
- D: a 4TB PCIe 3.0x8 SSD (truly a RAID0 PCIe x8 AIC)
- M: a 1TB PCIe 3.0x8 SSD (truly a RAID0 PCIe x8 AIC)
- R: a 32GB RAM disk
I did two sets of benchmarks:
- Run all benchmarks for each drive, one drive at a time
- Run all benchmarks for all drives simultaneously
The benchmarks themselves are the 4 test CrystalDiskMark defaults to when freshly installed. The point of the second test is to potentially trigger bottlenecks elsewhere, such as the CPU’s I/O, memory or whatever.
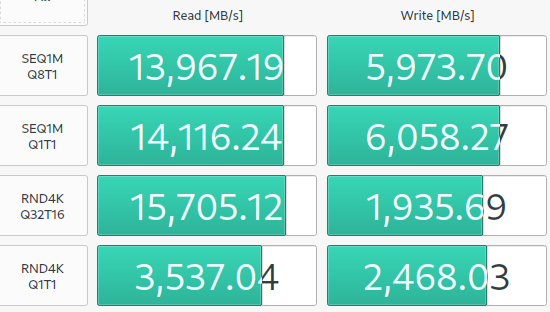
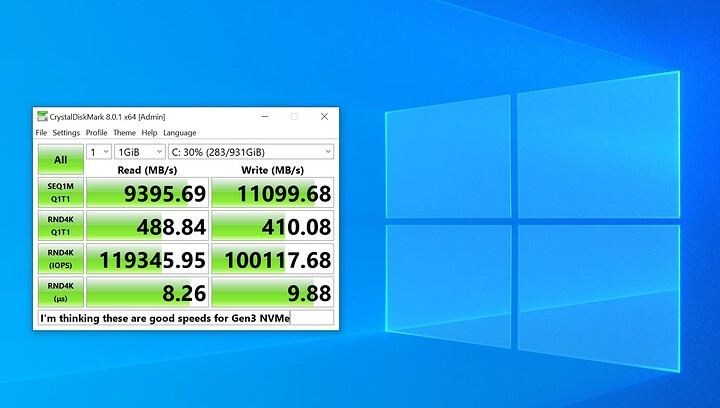
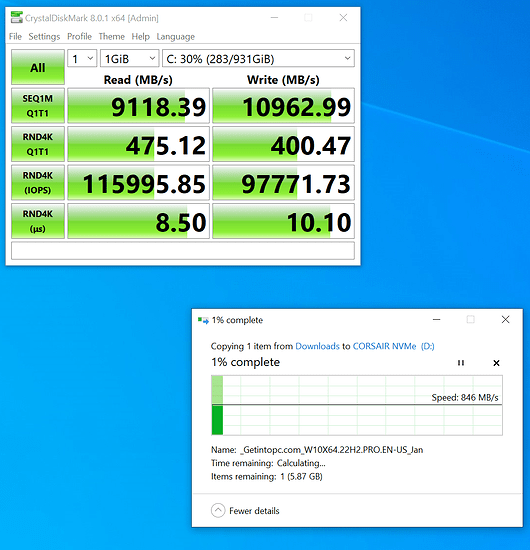
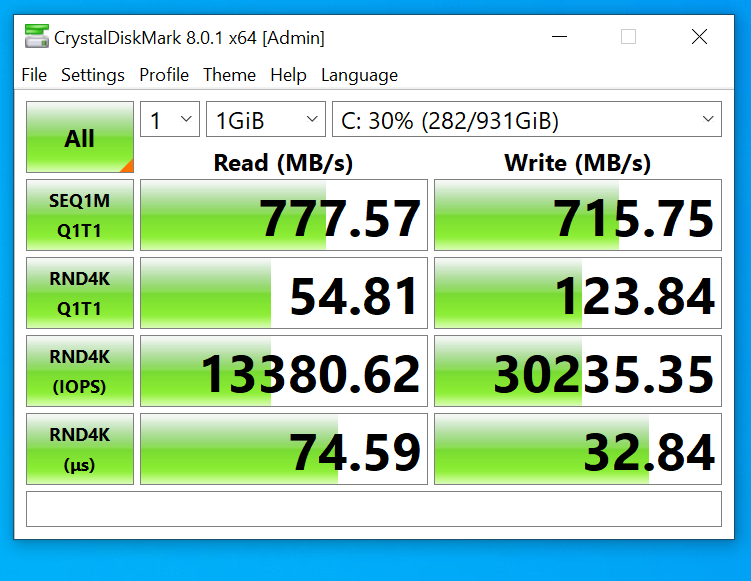
These are the results:
Sequential:
Parallel:
Some results are boring (RAM > PCIe x8 > PCIe x4), but some made me wonder about the nature of the test and the determinants of drive performance, such as:
- The RAM disk is faster than the SSDS except the RND4K Q32T16 benchmark, where it turns to be the slowest reader.
- Most benchmark scores fall when running all drives simultaneously, but SEQ1M Q1T1 seems unaffected for the SSDs (the RAM disk still suffers)
- On the other hand, RND4K Q32T16 is unaffected for the RAM drive, while it’s the test where the PCIe x8 SSd suffered the most from running simultaneously.
- For RNDK Q1T1, only being RAM helps, the other drives show no significant difference.
So, what do you make of these? Is there anything else that draws your attention?
