I have a number of Ubuntu/Debian based network clients. Some based off diskless network boot, some hosting hypervisors.
What I’d like to do is find package software that is relatively simple to use for monitoring the resources available/in use by the cluster.
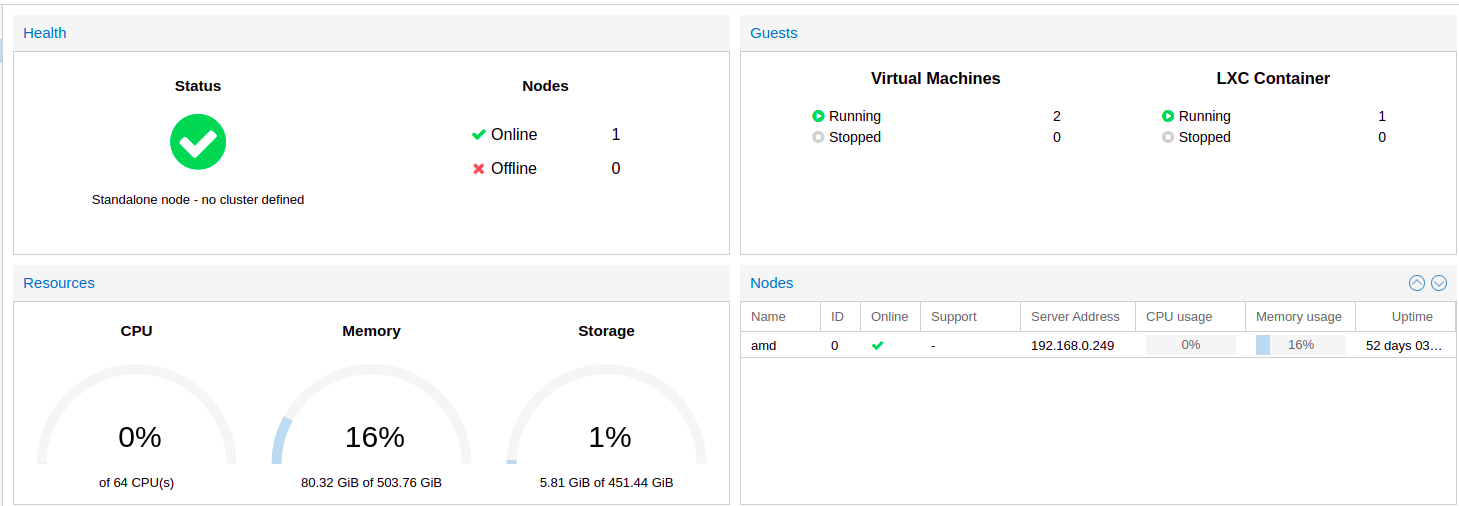
If that doesn’t make sense I’m looking for something similar to what PROXMOX or VMware vCenter use to display online/offline network nodes and cumulative resources like network wide number of CPUs/RAM/Storage/etc.
I’m fine with CLI or WebUI solutions if any packages exist for either. Every node is running Ubuntu/Ubuntu Server so I should be able to install client software to all of them and monitor their status from one location.
Yeah Webmin was a little outside the scope of what I was looking for. I found something a little better though I’ll admit it’s still not exactly what I wanted. Cockpit. Would you happen to be familiar with it?
I remember learning about it when I was researching VFIO and GPU pass-through. It doesn’t display “datacenter” wide resource count but it does provide graphs for each client’s utilization and online/offline status. Similar to Webmin but a little more what I was looking for. Will likely stick with it since the setup was fairly easy minus a handful of hickups.
Do you plan to monitor their resources individually on each system? Then something like Monit or other local monitoring software, like
traffic_totals or vnstat may be worth checking.
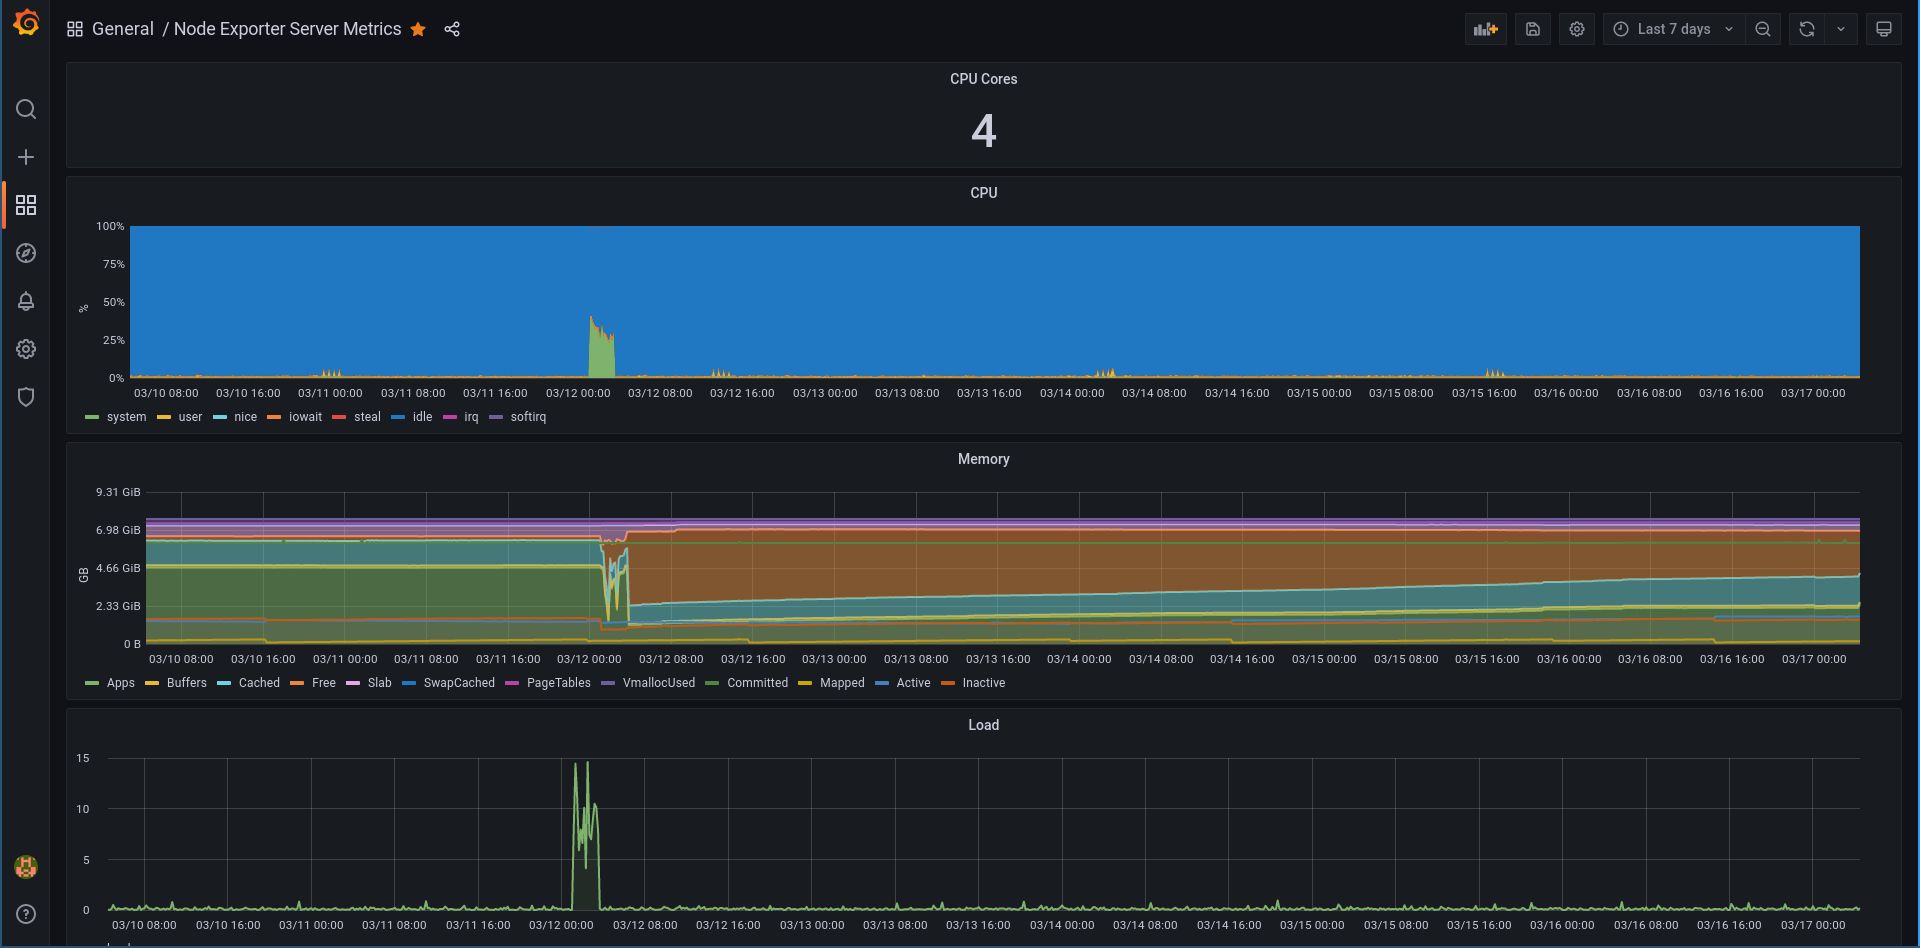
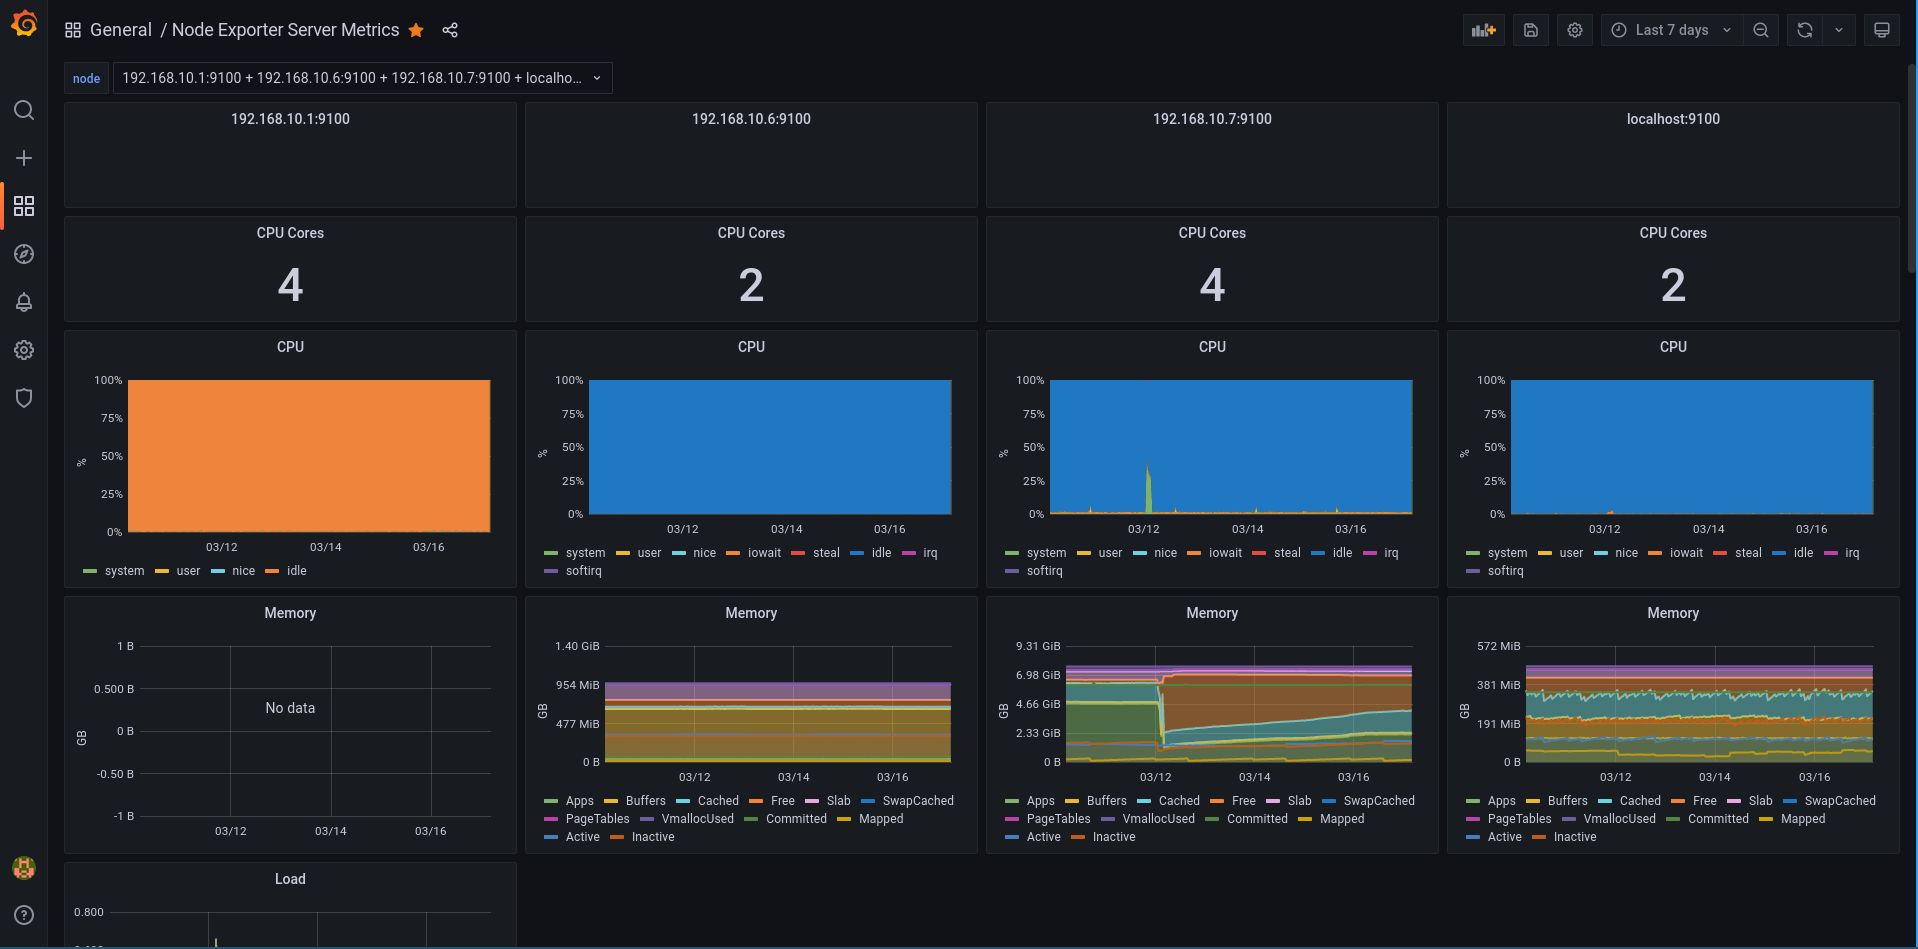
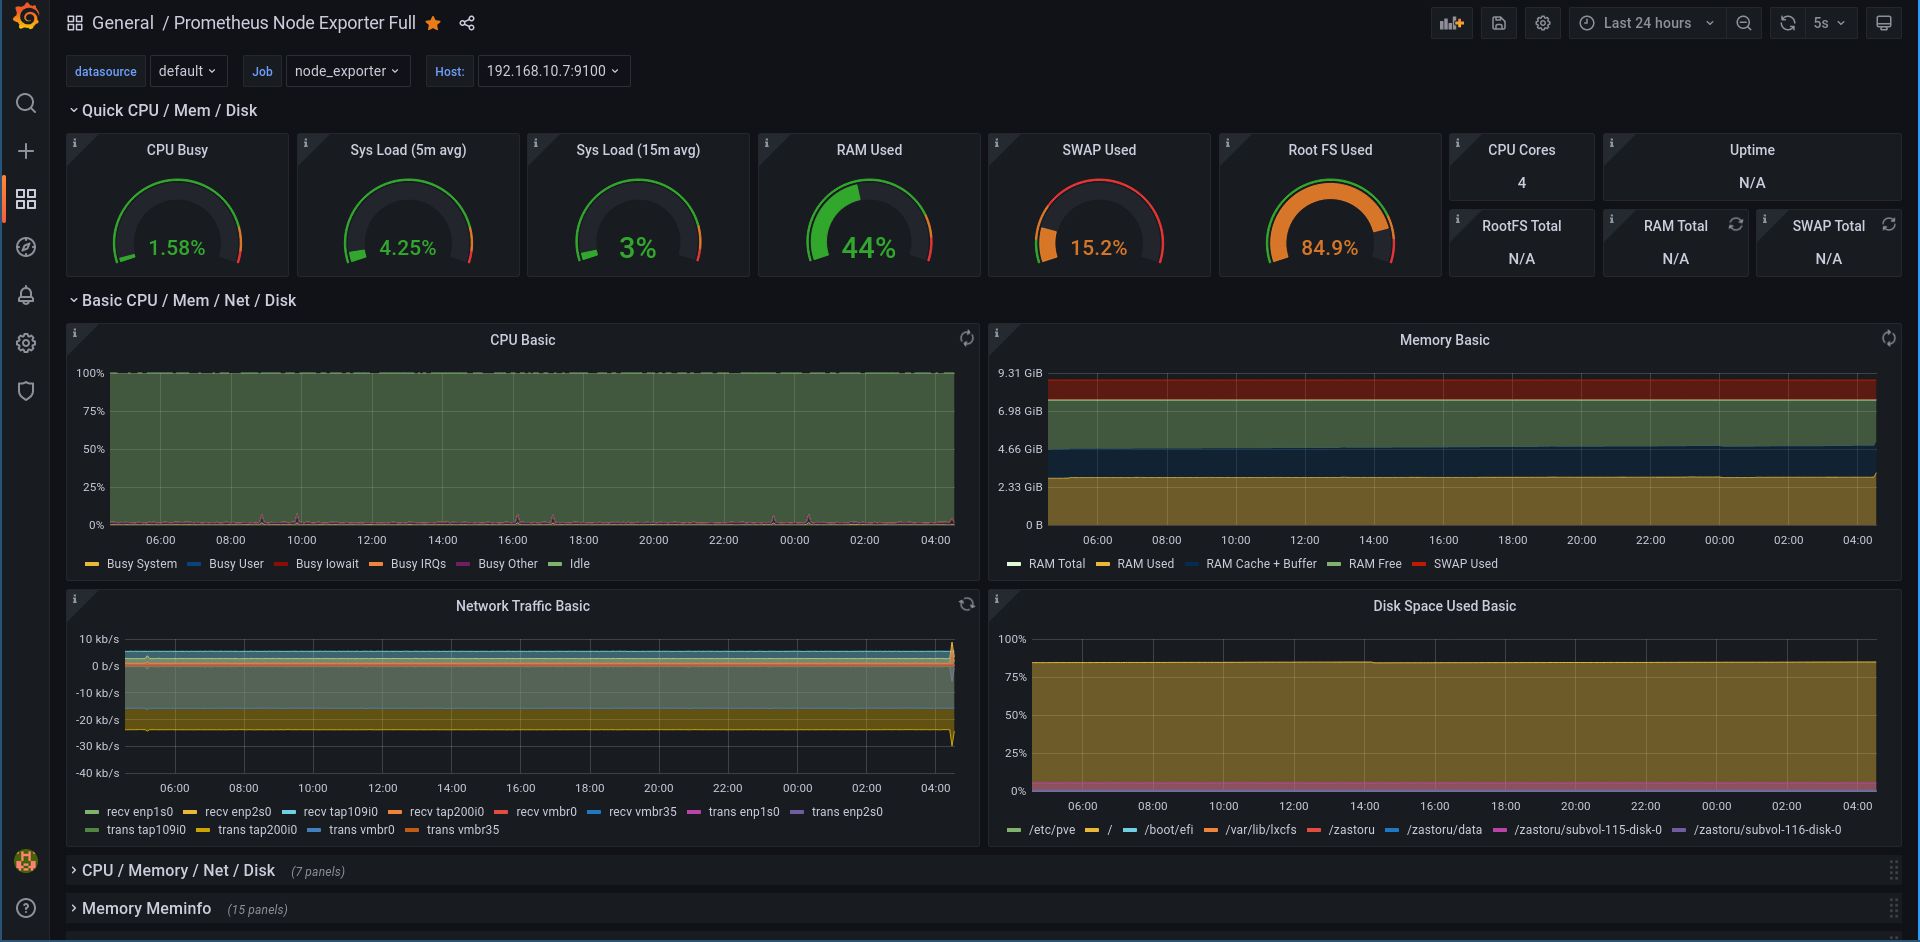
My recommendation would be to install (prometheus) node-exporter / node_exporter and set a prometheus+grafana server to see all the stats in a nice GUI. Takes about 1 hour if you don’t know what you’re doing (and about 15 if you know). Here’s what a graph for a single server looks like:
Cockpit is more like a management interface than anything else. You can have graphs and statistics, but it’s not really its purpose.
You want a NMS (network monitoring system). Prometheus combined with Grafana is a good choice. An alternative would be Zabbix or Centreon. They are a bit harder to setup than Prometheus and Grafana, IMO.
but I don’t want to install hypervisors on everything because that would double the number of IP’s I have to juggle + installing localized storage instead of booting them all off the network which I like quite a bit more.
When I do find the time I’ll investigate Prometheus + Grafana. I’ve never head or worked with them before so I’ll make some LXC Containers and test it out before committing to implementing it. I may follow up with some questions if I run into issues.