If you’re here your interested in Finite Element Analysis, how fast your computer is, or in different µarch and BLAS performance. Here’s the background you’ll need to know to run the benchmark(s):
The benchmarks are very easy to run and do not require any special knowledge of FEA or computer science.
There are three different benchmarks:
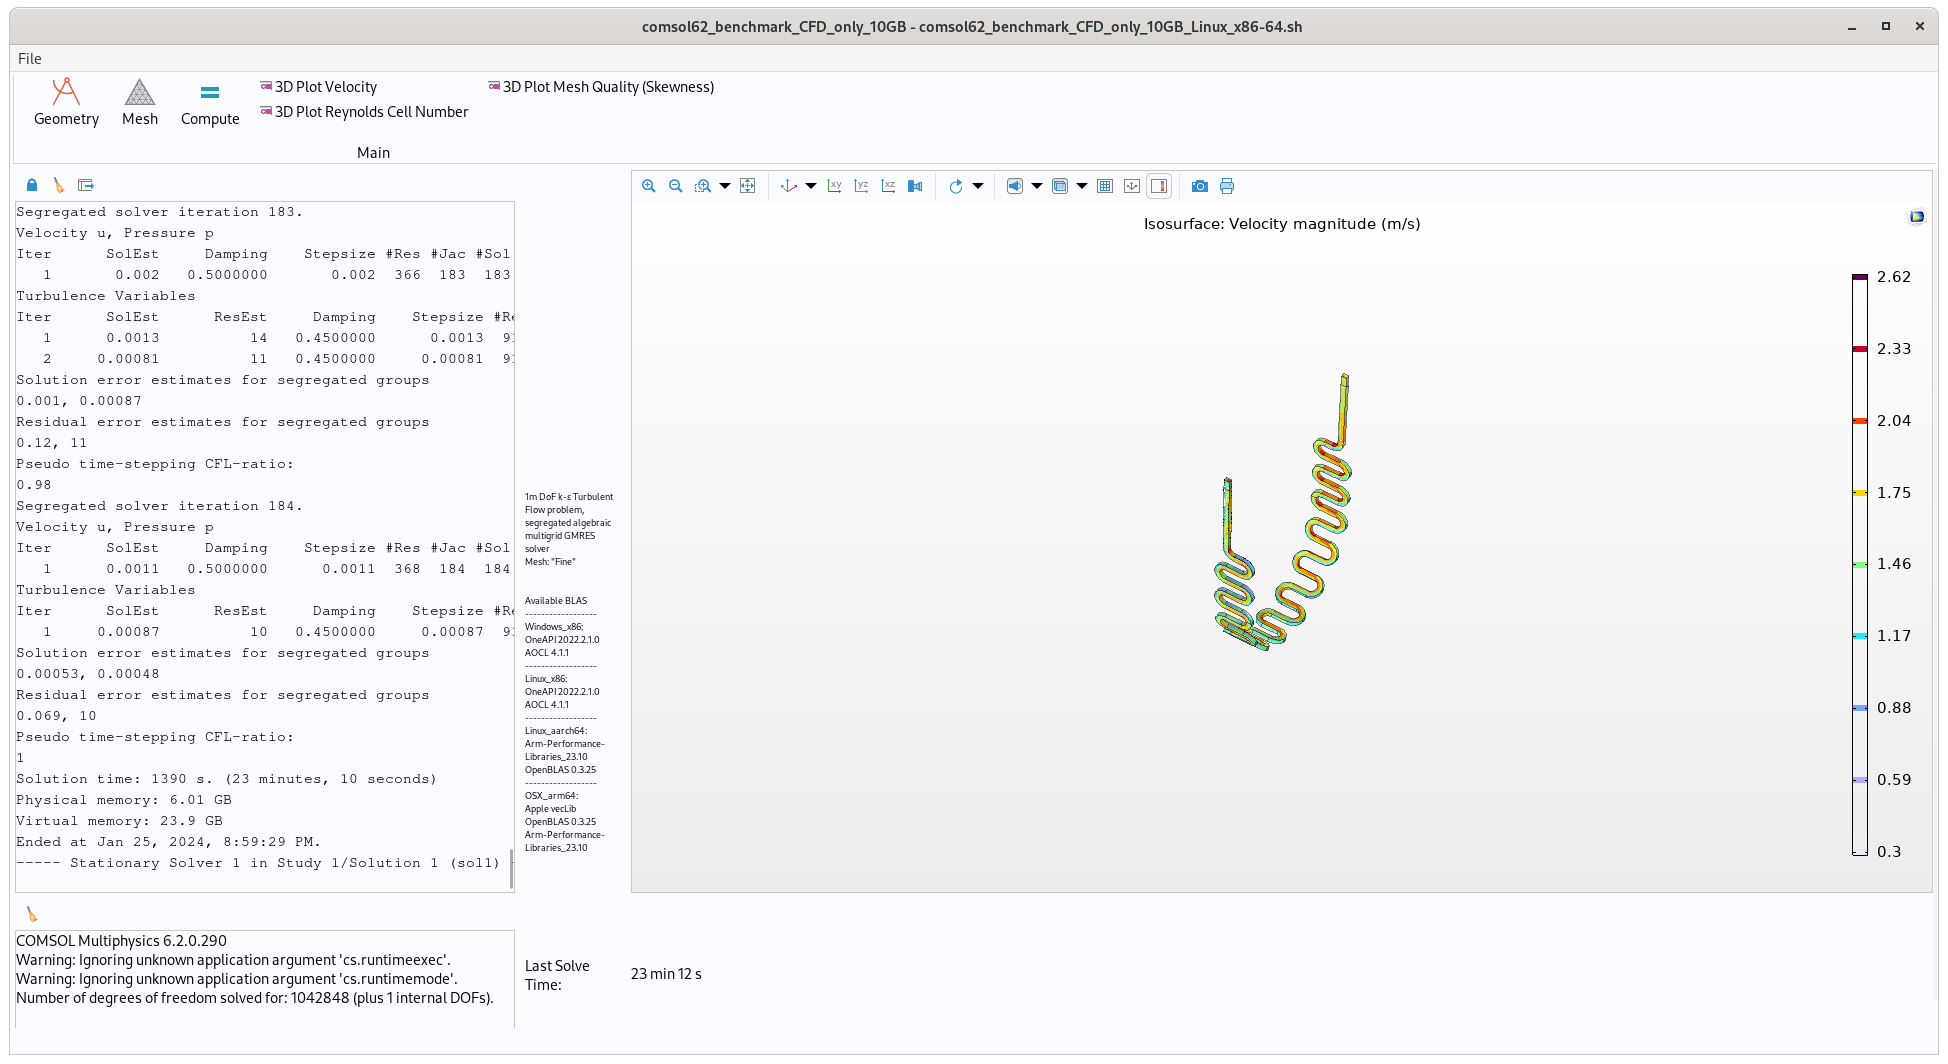
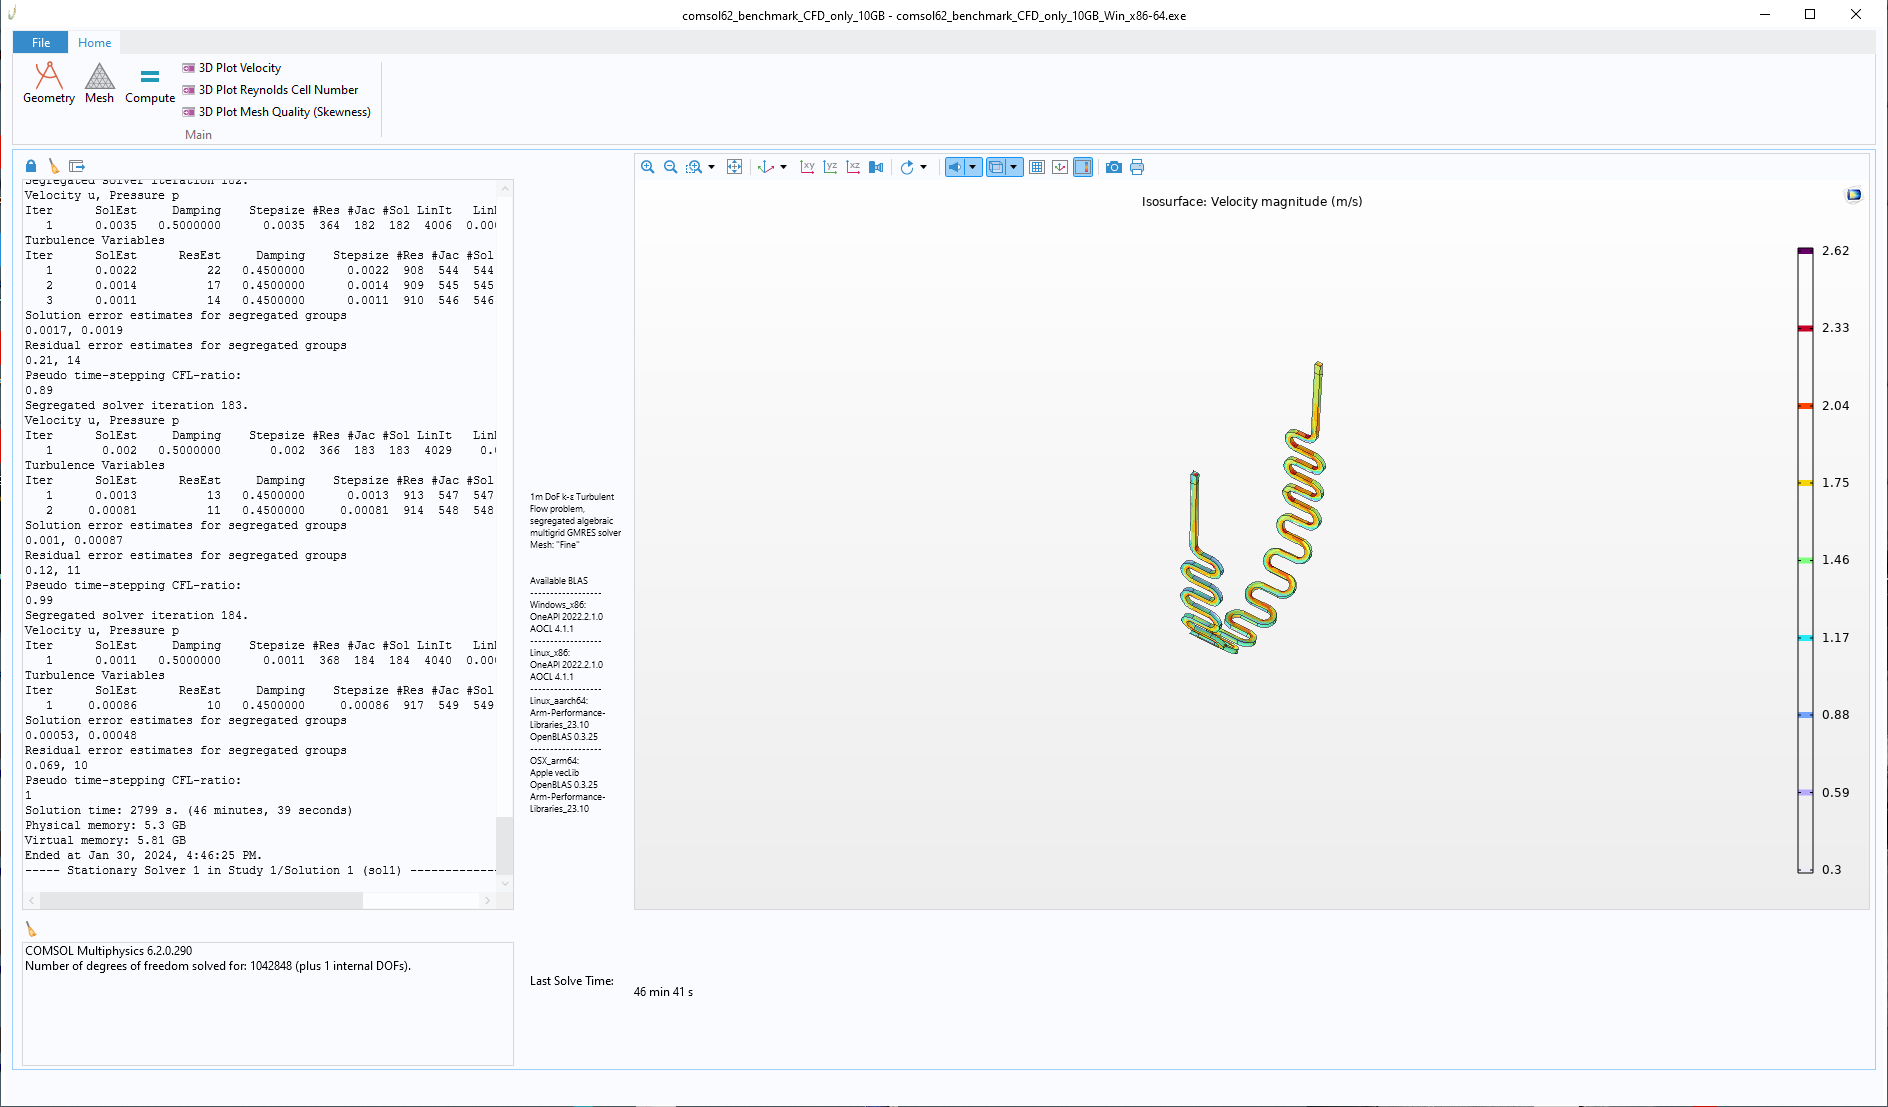
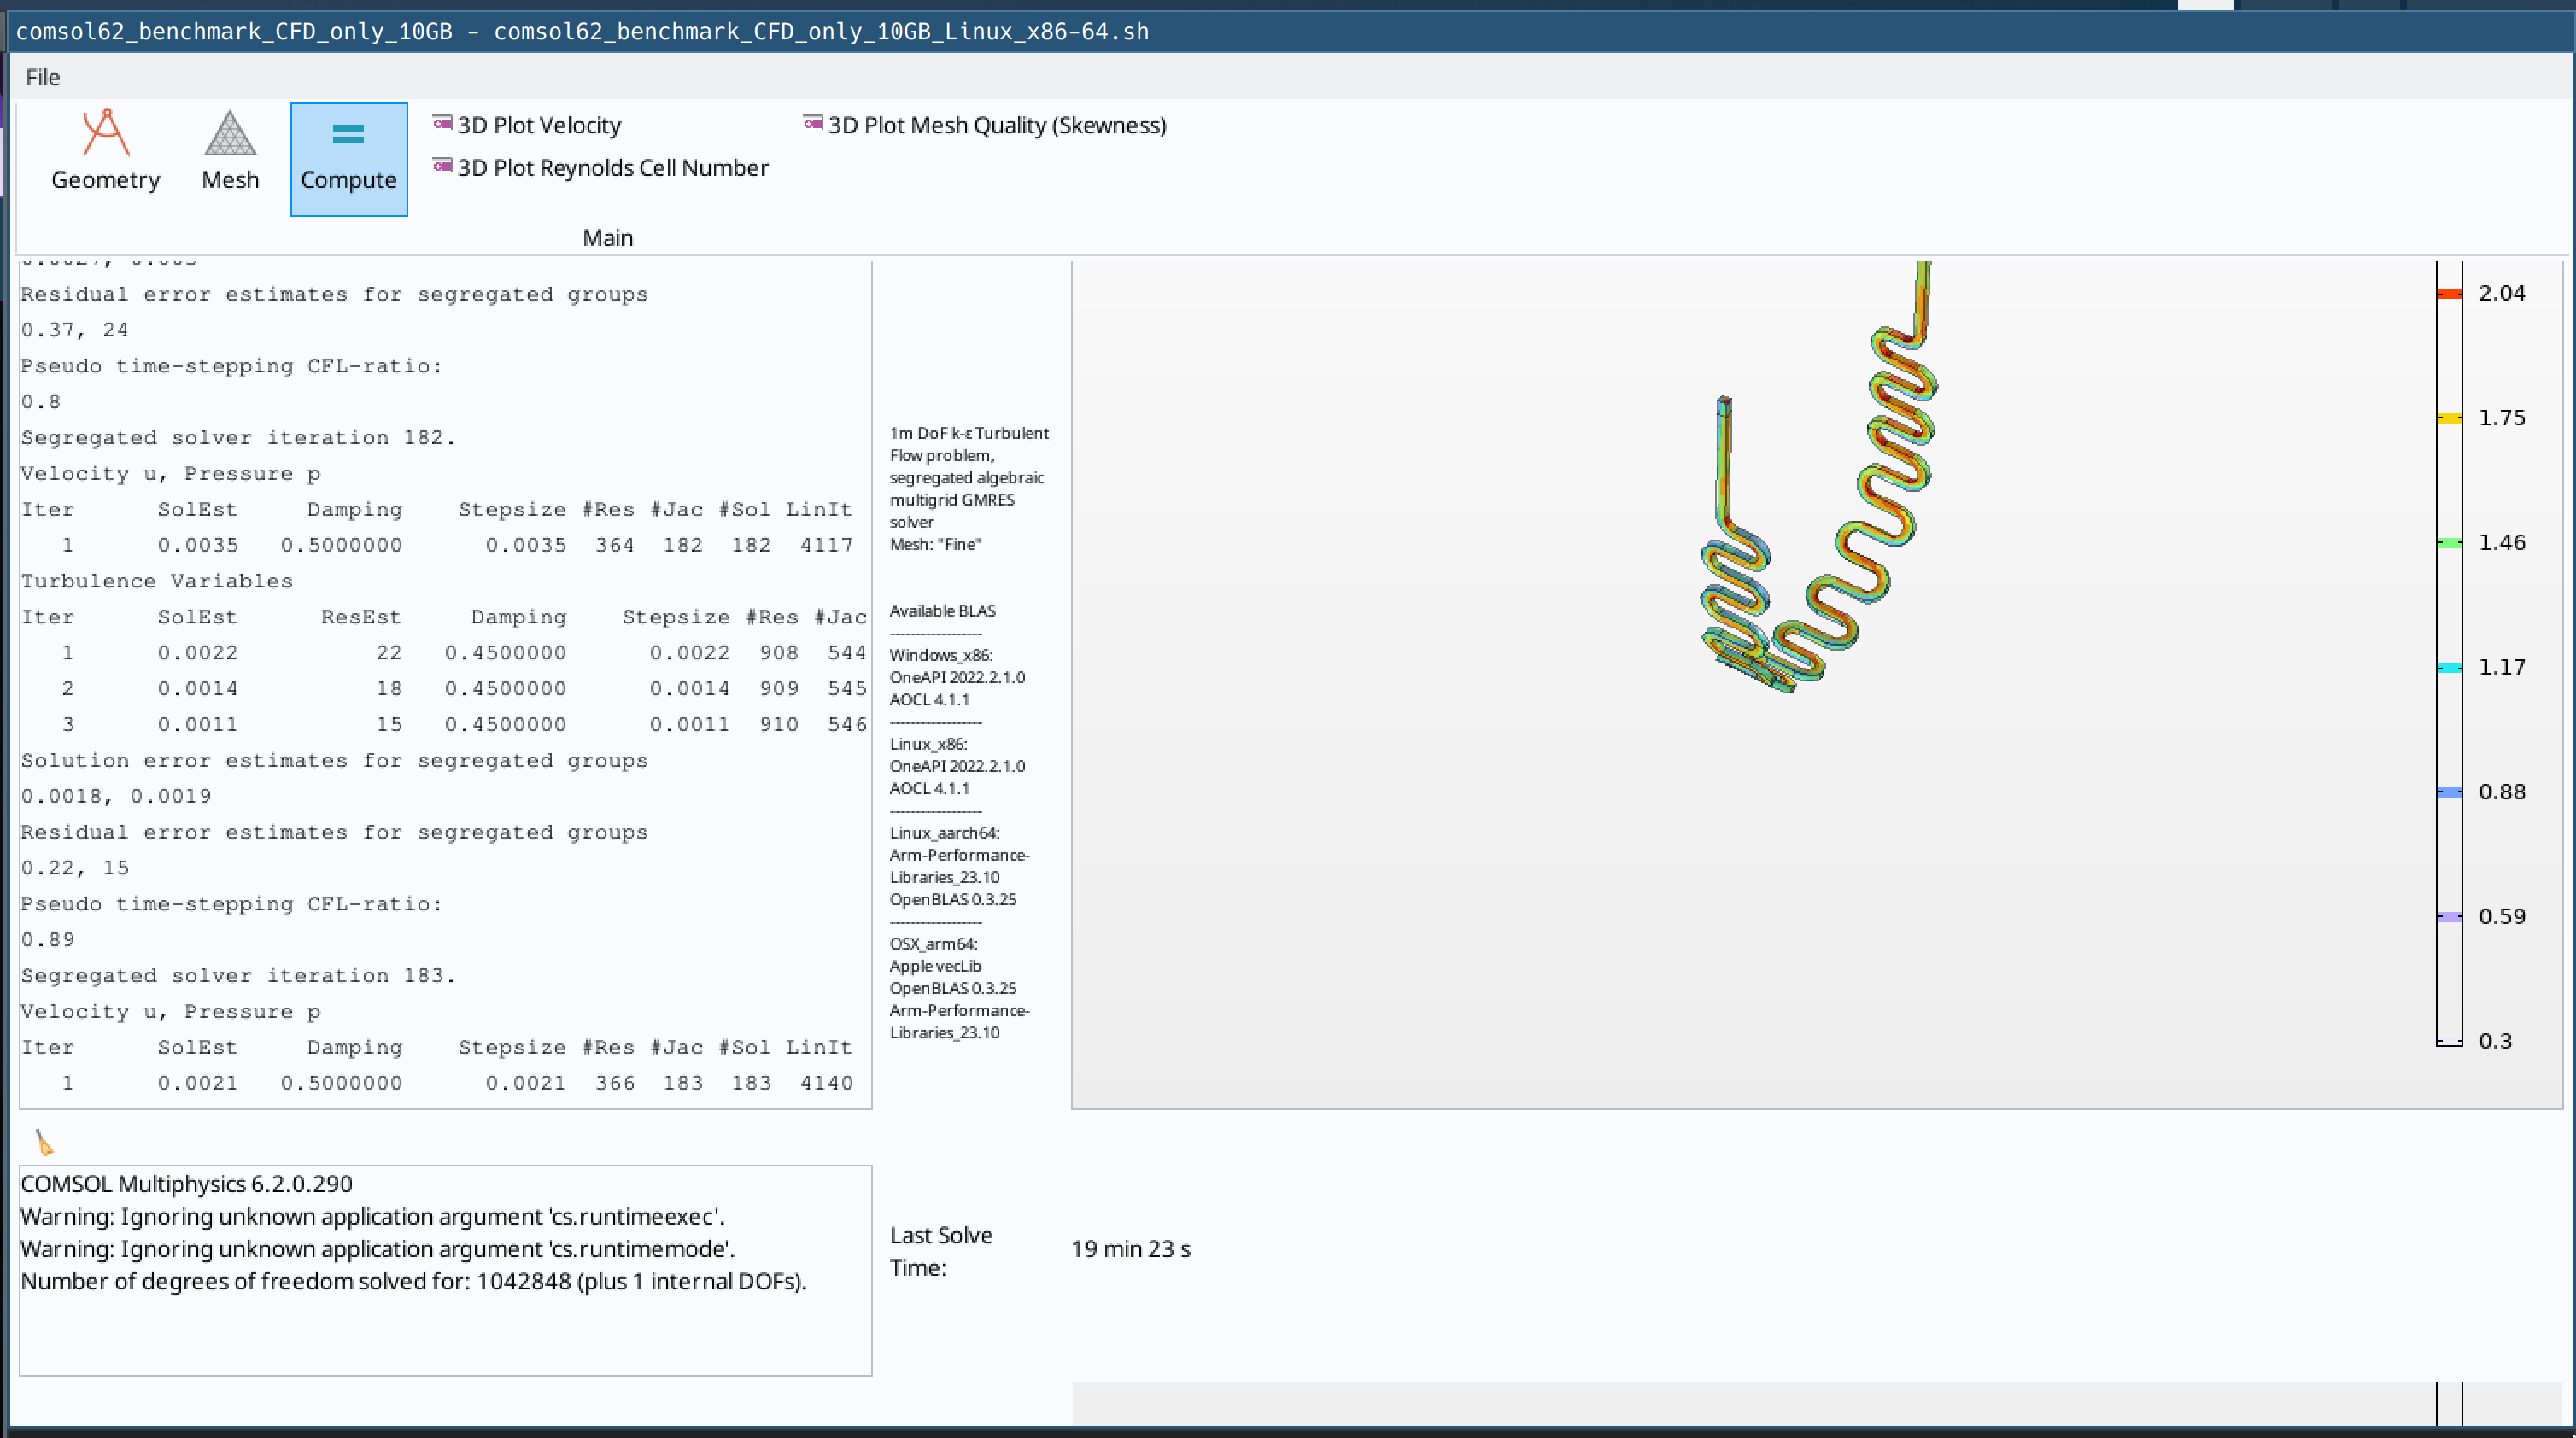
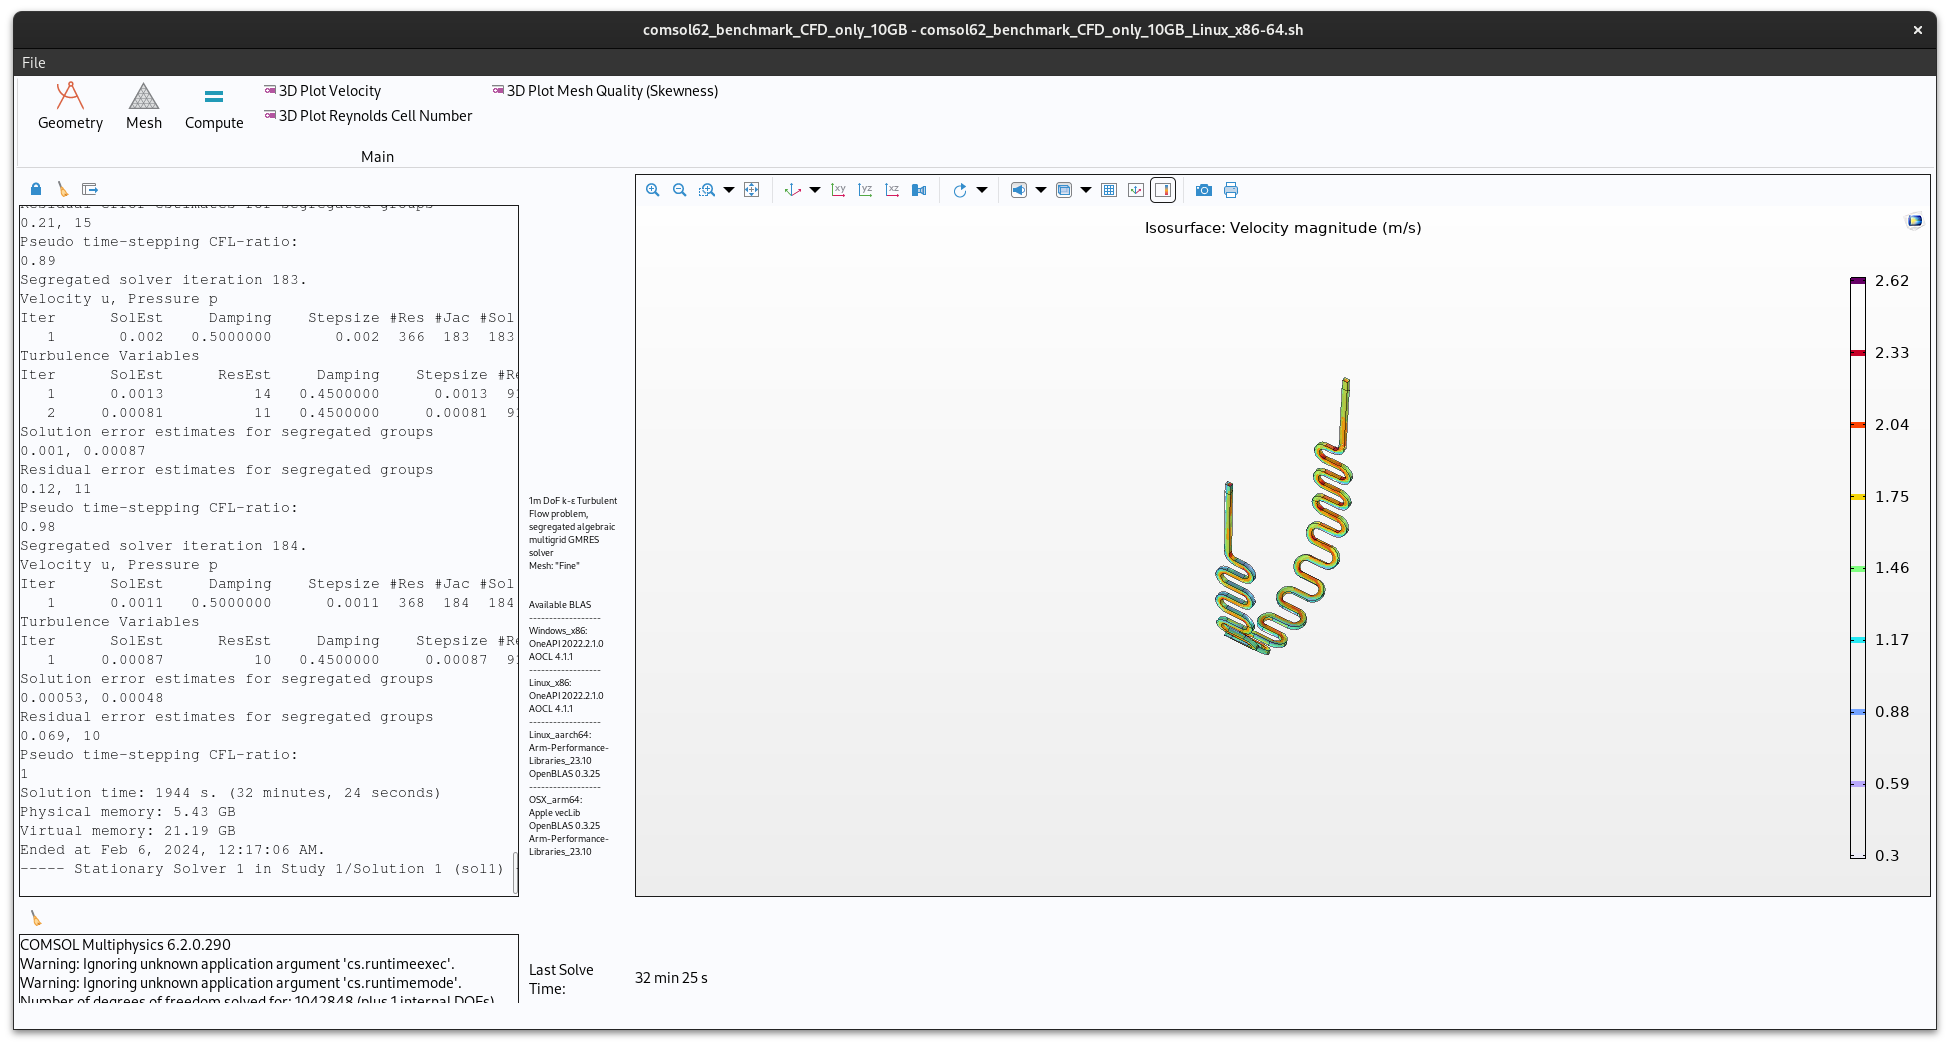
CFD-only model that uses very little RAM but lots of CPU resources. Run time on fast computer ~23 minutes using 10GB of memory
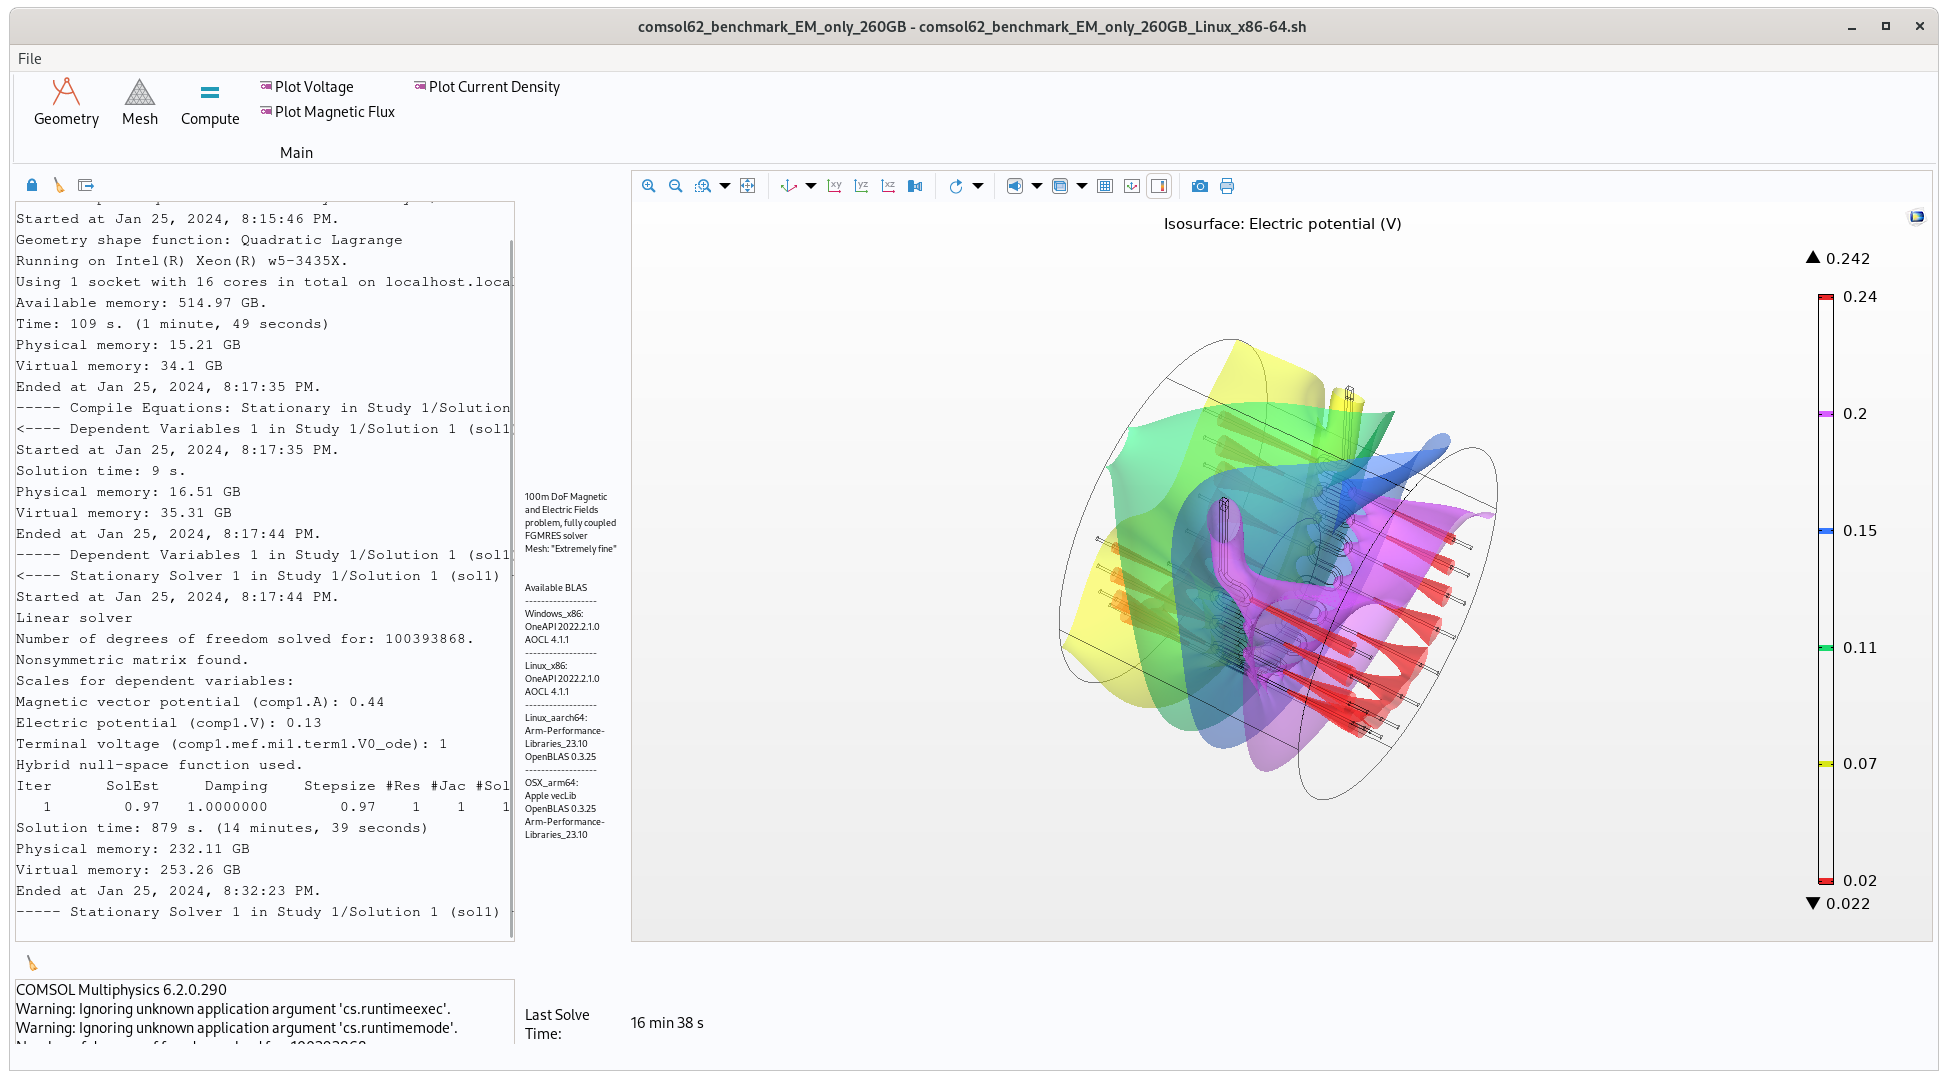
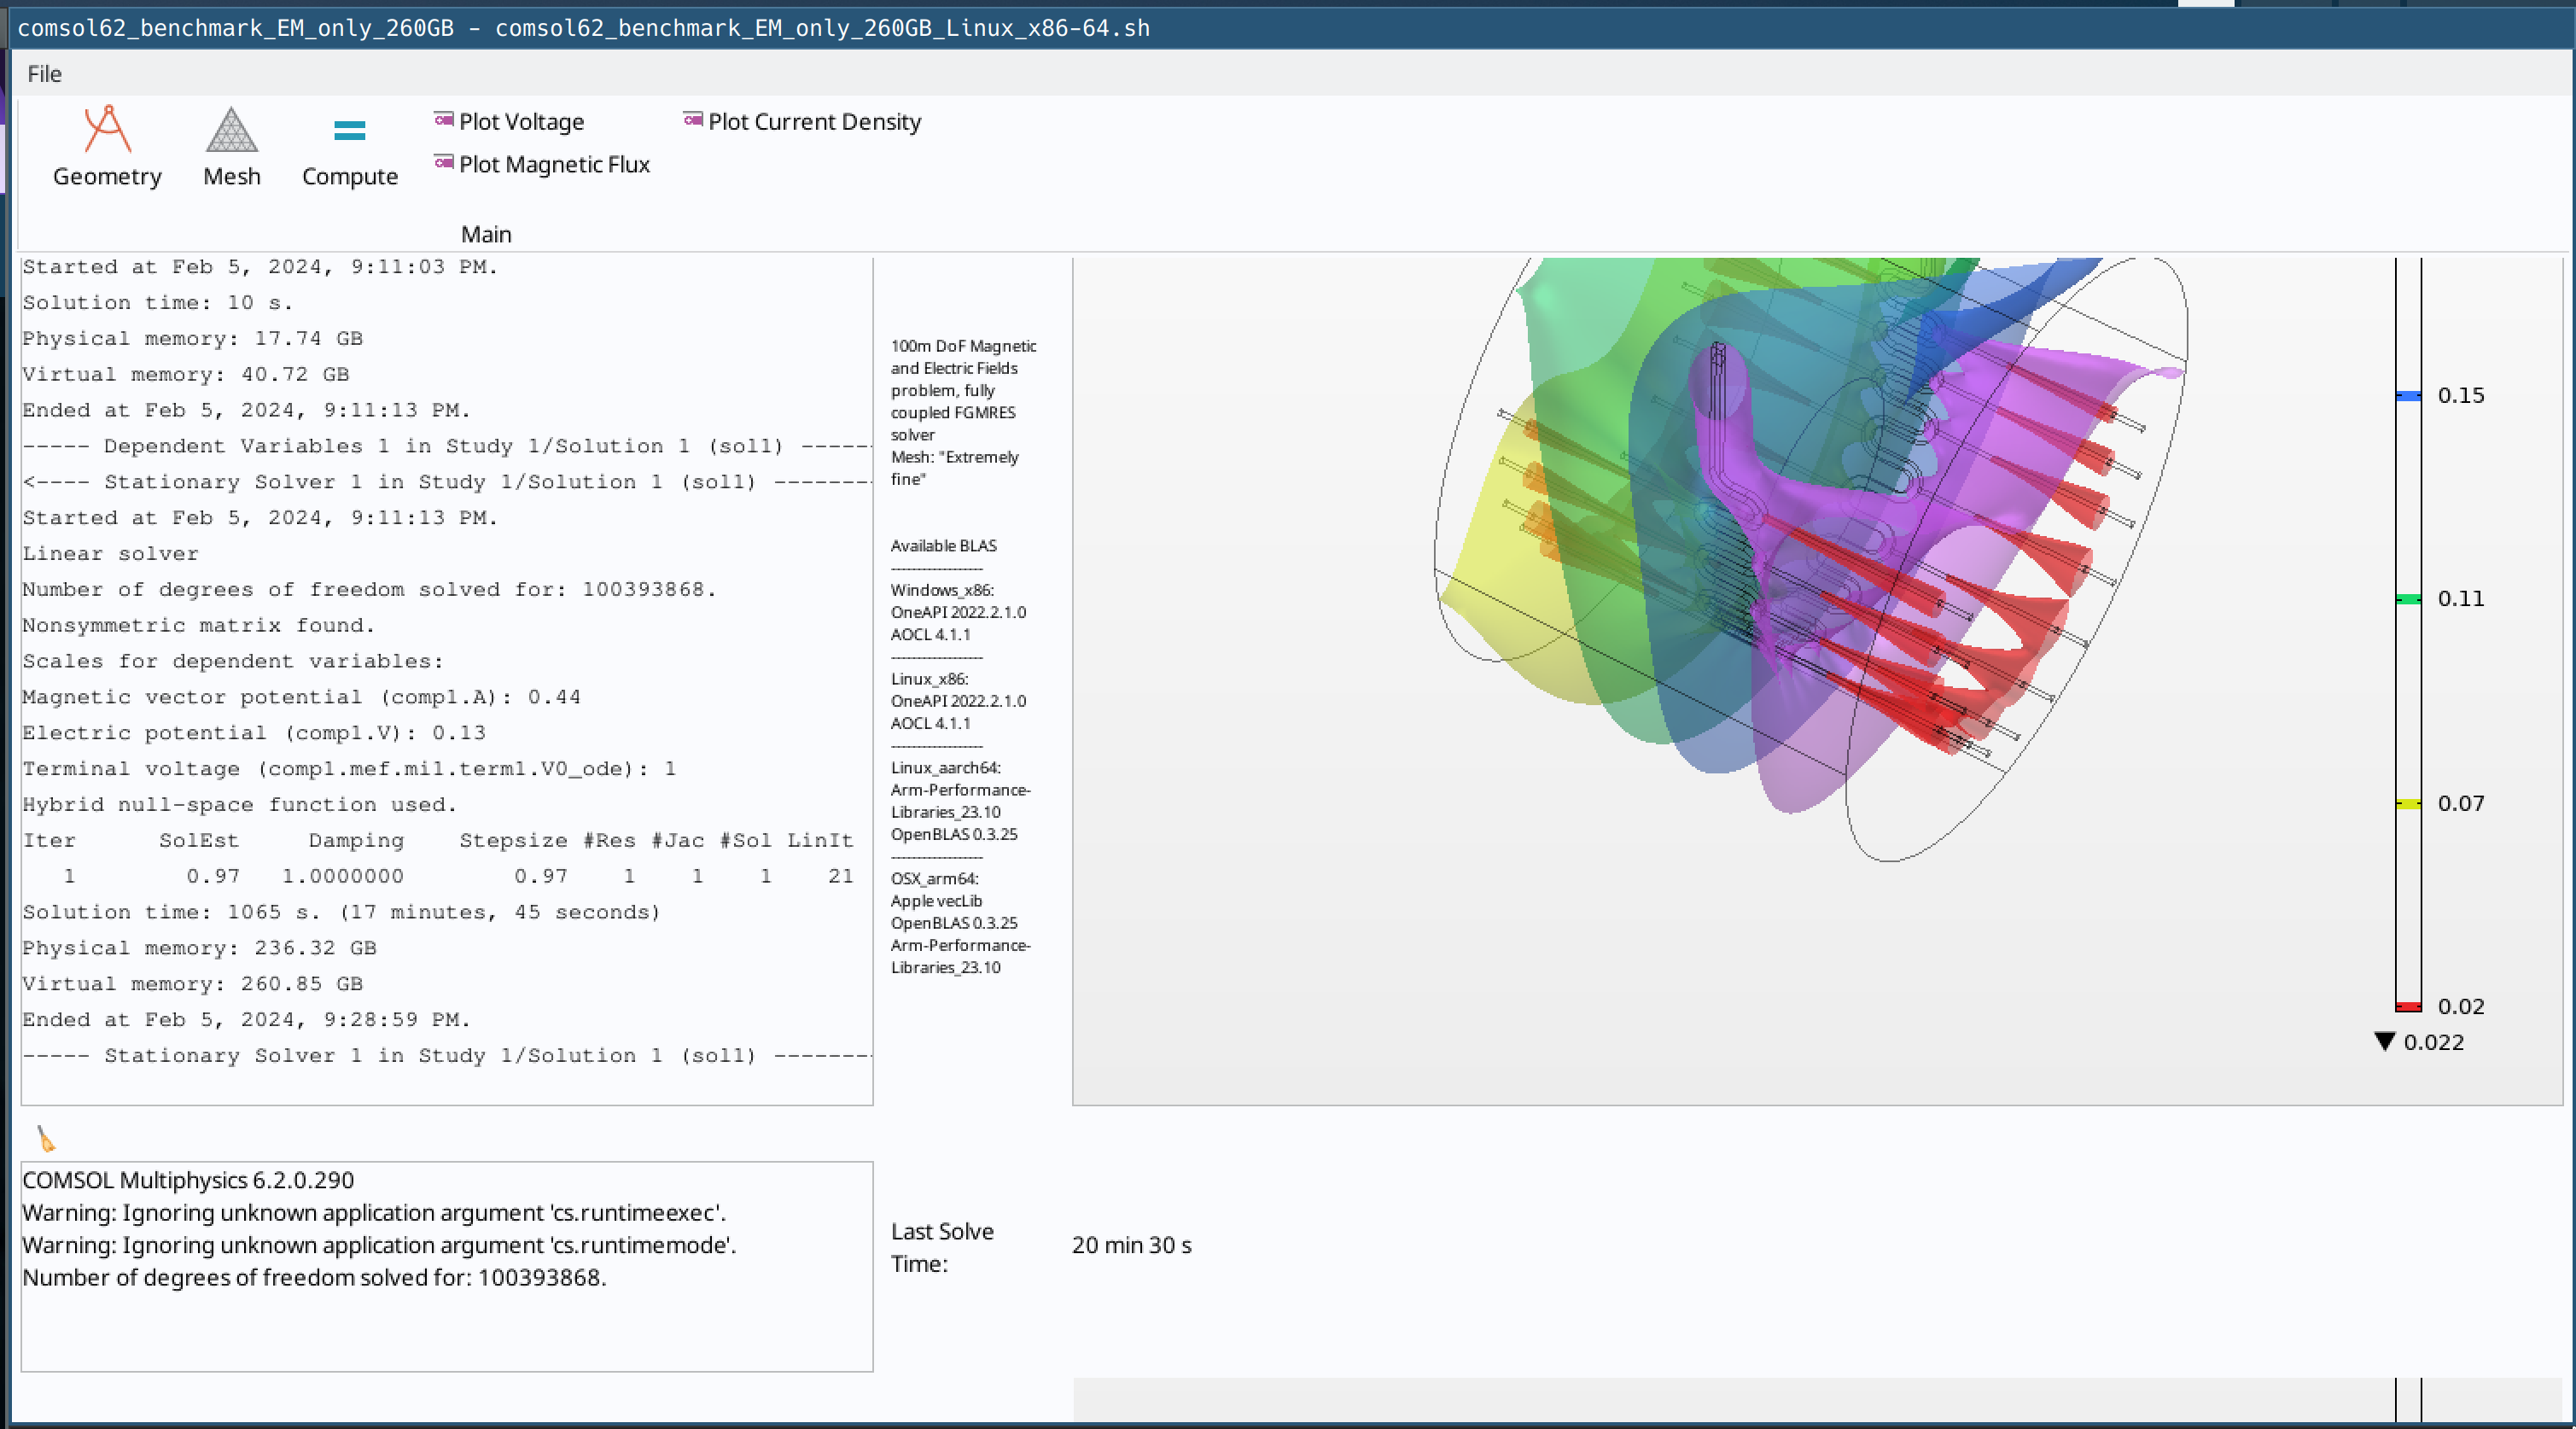
Electromagnetics-only model that uses a plethora of RAM and relatively less CPU resources. Run time on fast computer ~16 minutes using 260GB of memory
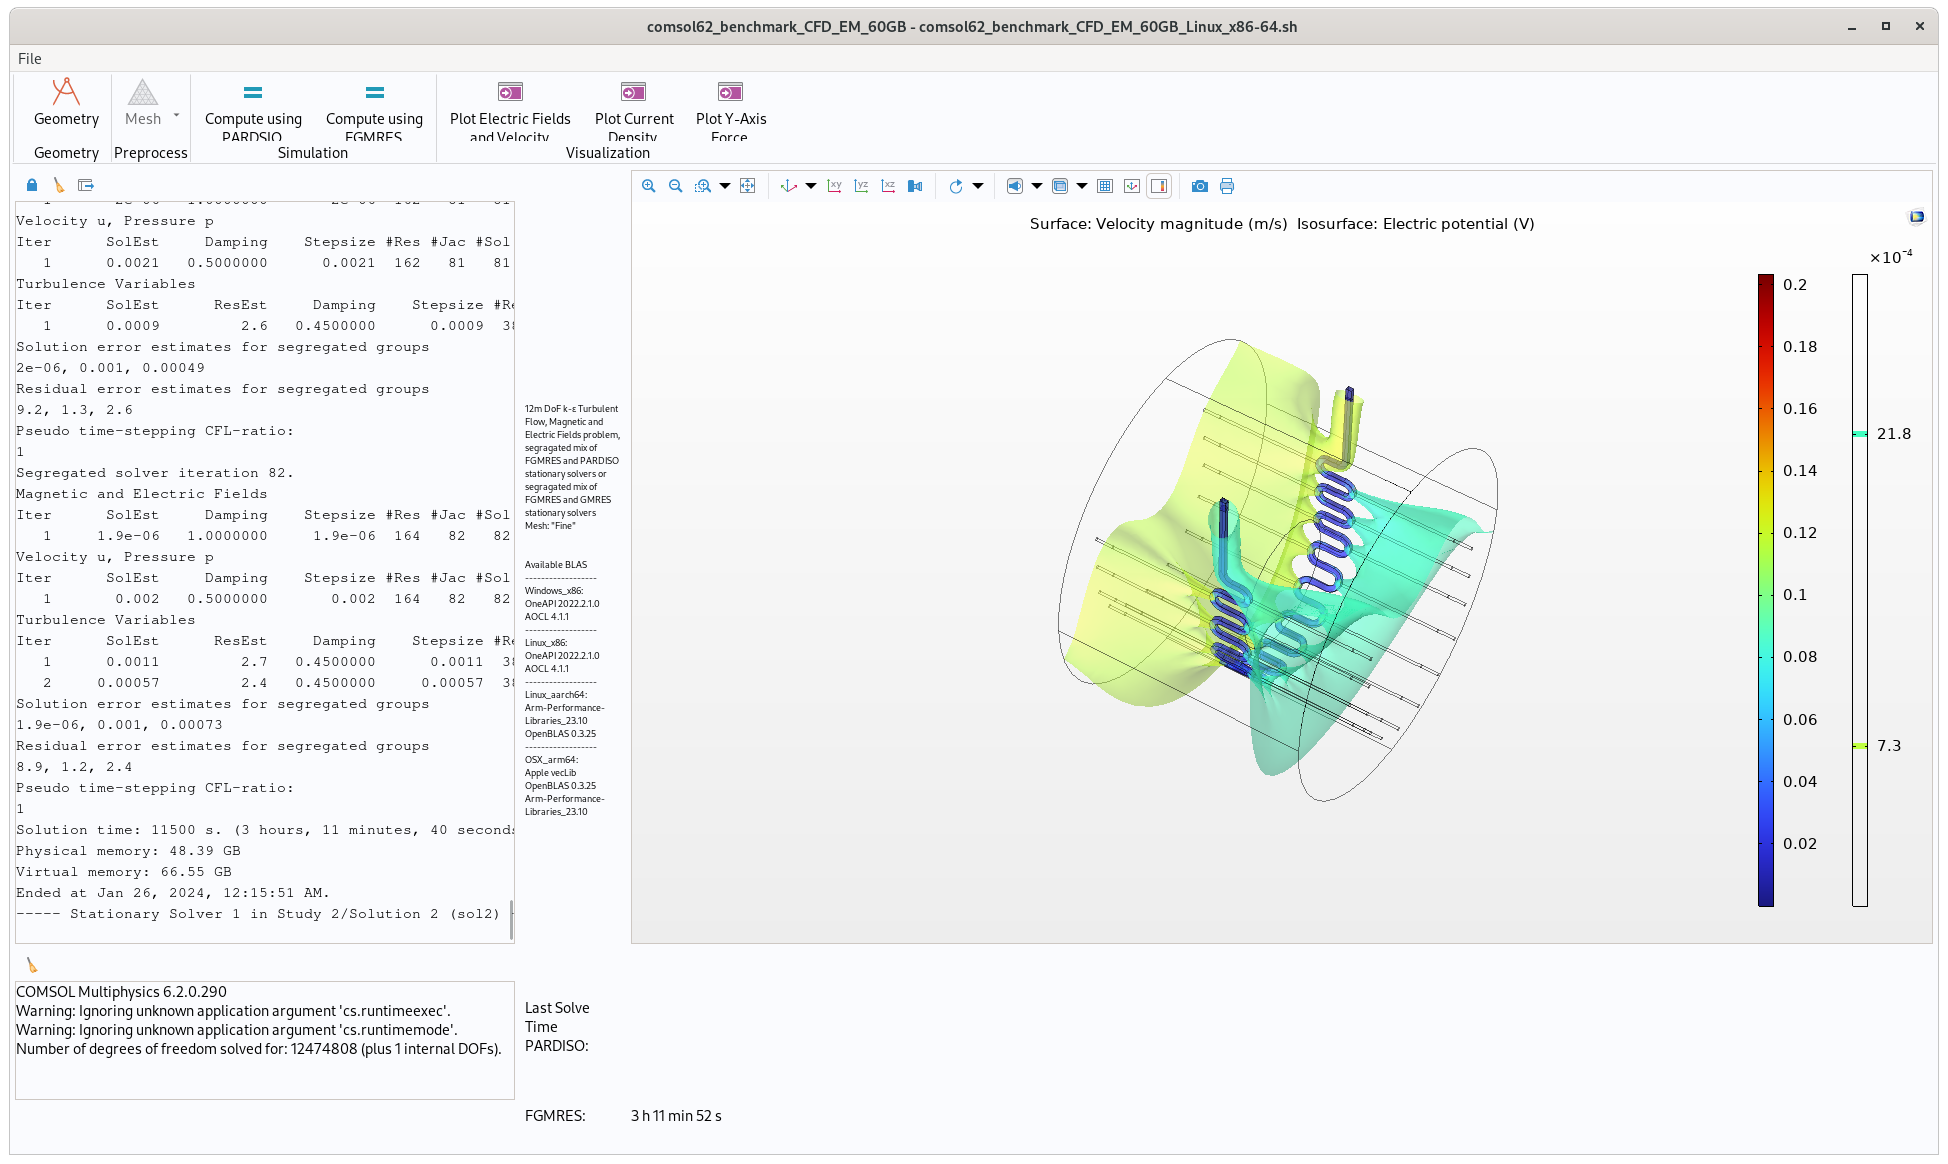
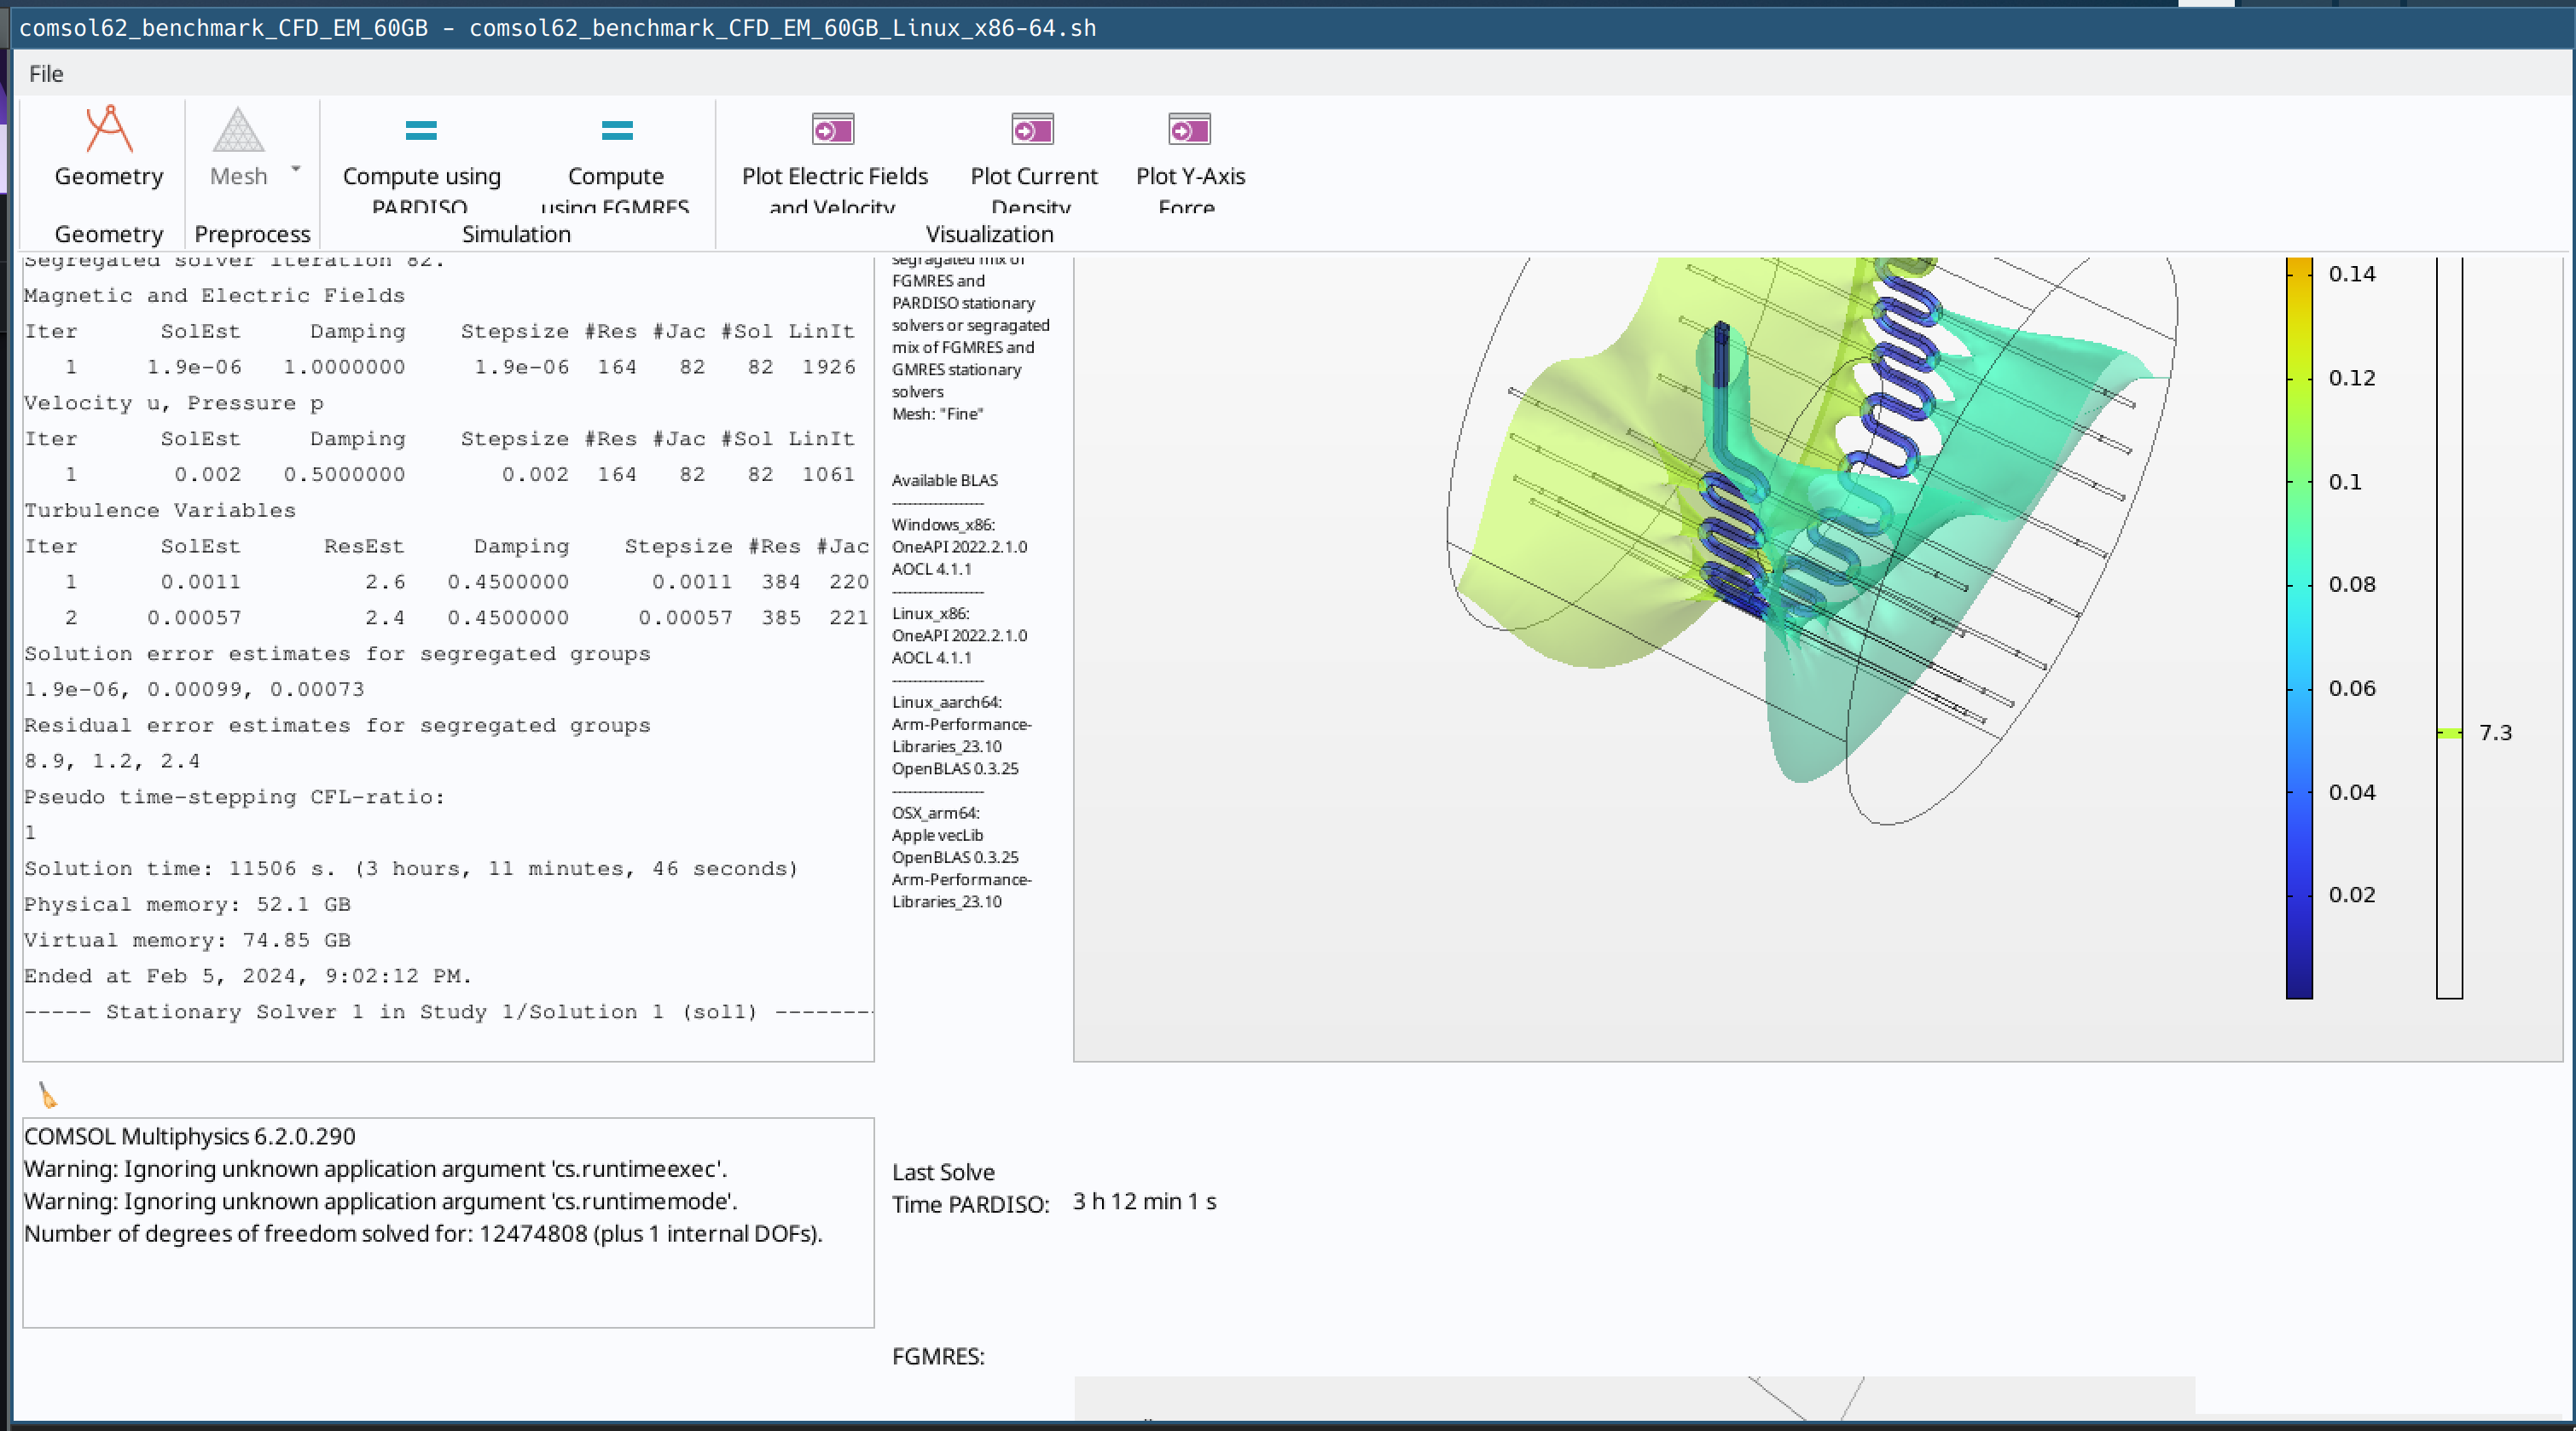
Multiphysics model that performs a coupled CFD-Electromagnetic simulation and uses a moderate amount of RAM and a ridiculous amount of CPU resources. Run time on fast computer ~190 minutes using 60GB of memory
Each benchmark is a self contained script/executable for Linux, Windows or OSX; x86/arm µarch’s are supported but the right script/executable needs to be run according to OS and µarch
Example Installation/Run
For Windows, you simple double click the .exe and it will ask to install a runtime on the first start, after that it will launch.
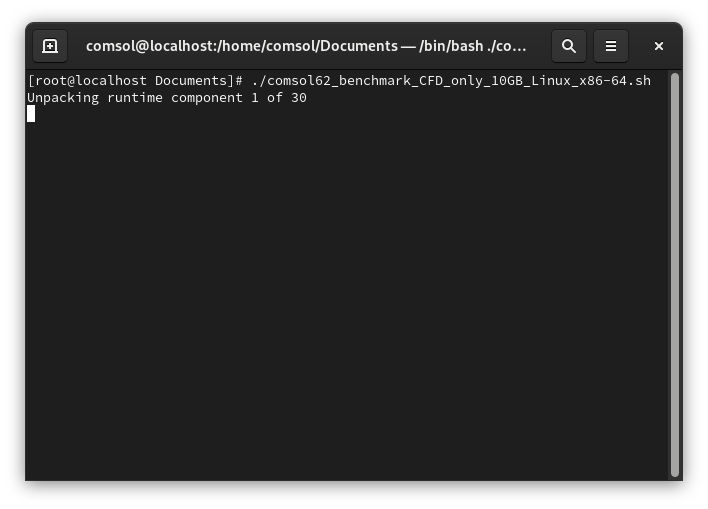
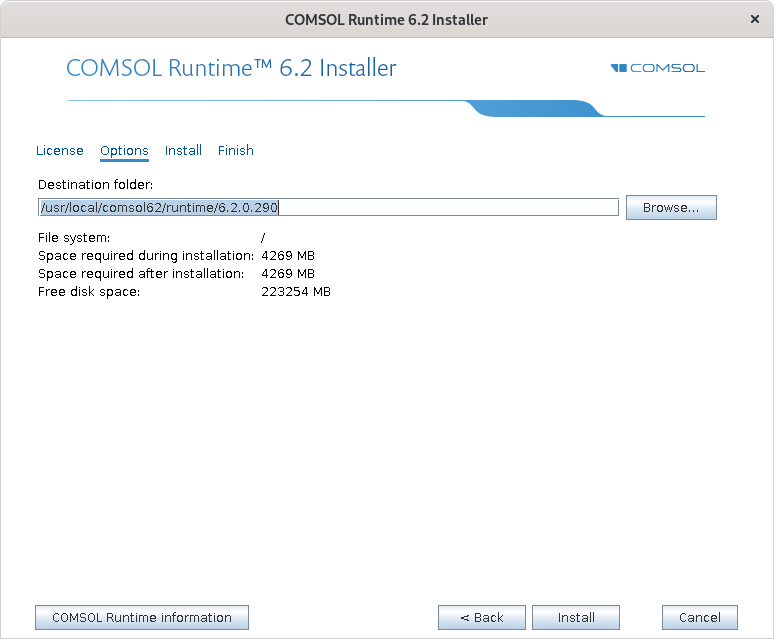
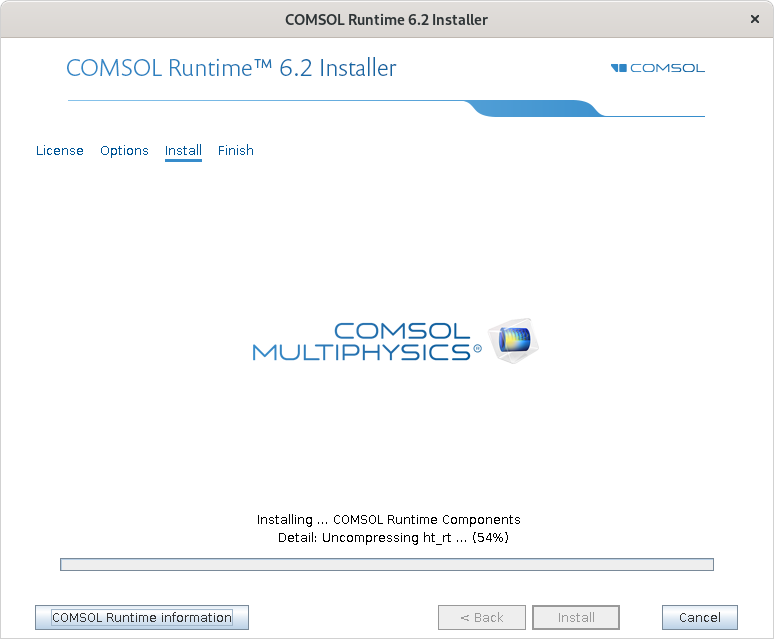
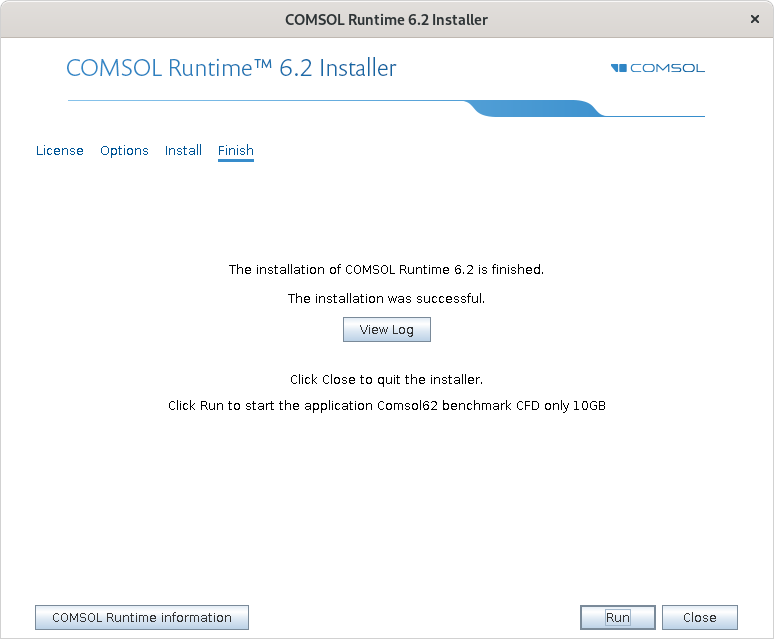
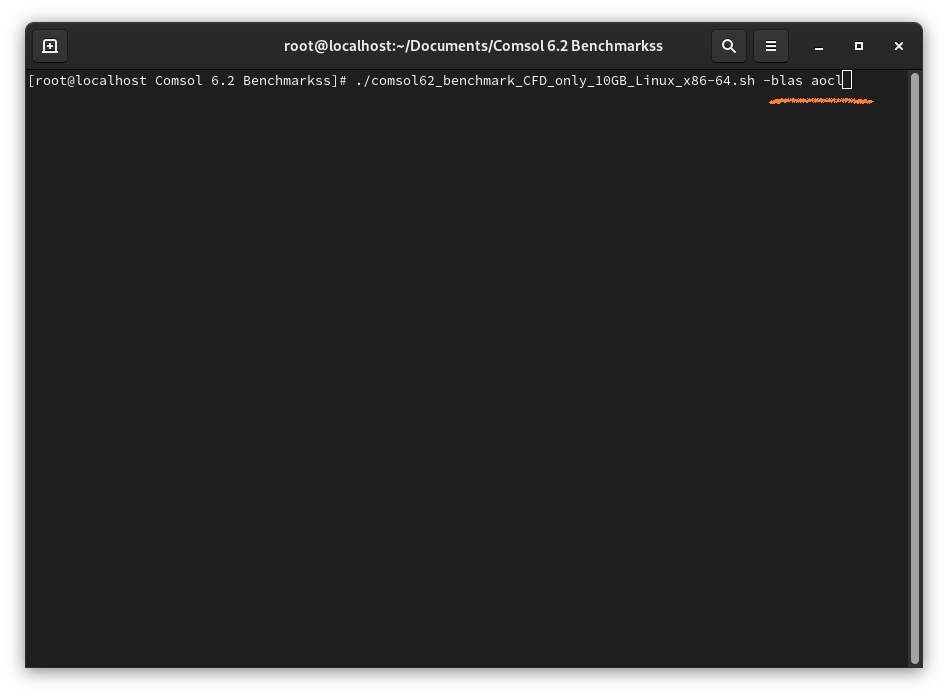
For Linux, the .sh file can be run with bash, a runtime will install first launch, after that the benchmark will start.
Once the benchmark has launched, click the ‘Compute’ button on the top ribbon and wait for it to solve, a solve time will be displayed in the bottom middle of the screen.
the “10GB” CFD benchmark takes about 23 minutes to solve on a reasonably fast computer, the “260GB” EM takes ~17 minutes and the “60GB” CFD-EM takes about 190 minutes.
Different BLAS can be called upon during startup; large uplifts in performance can be had from choosing the most optimized for your specific µarch
BLAS selection
The Basic Linear Algebra Subprogram is the “heart” of FEA, it is what translates the linear algebra operations to solve a given problem into instructions for the CPU. There are many different BLAS that have been optimized for different architectures or even specific CPUs. The undisputed king in x86 has been Intel with their Math Kernel Library (MKL) for the past 20 years, often outperforming AMD’s own inhouse developed AOCL even on AMD processors. However AMD just released AOCL 4.1 and it would seem large improvements have been made with its use on Zen 4 CPUs.
For ARM processors Arm Performance Libraries seem to be preferred for maximum performance, even on Apple silicon.
Another thing I thought of to test, because of @RMM’s post on your thread, is to use the -numasets comsol command to enforce NUMA at the userspace level instead of using NPS in the BIOS.
Doing this might help Window’s thread scheduling?
ahhh I should have explained memory usage better. The CFD-only bench uses about 10GB of RAM, the CFD-EM uses ~60GB of RAM and the EM-only uses ~260GB of RAM; I say “about” because memory usage will scale with the number of core you throw at the problem so these numbers could grow or shrink a bit depending on system.
Another quirk I forgot to mention: the CFD-EM benchmark actually has two compute buttons, one for PARDISO and one for FGMRES. On x86 processors there shouldn’t be much of a difference (slight favor to PARDISO) between these two solvers in performance, but on ARM the PARDISO solver isn’t implemented as efficiently as it is on x86 so I added an alternative FGMRES solver to make sure the ARM versus x86 comparison is fair with optimal algorithms for each µarch.
I’m hoping to get someone with an M1/M2 Ultra to run the the two benchmarks that will fit in memory, I’m super curious on how it’s compute/memory performance stacks up against x86 in the real world.
Even one of the Ampere processor linux machines would be interesting to see, but I don’t have as high of hopes for these machines compared to Apple.
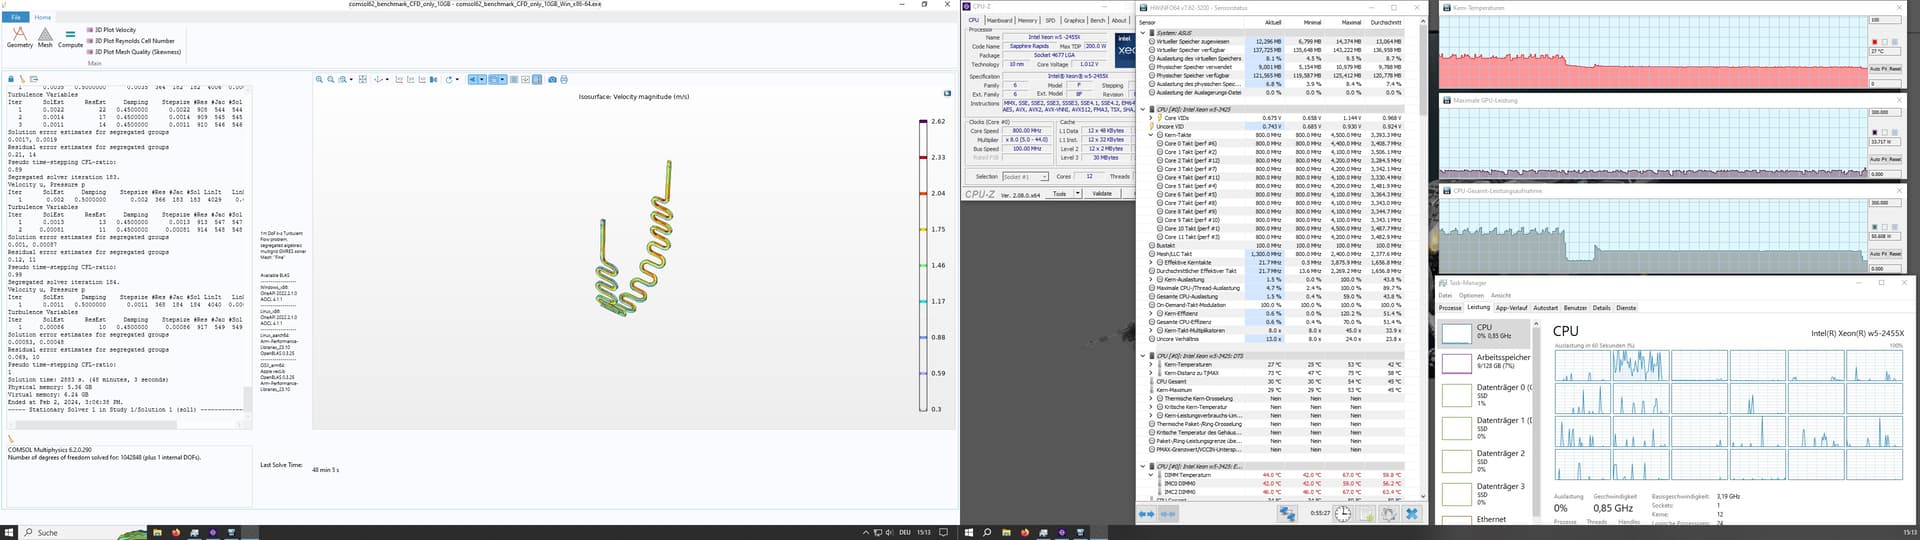
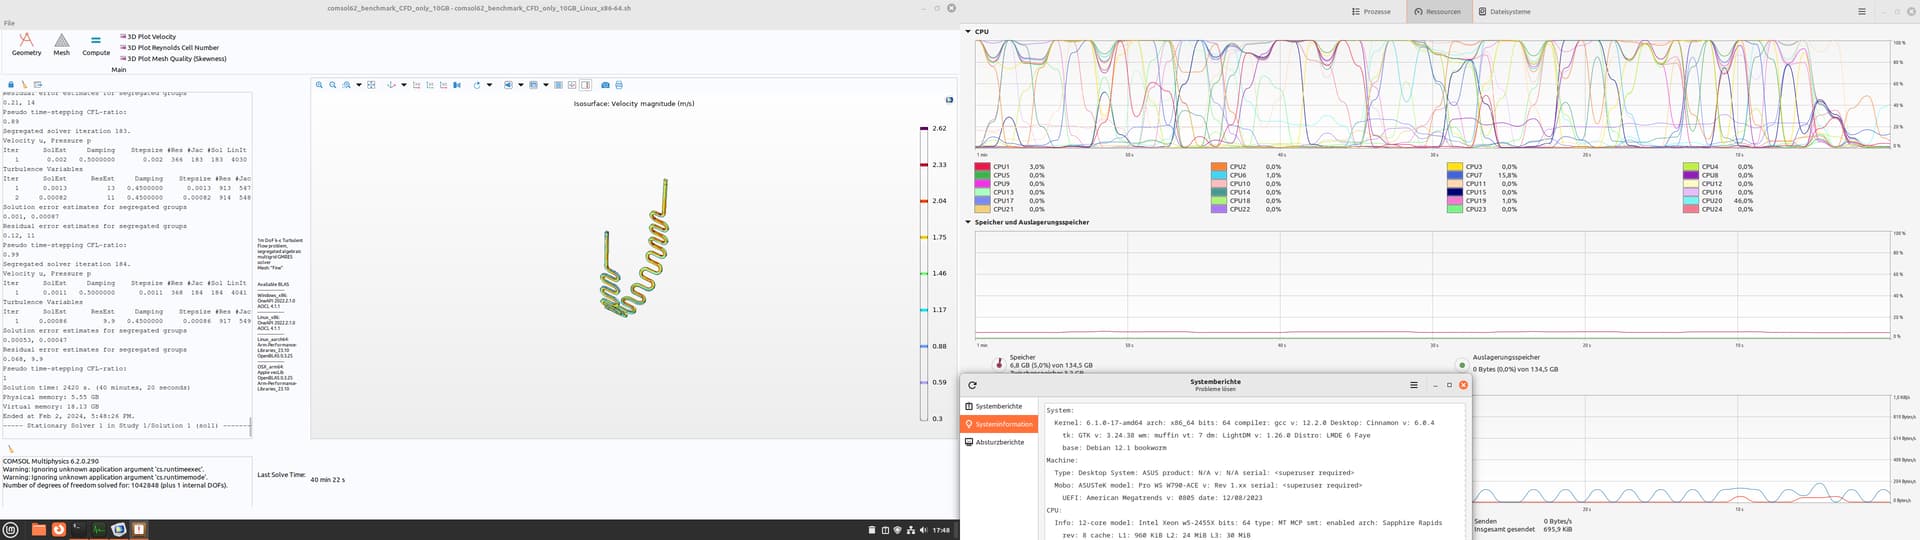
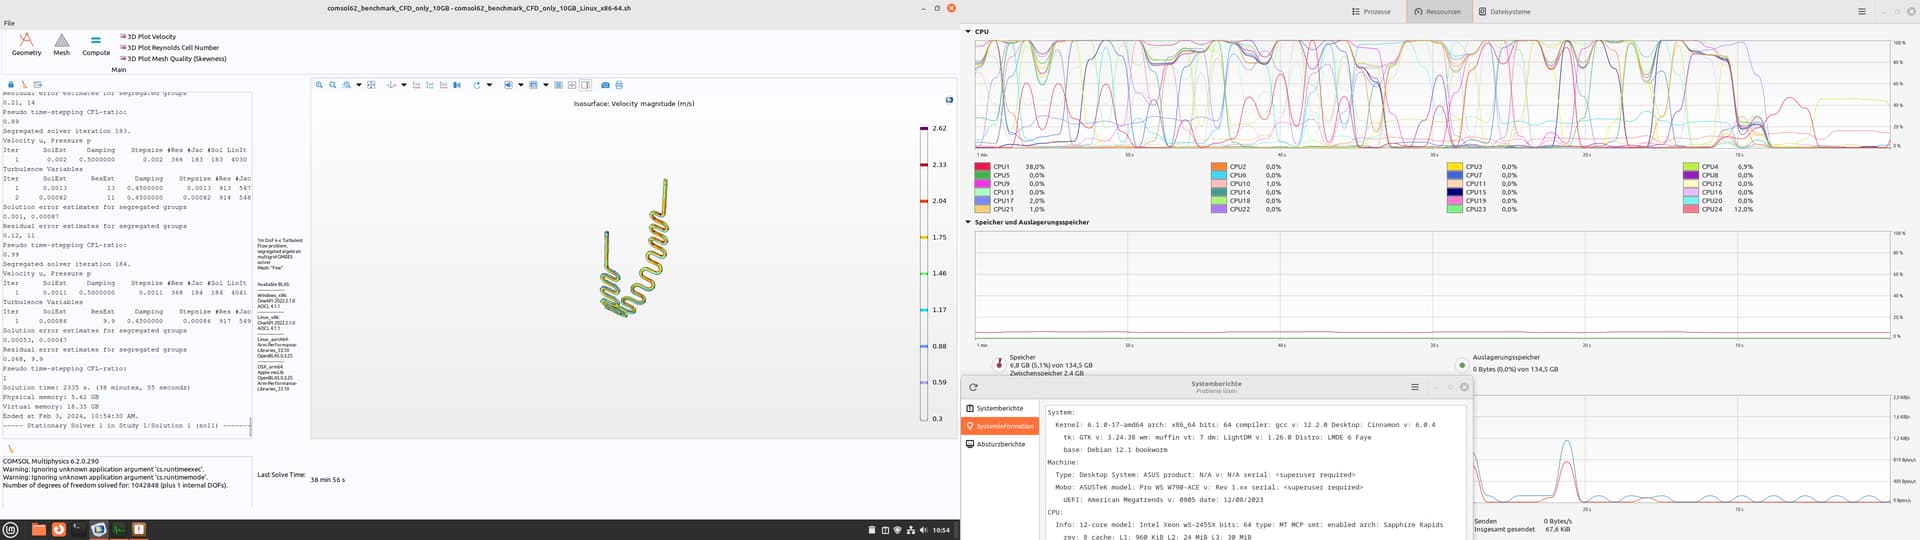
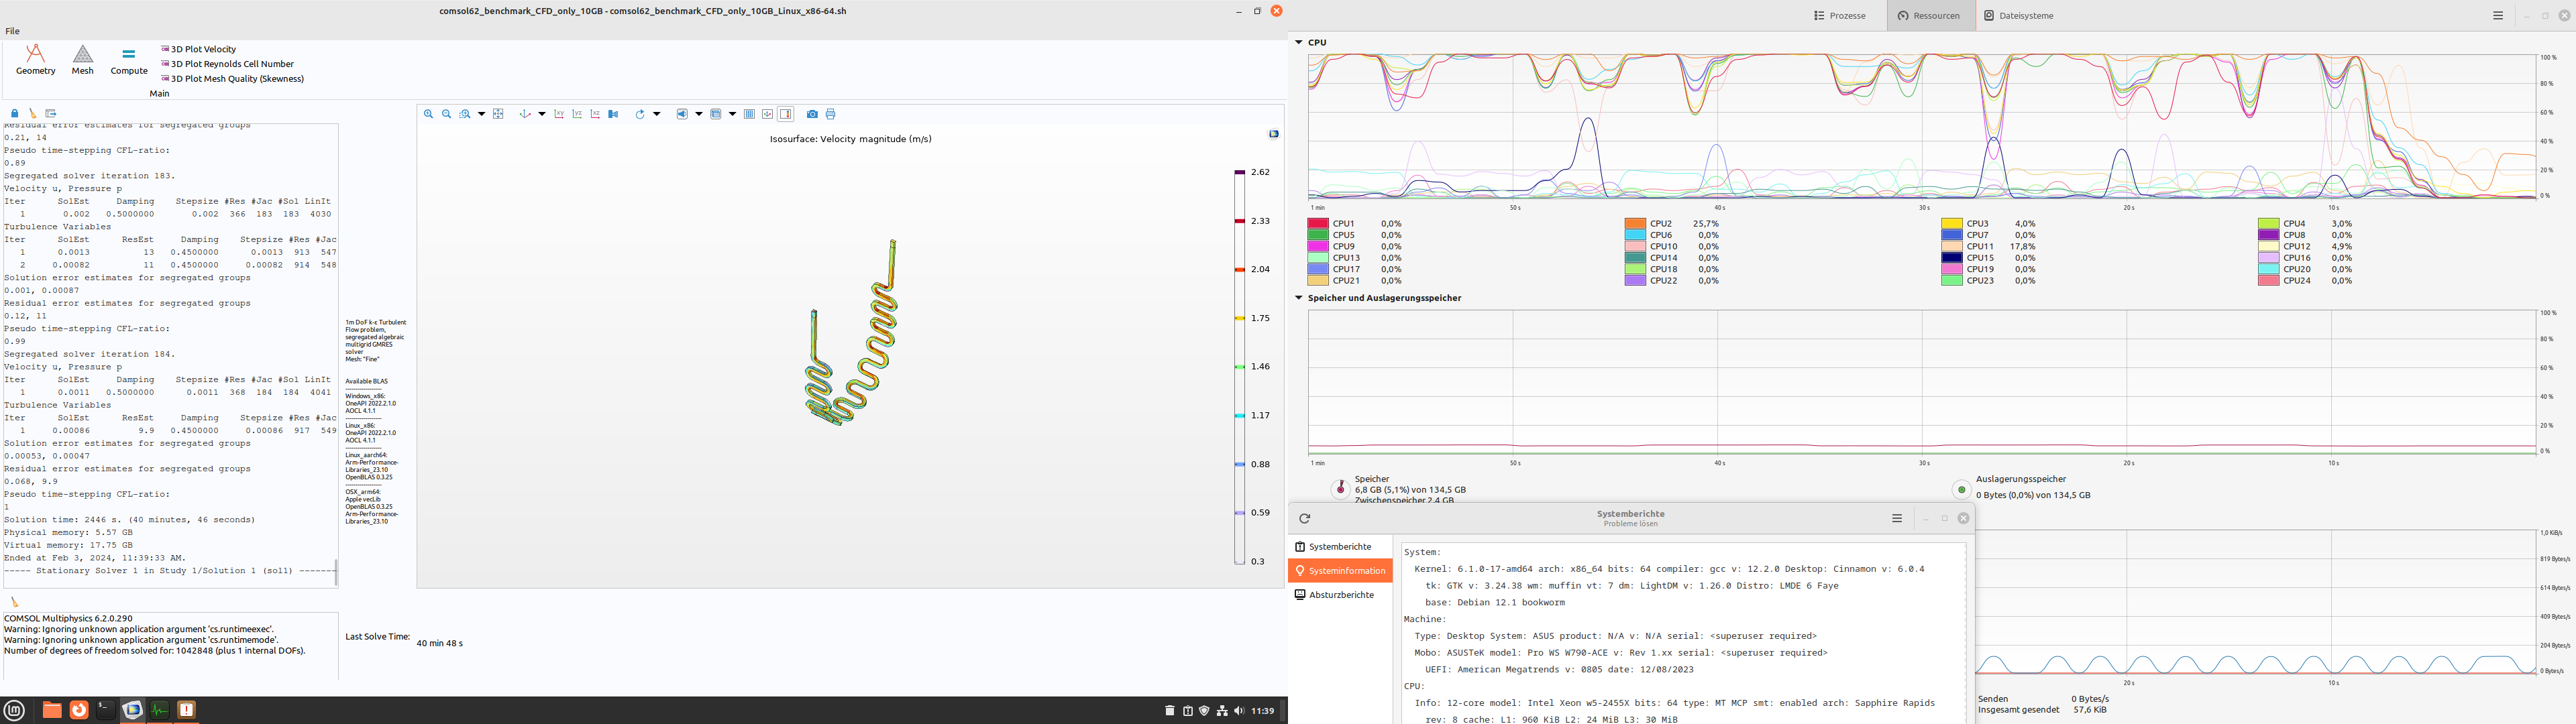
I tried the CFD only version. And the CPU behavior was a bit strange.
My system:
Intel Xeon w5-2455X
ASUS Pro WS W790-Ace
2x Micron RDIMM 64GB, DDR5-4800, CL40-39-39
Win10 on a KC3000
LDME6 on a Corsair MP600 via Hyper M.2 Gen5
The times:
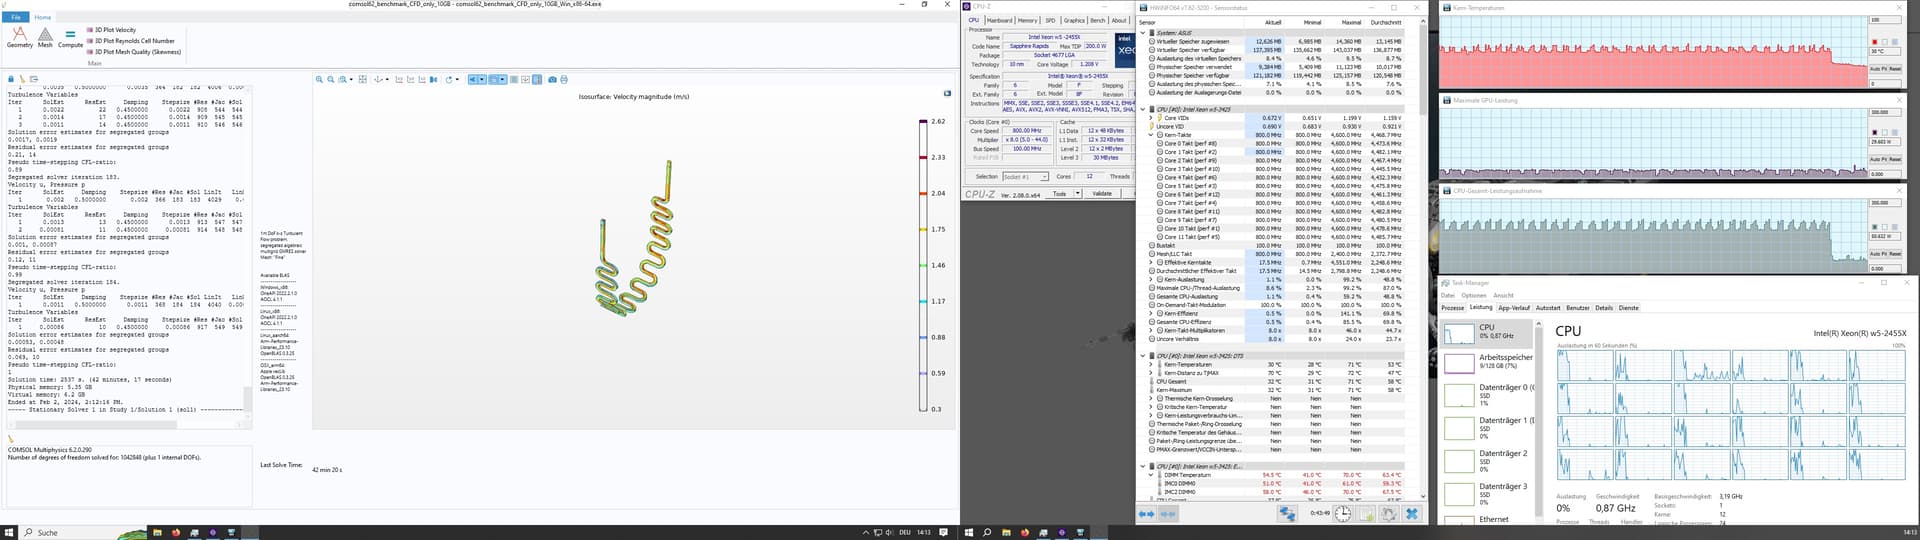
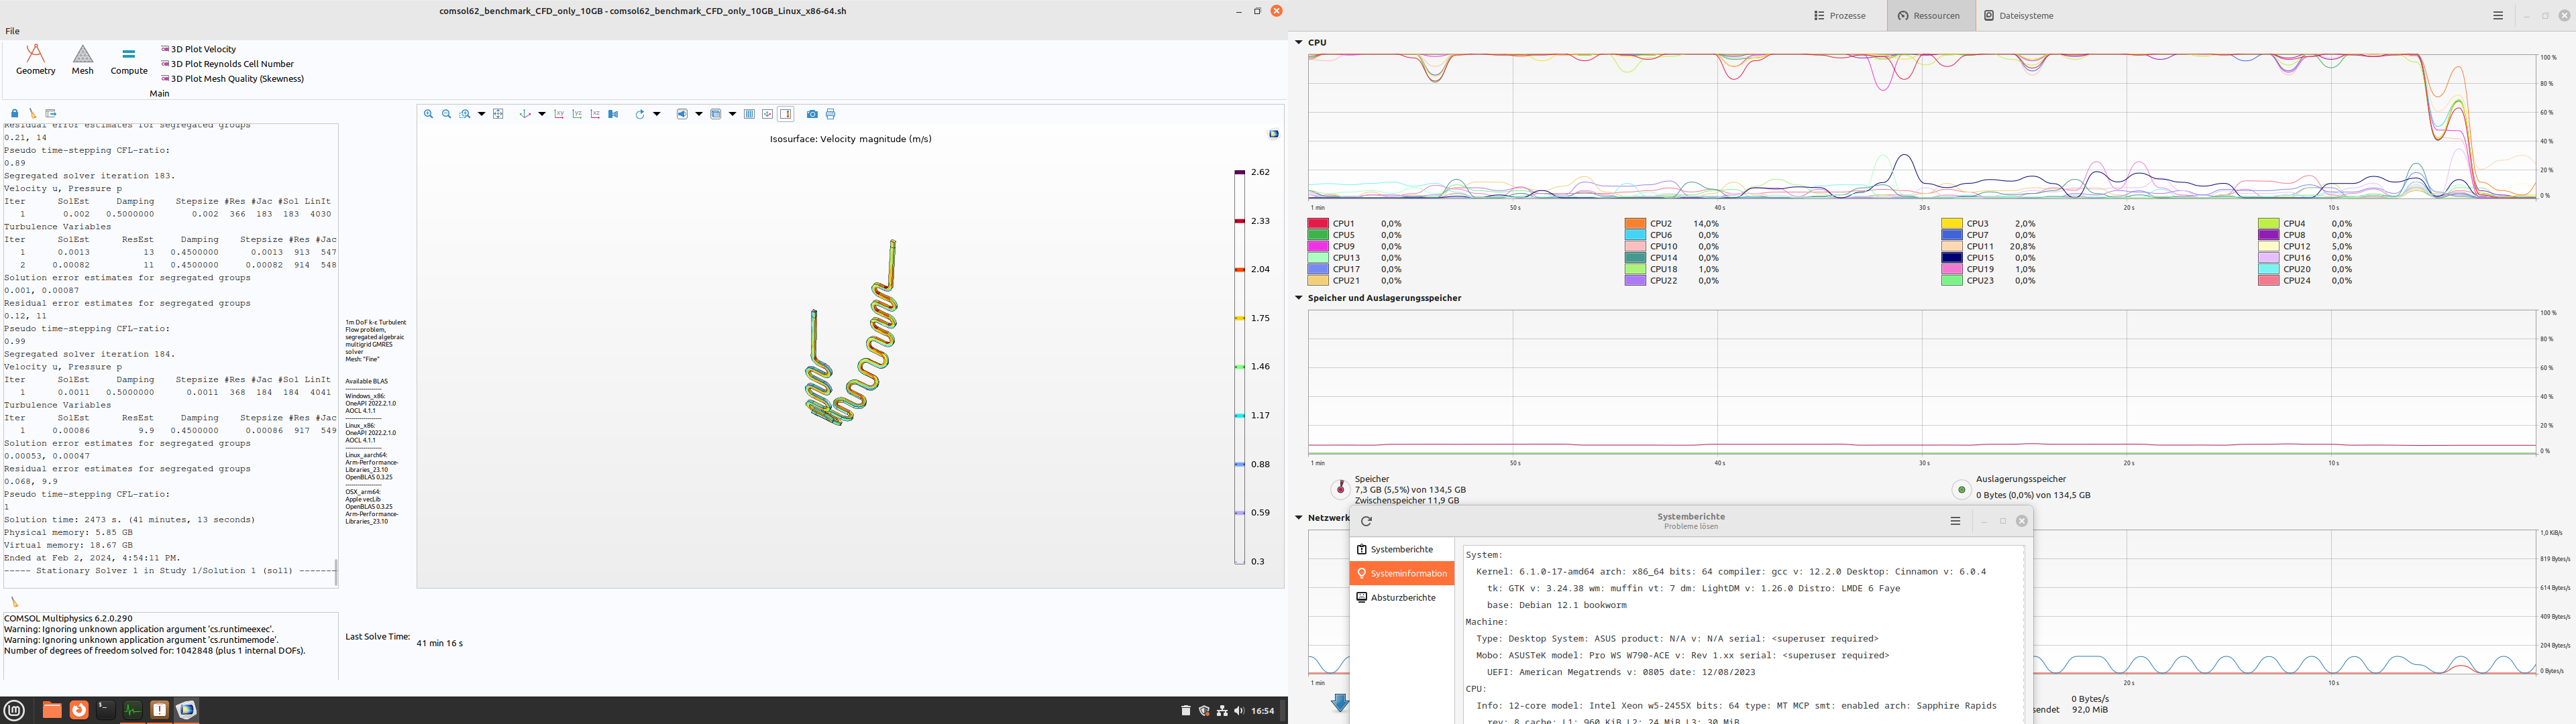
48 min; Win 10, CPU stock (3.9Ghz), 65% CPU usage. 45°C max 42 min; Win 10, CPU at 4.6 Ghz (By Core Usage), 75% CPU usage, 61°C max 41 min; LDME6, CPU stock (3.9Ghz), only 12 Cores where used, Threads Idle 40 min; LDME6, CPU at 4.6 Ghz (By Core Usage), only 12 Cores where used, but he switched all the time
hmmm… That is very interesting behavior, I would have expected the 4.6GHz Linux run to be ~15% faster the extra CPU frequency affords over 3.9GHz Linux.
The CPU thread load graph of the LMDE6 @ 4.6GHz makes it look like either processes are being juggled around on different threads or more likely the cores are memory starving for work and throttle down. 40min might be the limit for 2 channels of DDR5-4800; if you felt like investigating further you could bump your memory speed up to 5600MHZ and see if the weird CPU load choppiness on LMDE6 @ 4.6GHz persisted.
The faster Linux performance seems to be a trend, at least on newer hardware. I’m going to run the benchmark on dual E5-2650L v4’s and see if the difference in performance between Linux and Windows is still there. I have a hypothesis that the Windows scheduler on newer hardware doesn’t work correctly, but that on older hardware it does.
One more thing I neglected to mention about CPU usage on the benchmark:
The benchmark will use exactly half of the threads available on a system with hyperthreading, or if SMT is turned off in BIOS it should use all the cores/threads (it will automatically detect between the two scenarios and schedule accordingly).
There is a slight performance regression if you force it to use all the threads available on an SMT system because there is a small overhead to creating more worker threads that is not “overcome” by the meager amount of memory bandwidth/ALU increase that occurs from using SMT.
Many HPC supercomputers will intentionally disable hyperthreading at the BIOS level because of this phenomenon; but that isn’t necessary here.
The jugling you call, if seen allready on the previous generations of Xeon Scalable. Mostly in VM with Linux guests. I thought thats normal behavior. I found it more strange that with 3.9 Ghz he nearly draws a line.
And it gets more intresting:
I increased the RAM speed to 5200 MT/s. Because i remember that in the W790 Memory OC Thread, it was writen. That you need to increase the Voltage for 5600 MT/s. And iam not smart enough for Overcloaking.
So i went into the BIOS, put on Sync all Cores (instead of By Core usage). To see if the jugling went away (it doesnt). And also just switched from 4800 to 5200.
40 min; LDME6, CPU stock (3.9Ghz), RAM@5200 38 min; LDME6, CPU at 4.6 Ghz (Sync all Cores), RAM@5200
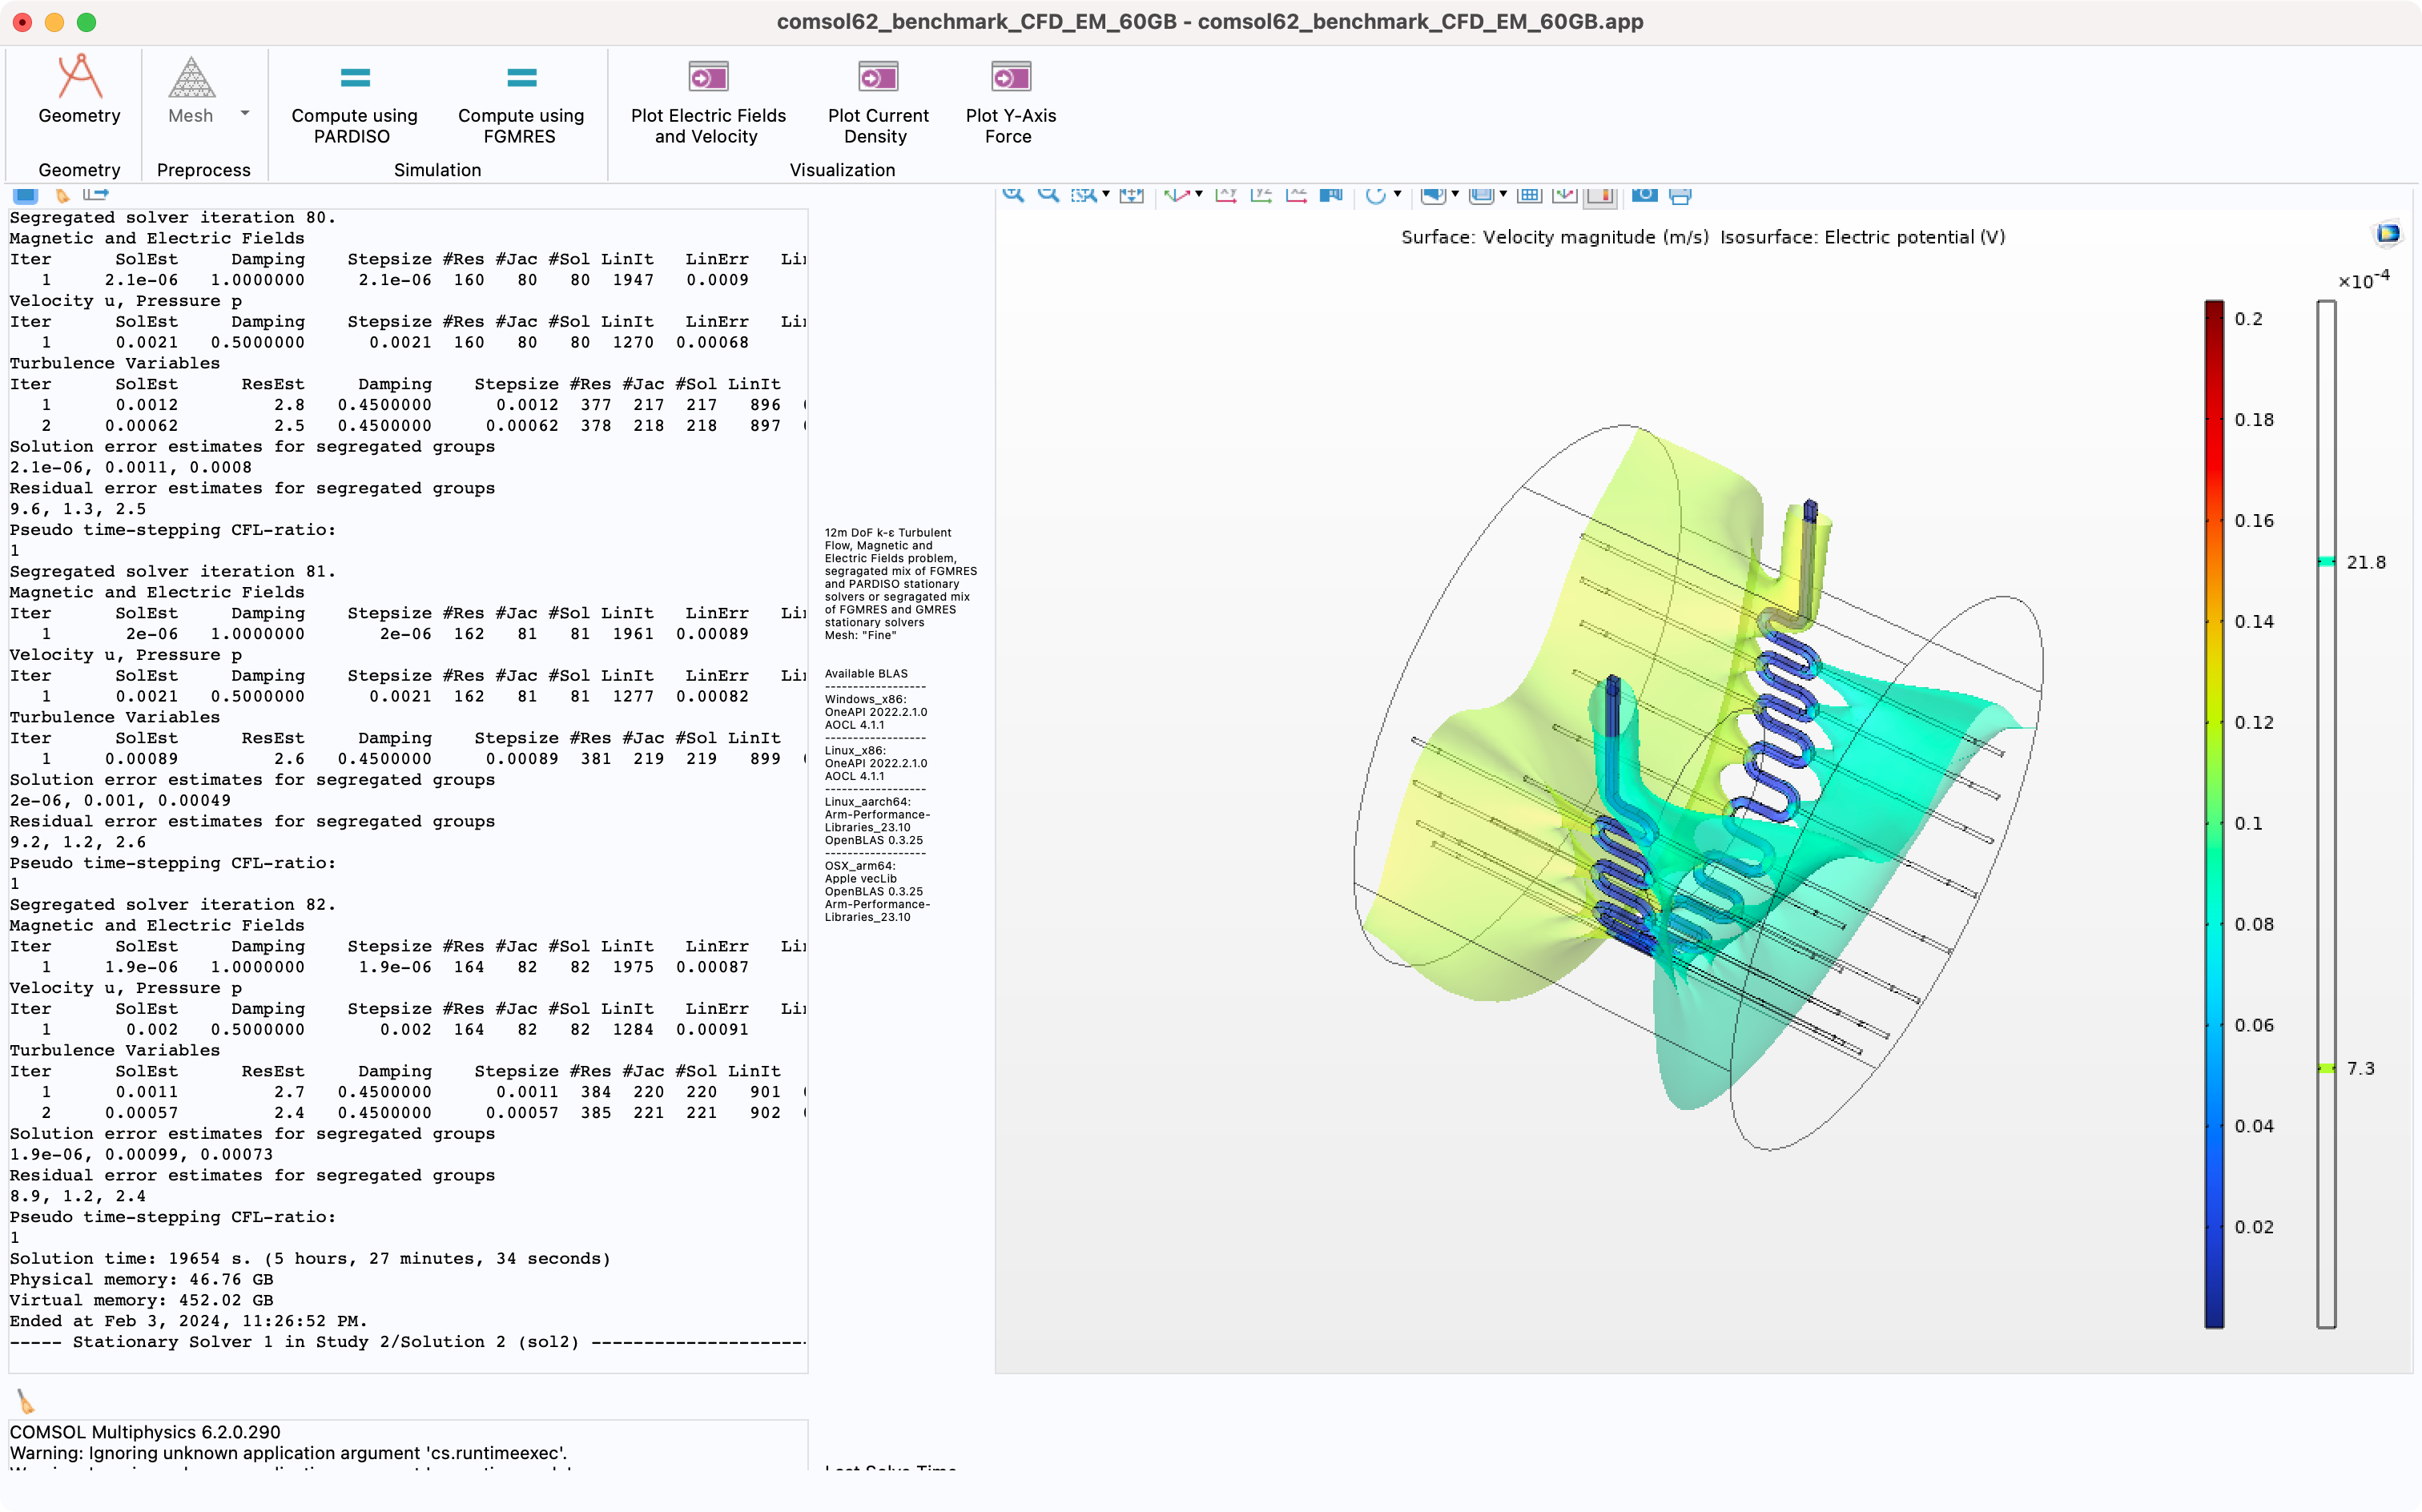
Ran the CFD-EM benchmark on my 2 year old M1 Max 14" MacBook Pro because I was curious. Interestingly the benchmark identifies it as an 8-core processor, indicating it uses the efficiency cores not at all, I’m guessing because they lack functionality required to make them useful to the operations the benchmark is carrying out. In any event:
Solution time: 19654 s. (5 hours, 27 minutes, 34 seconds)
Physical memory: 46.76 GB
Virtual memory: 452.02 GB
Ended at Feb 3, 2024, 11:26:52 PM.
Turns out running a simulation like this on a laptop is definitely possible, since 64GB of RAM, but certainly not fast. Five and a half hours at 30W is still ~165Wh, which… actually, I do wonder how that works out in terms of efficiency. Interestingly, during the actual computation portion the 8 performance cores were visibly maxed out all the time, but the efficiency cores were left mostly unloaded, which meant the whole OS remained perfectly responsive. I did close as many other user-land apps as I could to make as much RAM available as possible but I didn’t go nuts trying to kill unnecessary background processes.
I wonder how much of an improvement an M2 Ultra would be, and actually given how beefy the M3 Max is compared to the M2 Ultra, I suspect the M3 Ultra will be significantly faster still.
Sadly, on my system, the benchmark crashes immediately. A logfile with the following contents is created in the working directory:
# A fatal error has been detected by the Java Runtime Environment:
#
#  SIGSEGV (0xb) at pc=0x00007fe01dc0263d, pid=73926, tid=74205
#
# JRE version: OpenJDK Runtime Environment Temurin-11.0.20+8 (11.0.20+8) (build 11.0.20+8)
# Java VM: OpenJDK 64-Bit Server VM Temurin-11.0.20+8 (11.0.20+8, mixed mode, tiered, compressed oops, g1 gc, linux-amd64)
# Problematic frame:
# C  [libLLVM-17.so+0x120263d]  llvm::SelectionDAGBuilder::visitInsertValue(llvm::InsertValueInst const&)+0x51d
#
# Core dump will be written. Default location: Core dumps may be processed with "/usr/lib/systemd/systemd-coredump %P %u %g %s %t %c %h" (or dumping to /home/quilt/tmp/comsol_bench/core.73926)
#
# If you would like to submit a bug report, please visit:
#   https://github.com/adoptium/adoptium-support/issues
#
The OS is fedora 39… Perhaps some version conflict?
This is the correct behavior, the efficiency cores supposedly slow the overall computation down because managing them is more overhead than the work they produce (although I have strong suspicions that might not be true in all situations).
The runtime is smart enough to figure out the core topologies for all the M1, M2 and M3 Macs (maybe not the M3 Ultra though), but when the M4 Macs come out it might guess at p/e core topology wrong. In that case the -np # command could be used to force it to use a specific number of cores; you could force it to use the two efficiency cores if you used -np 10 argument when launching through terminal.
The Apple efficiency cores actually support the full NEON instruction set that is used so they are legitimate targets, contrary to Intel CPUs where the e-cores have a curtailed instruction set.
To balance out my praise for Apple I’d like to rag on them for not yet implement SVE and only supporting more shallow NEON instructions.
Was the swap being filled up when this was running? It reported an awfully high virtual memory usage at the end which I haven’t seen before (might be some kind of quirk of the BLAS library used).
47GBs sounds about the right number for solving on 8 cores though.
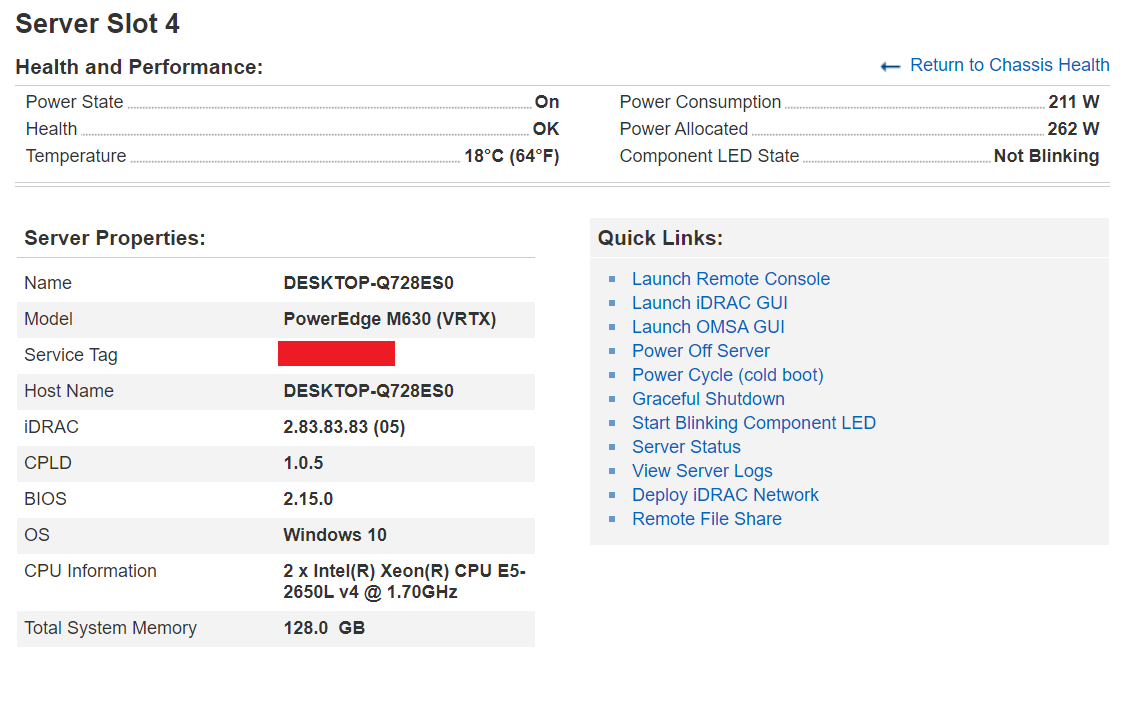
Very favorably, I just ran the same model on a Dell M630 and it took 9h 6m 6s using a constant ~200 watts throughout the run.
I have high hopes for it, the M3 Ultra is going to be the first Mac with the right amount of memory (assuming it’s going to top out at 256GB) for the problems I commonly work with. It would be very nice to replace my 500w Sapphire Rapids space heater with ~70 watt Mac Studio.
This a stab in the dusk, but I think it might have something to do with the output window rendering. You could switch to using the pure software renderer rather than the opengl renderer it defaults to by using the command:
I also couldn’t get the benchmark to work with OpenGL for some reason, but -3drend sw fixed it. Here’s a CFD only 10GB one on 3495X with 8x DDR5 4800 MT/s. The CPU is slightly overclocked, power usage peak at 375W.
Not sure if this is due to my current overclock profile being only 3.3 GHz boost (all cores), and with only 4800 MT/s RAM, or if some of the VM (Windows machine & K8s cluster) are running something in the background, causing the slowdown. I will find some time and re-run again.
These results make some sense because they are bottlenecked by memory bandwidth (especially the EM) more than the CFD bench. I’m running about as heavy of an overclock on my memory I can get away with at 5880MHz.
FWIW I was able to set my memory to 5600MHz without any increase in voltage or tweaks in timing, you might be able to get away with an easy memory overclock too.