I’m recently trying to convert full time to linux (I chose Mint). I’ve gotten most of the bases covered but one thing i’m looking for currently is a resource monitor.
Windows 10’s task manager is one of the best ones i’ve seen because the most recent version shows GPU usage and disk usage. Is there a resource monitor you can get for linux that at least shows disk usage percentage and preferably read/write speeds?
Disk usage percentage and speed of the disk being read from/written to in MB/s.
I would like all of the usages in one application but the only one I really want that the GNOME one doesn’t come with is disk usage. GPU usage would be a bonus.
I just downloaded Psensor, I hadn’t seen that one come up in my searching. It gives me GPU usage and GPU Memory usage which is cool, still missing Disk Usage though.
Also Psensor giving the temps is similar to HWmonitor or something on windows which is cool.
I don’t actually mind the terminal look for the display of info. One thing I was just looking at suggested Glances but didn’t see a place that it shows disk usage yet. I literally just started looking at it though.
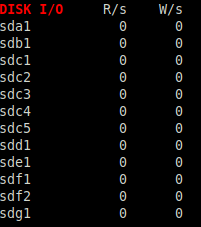
Yeah, glances is the first thing that comes to my mind. Note that it will change what is displayed based on the window size. Make your terminal window bigger to see a lot more info. It shows filesystems (used/total), network I/O, and processes can be sorted by disk I/O (press ifor that). Press h for help to see a list of options.
So far Glances does pretty much everything I was looking for, just in text format.
For anyone that may come across this thread asking the same questions I had, changing the colors on the terminal and setting a separate color profile for Glances also helped make the important things stand out so its not just a wall of info…
It was mostly trial and error that I used to figure out what colors went to what.
EDIT: When starting Glances use “glances -t 1” (change 1 to change refresh rate in seconds) to speed up how often it refreshes.
After startup the hotkeys I use are:
/ (shortens process name)
s (hides sensor status, I don’t need it)
1 (one) (shows individual cores at the top)
0 (zero) (Enable/disable Irix process CPU … whatever that means… does CPU%/8 for me which would be percent of overall CPU I believe).
H will show the hotkeys to hide/show more things. Here are those same hotkeys so you don’t have to tab between them.
Glances hotkeys
a Sort processes automatically
b Bytes or bits for network I/O
c Sort processes by CPU%
l Show/hide alert logs
m Sort processes by MEM%
w Delete warning alerts
u Sort processes by USER
x Delete warning and critical alerts
p Sort processes by name
1 Global CPU or per-CPU stats
i Sort processes by I/O rate
I Show/hide IP module
t Sort processes by TIME
D Enable/disable Docker stats
d Show/hide disk I/O stats
T View network I/O as combination
f Show/hide filesystem stats
U View cumulative network I/O
n Show/hide network stats
F Show filesystem free space
s Show/hide sensors stats
g Generate graphs for current history
2 Show/hide left sidebar
r Reset history
z Enable/disable processes stats
h Show/hide this help screen
3 Enable/disable quick look plugin
B Count/rate for Disk I/O
e Enable/disable top extended stats
5 Show/hide top menu (QL, CPU, MEM, SWAP and LOAD)
/ Enable/disable short processes name
Q Show/hide IRQ stats
G Enable/disable gpu plugin
6 Enable/disable mean gpu
0 Enable/disable Irix process CPU
q Quit (Esc and Ctrl-C also work)
i’m looking into Ksysguard next. Its cool that its just in the software Manager.
Side note, does anyone know how to make a startup script to start Glances and hit the hotkeys using the script so you don’t have to each time you start it up?
In windows I would use a .bat to do it… In linux I think its a .sh but i’m not sure how to make it attempt to run because all I get is a “permission denied”
Well theres literally no reason to leave a task manager open unless youre attempting to diagnose something. It uses more resources tell you how much your resources are being used. This isnt windows, so you dont have to treat it like windows.
If all you want to do is rice out your desktop with widget-like system stats then conky is your friend.
When i’m doing something and the computer begins to stutter or act sluggish or anything like that I like having a system resource monitor that i can open and check things out. Is a disk busy, CPU busy… etc, etc… I don’t necessarily need it running all the time but there are times I would just leave task manager on windows open for extended periods of time just because… (I have 3 monitors)…
Being newer to running linux full time i’m searching for things that can do just that, keep an eye on everything going on. Call it confidence monitor… geeking out on seeing all the individual processes doing their thing… whatever…
A while ago I remember Conky but ended up ditching it because I didn’t take the time to figure out how to configure it because I didn’t care enough at the time. I’ll look into it a bit now since i’m trying to use Linux full time now.
There are other managers to help you create conky configs, or tutorials to create your own. I’m mobile right now but if you remind me tomorrow I’ll dig up what I found for another user.