
Video Review
This epyc megaquest covers three dual-socket systems, configured as follows:
| System | CPU configuration | Architecture and role | Host memory and total L3 | Observed NUMA configuration |
|---|---|---|---|---|
| EPYC 9996 | 2 x 256 cores / 512 threads per CPU; 512 cores / 1,024 threads total | Zen 6c, density flagship | 2.0 TiB DDR5-12800; 2 GiB L3 | 16 channels/socket; NPS2, 2 nodes/socket, 4 total |
| EPYC 9686F | 2 x 96 cores / 192 threads per CPU; 192 cores / 384 threads total | Zen 6, high-frequency full-core case | 2.0 TiB DDR5-12800; 768 MiB L3 | 16 channels/socket; NPS2 baseline and same-host NPS1/NPS2 comparison |
| EPYC 9755 | 2 x 128 cores / 256 threads per CPU; 256 cores / 512 threads total | Zen 5 reference | 1.5 TiB DDR5-6000; 1 GiB L3 | 12 channels/socket; NPS1, 1 node/socket, 2 total |
Bottom Line
Zen6 delivers surprisingly high generational uplift with only minor tradeoffs at a hardware level. 8 to 12 cores per chiplet for Zen6 cores; 16 to 32 (33! kinda!) cores per chiplet for Zen6c cores.. clock bumps, power savings and better scaling and management with recent Linux kernels mean that real-world workloads are going to see 20%+ performance uplift, in general.
It’s pretty shocking that AMD can deliver these kinds of gains on x86 generation after generation.
I was also glad to see DDR5-12800 in our test platforms; much more memory bandwidth is able to reach the cores than in prior generation Zen architectures.
FMA testing
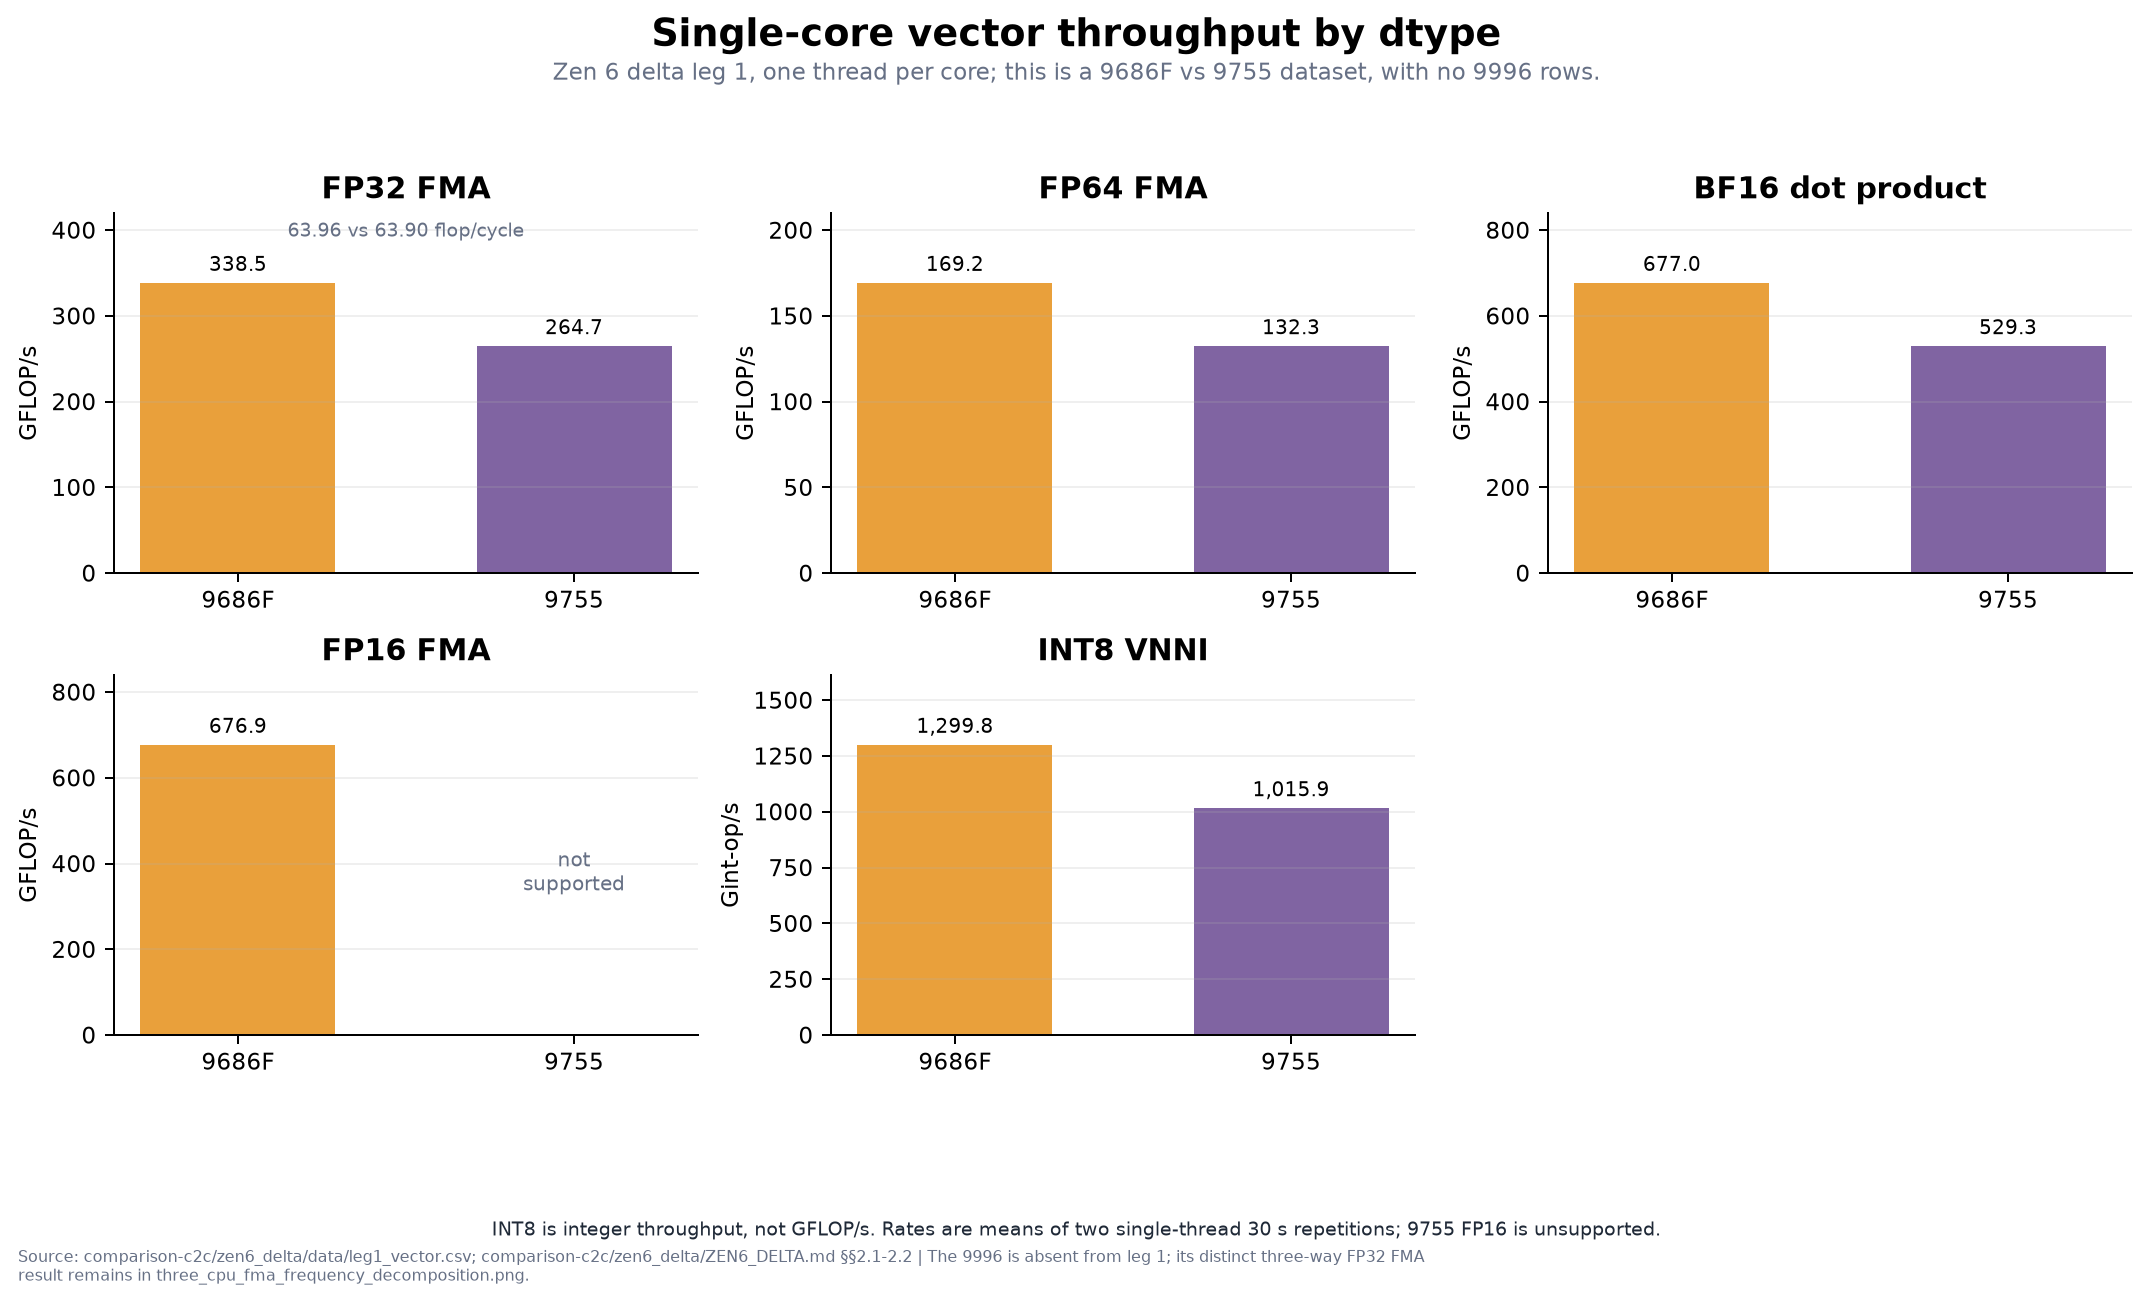
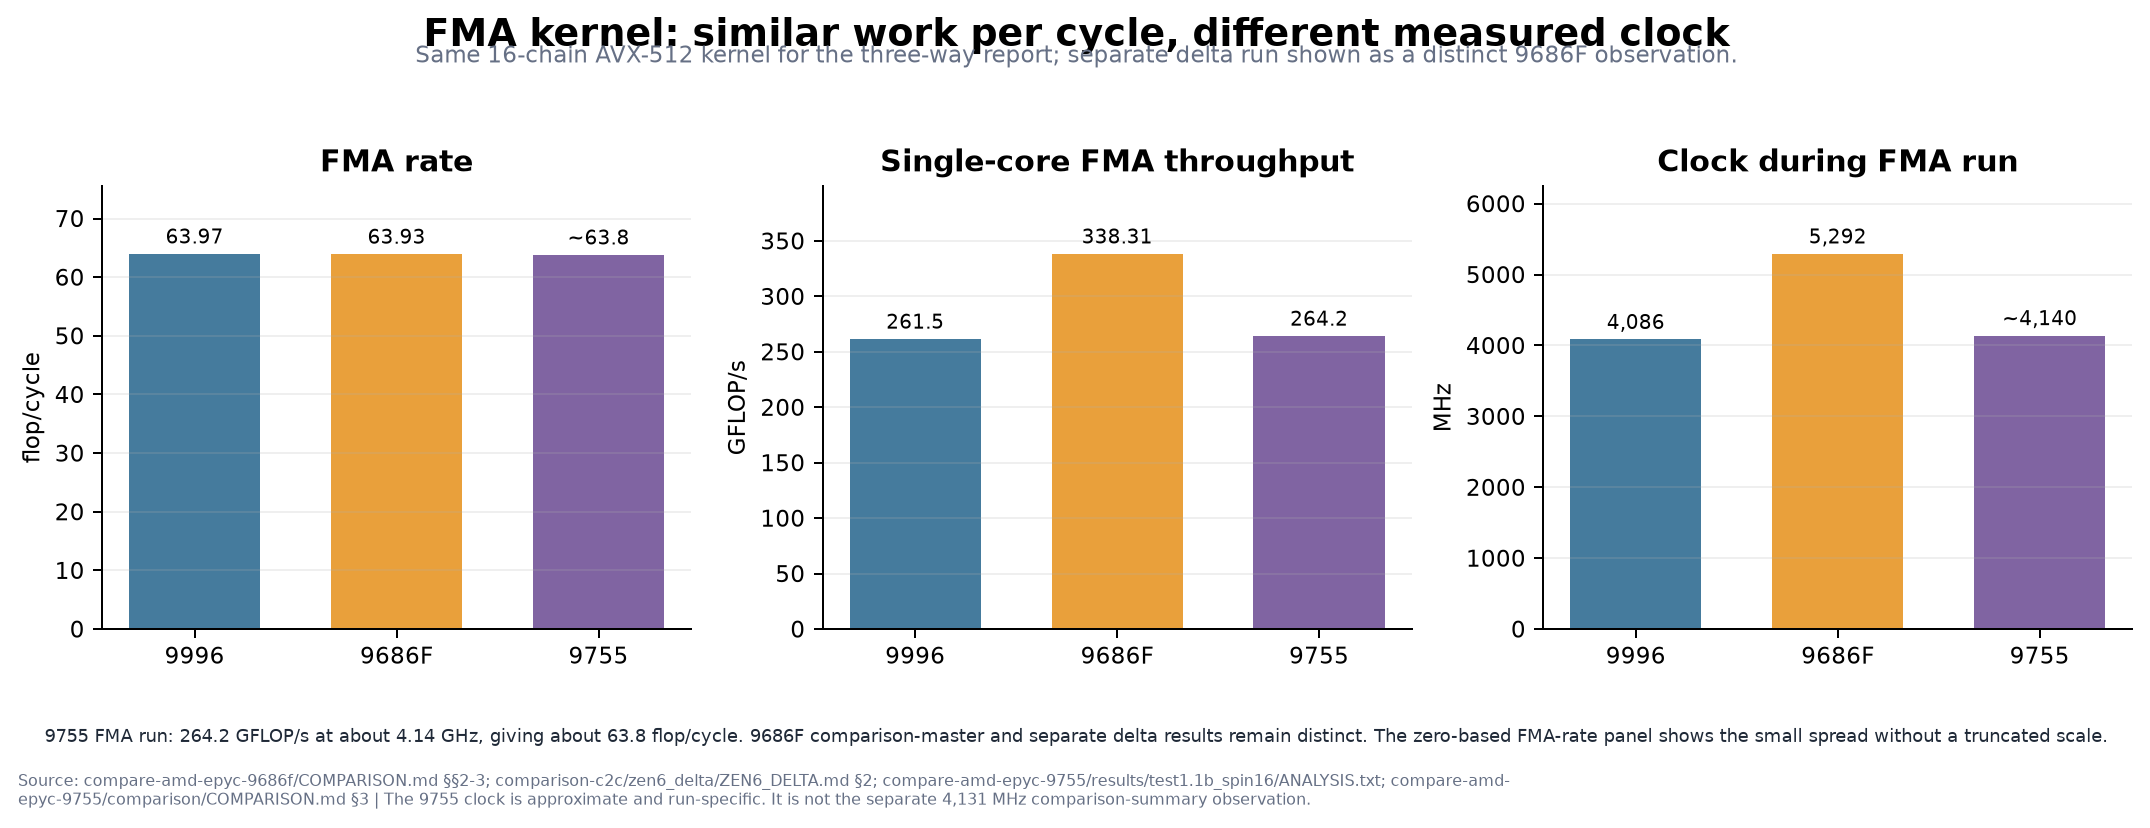
I like to start with the basics. What’re we looking at with FMA!?!?!!?
Core to Core Latency
| C2C class median | 9686F | 9996 | 9755 |
|---|---|---|---|
| SMT sibling | 10.20 ns | 12.92 ns | 23.43 ns |
| Same L3 | 24.00 ns | 35.19 ns | 28.78 ns |
| Cross-L3, same socket | 270.00 ns | 309.01 ns | 121.86 ns |
| Cross-socket | 580.00 ns | 619.59 ns | 205.36 ns |
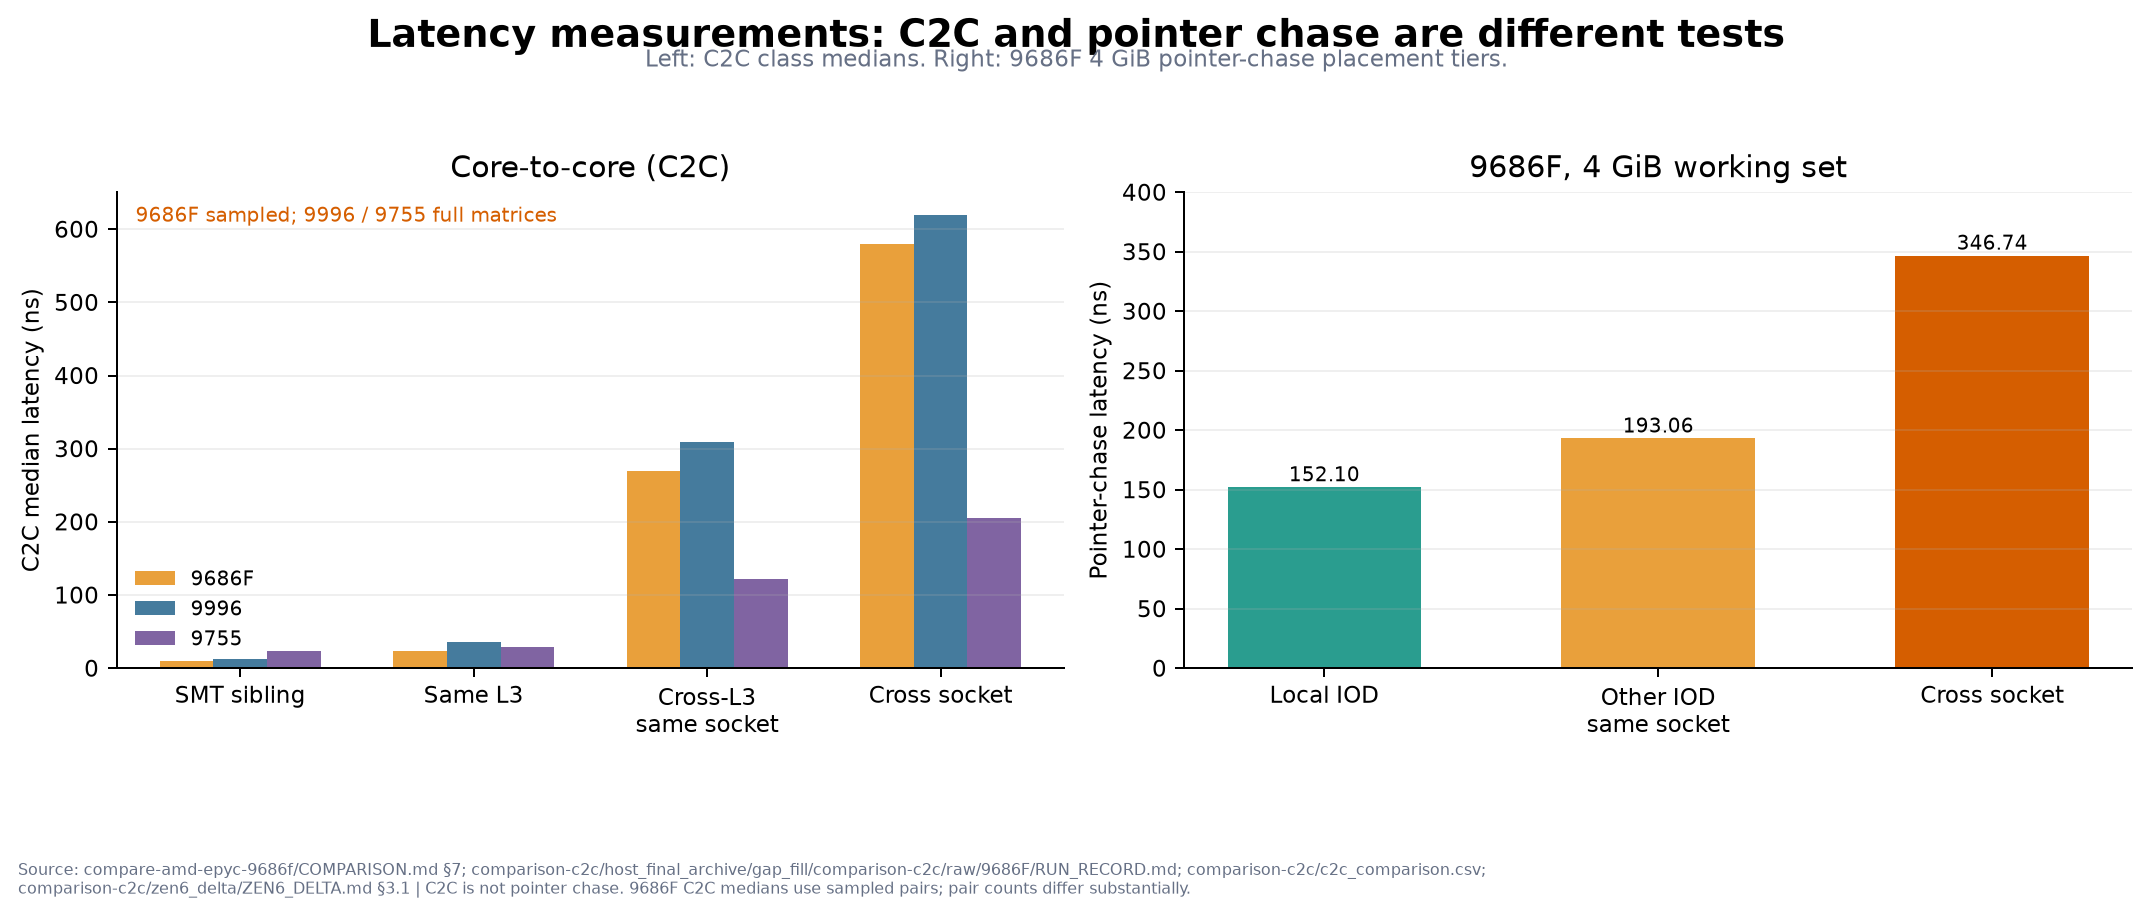
I don’t know if I explained it well enough in the video, but the popular core-to-core latency test on github, I think, sometimes is testing its own c2c artifact. So I built a 4gb pointer indirection chase test to see what that looks like as that looks similar to what I see in Real World ™ applications when debugging perf issues.
The cross-socket xGMI leg provides a bandwidth point, with unequal thread counts. At 96 threads on the 9686F and 128 on the 9755, write throughput was 143.7 versus 103.9 GB/s, a reported 38.2% difference; copy was 148.7 versus 109.5 GB/s, or 35.8%. The leg contains no read measurements. These results therefore do not describe a thread-matched xGMI suite, and they cannot be used to claim a read advantage.
This is the whole “core to core latency test” vs “4gb pointer chase” test. Cross-socket “real” latency was 346 nanoseconds vs core 2 core latency checker showing massive latency spikes going cross iodie or corss socket. Is this some clever look-ahead AMD is doing, is the core to core latency the real worst case scenario? I’m not sure. Real-world testing with real-world apps is closer to the 400ns figure not 600ns fwiw.
Bandwidth: Channel ramp on NPS1 vs NPS2
The 9996’s single-socket STREAM triad result is 1,207.2 GB/s;
On the 9686F, a node/channel read ramp reached 667.1 GB/s at 8 channels and 96 threads, but this was a single 120-second interior hold.
The separate 9686F NT-store triad reports 1,277.6 GB/s of actual traffic, while its normal-store triad reports 962.4 GB/s on a 3N basis, corresponding to 1,283.2 GB/s of 4N traffic after read-for-ownership.
For comparison. the 9755’s single-socket triad was 339.5 GB/s, but more bandwidth was reachable via NT-store…
NPS1 versus NPS2 is the most informative NUMA comparison because it holds the CPU and physical memory channels constant. The 9686F has two IODs, each with eight channels. In NPS2, the two IODs remain separate NUMA nodes per socket; in NPS1, the operating system sees one NUMA node per socket. The silicon and two eight-channel groups are still there and software loses some visibility into that intra-socket boundary.
On the same host, in the same NPS2 versus NPS1 comparison, LLVM Ninja builds were 9.22% slower in NPS1 versus the original NPS2 session. In the NPS1 session, it warmed over the 15 runs we put it through: by the end of the run NPS2 was just 5.01% slower. Not every workload “settled” in this way though, I just thought this was interesting.
SQLite was 17.17% slower in the NPS1 comparison, but I’m not 100% sure it is clean evidence of a CPU or NUMA causal penalty. It is included as a warning that system configuration matters.. Know Thy Workload. (This was out-of-the-box testing with Phoronix Test Suite mainly…)
In the pinned constant-channel matrix, the 16-channel read changed by -0.40% at 96 threads and -2.38% at 192 threads; 16-channel NT triad changed by -0.02% and -0.03%. The same report says all socket-local and both-socket rows were within 2.4%, and most within 0.7%. By contrast, unpinned PTS STREAM triad testing moved -4.34%. Some scheduler-sensitive workloads therefore moved even though controlled channel-preserving bandwidth was largely stable. This is probably because something didn’t have clear visibility into thread/memory locality and some traffic was going cross i/o die. Cross i/o die in the same socket doesn’t seem to be as much of a penalty as I was expecting, especially for workloads that aren’t latency sensitive.
Power and clocks under load, also featuring kcbench testing
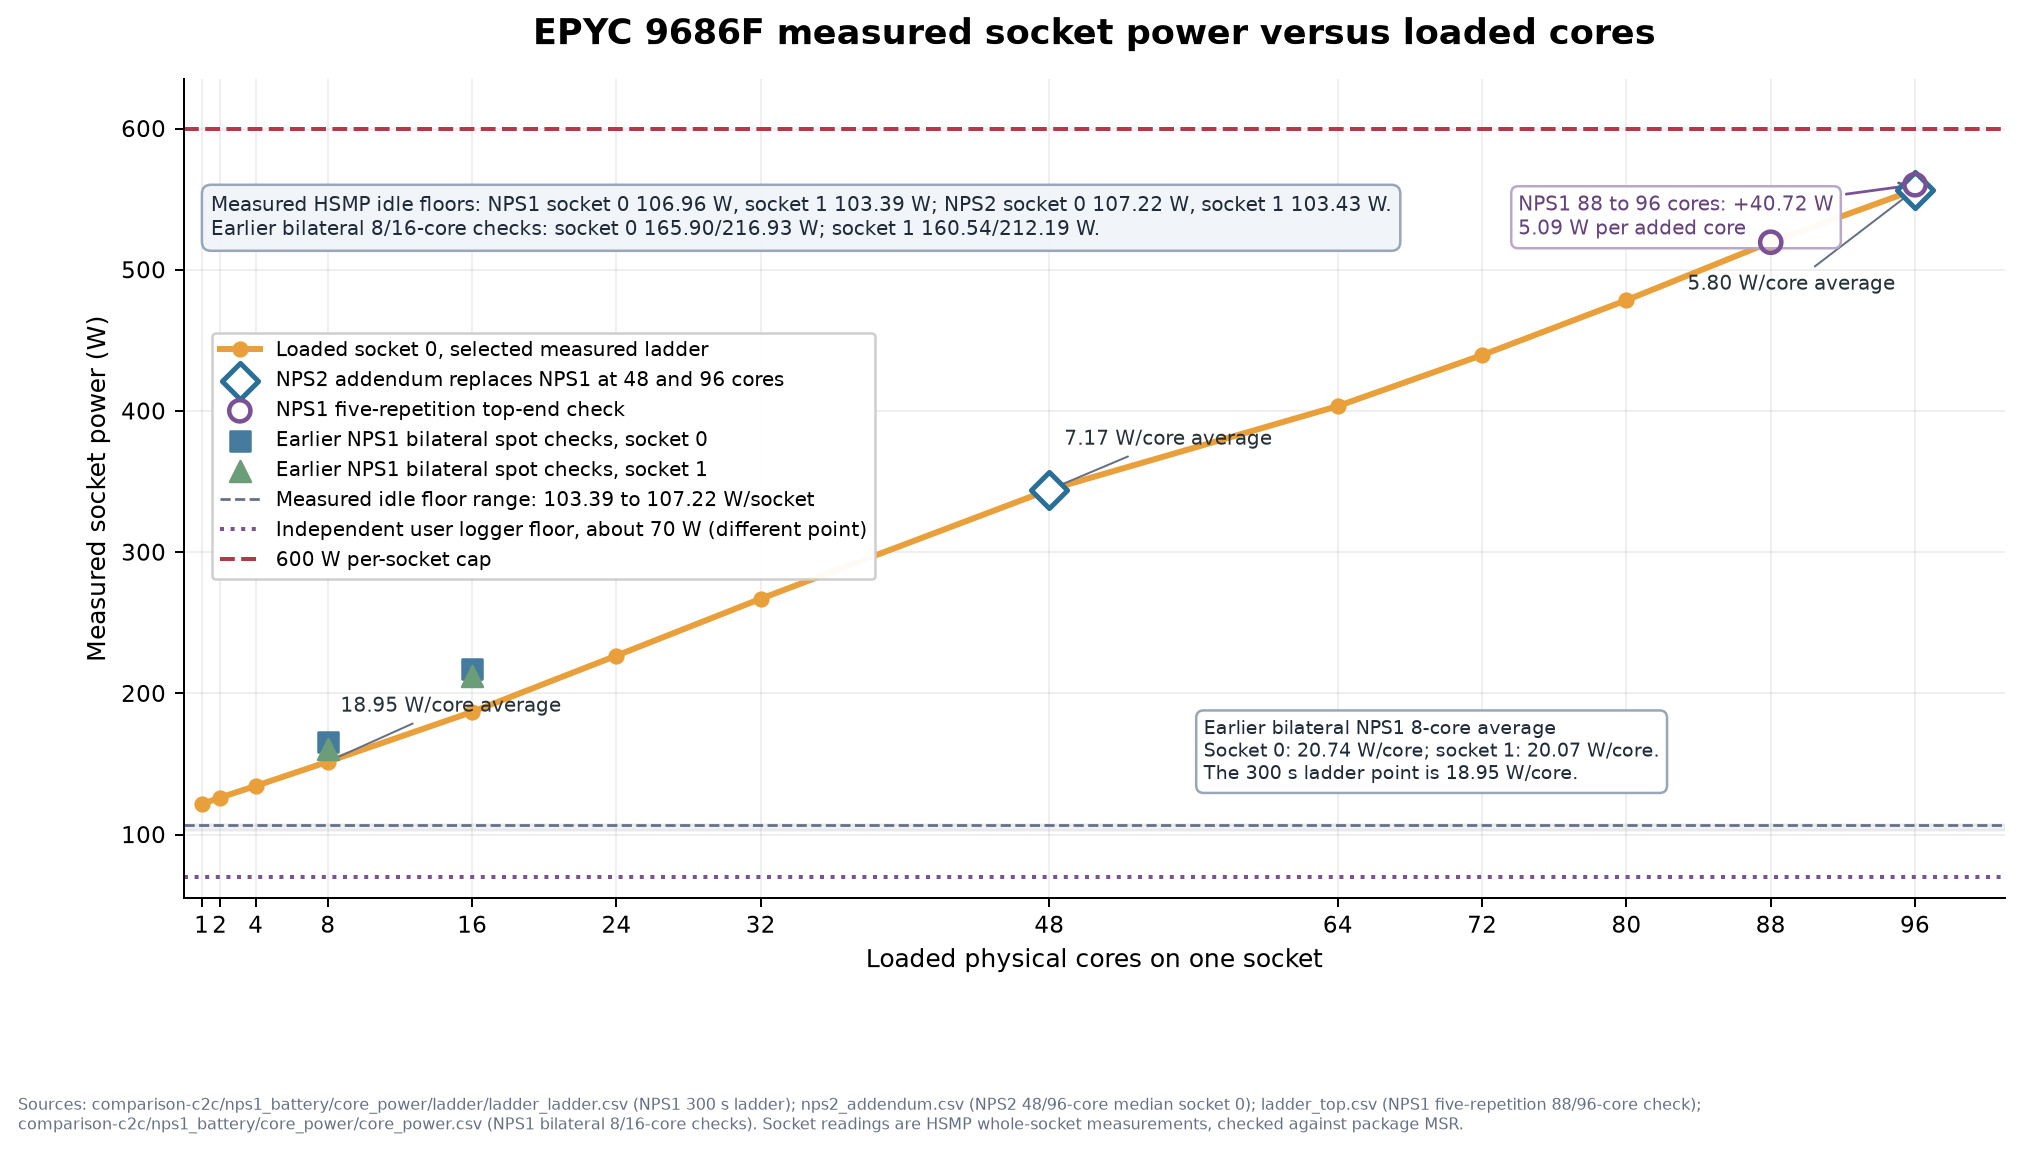
Total power per core as we increase loaded cores
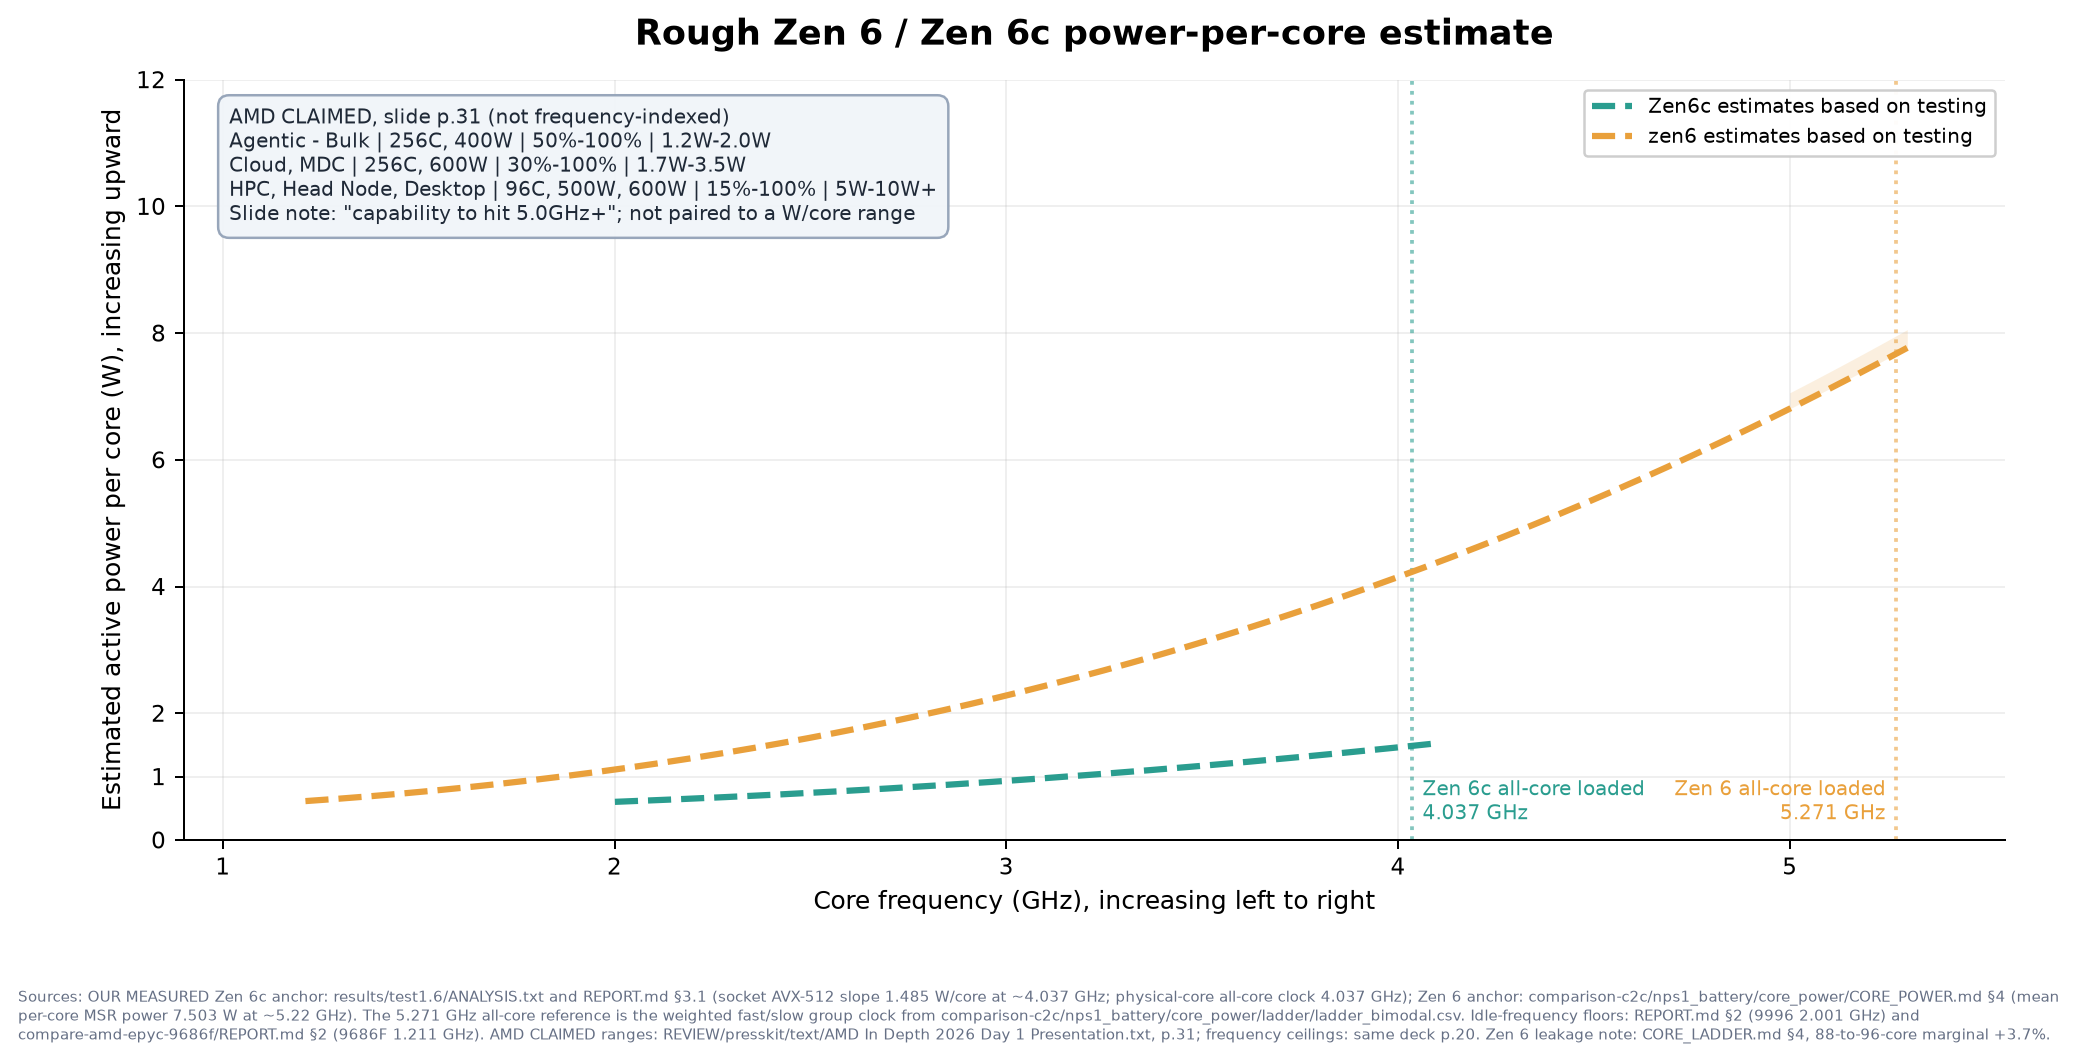
watts per core estimate (not including system or iodie power)
The 9996 and 9686F power results are interesting. On the 9996, I experimented with a several different approaches and decided on a socket-level AVX power ladder. I fit that as 153.2 W plus 1.485 W per loaded core, with R² of 0.9994. That is the best model fit to socket-level power I could do, not a direct per-core rail telemetry reading. At 256 loaded cores the reported socket result was 531.2 W.
The 9686F power campaign separately used per-core MSR energy and checked package MSR readings against HSMP socket readings. (I just didn’t have enough time with the 9996 to get more done…) At 8 to 16 loaded cores it estimated 7.12 to 7.68 W per loaded core around 5.21 to 5.29 GHz. I was also able to reconcile this by monitoring power usage from the PDU.
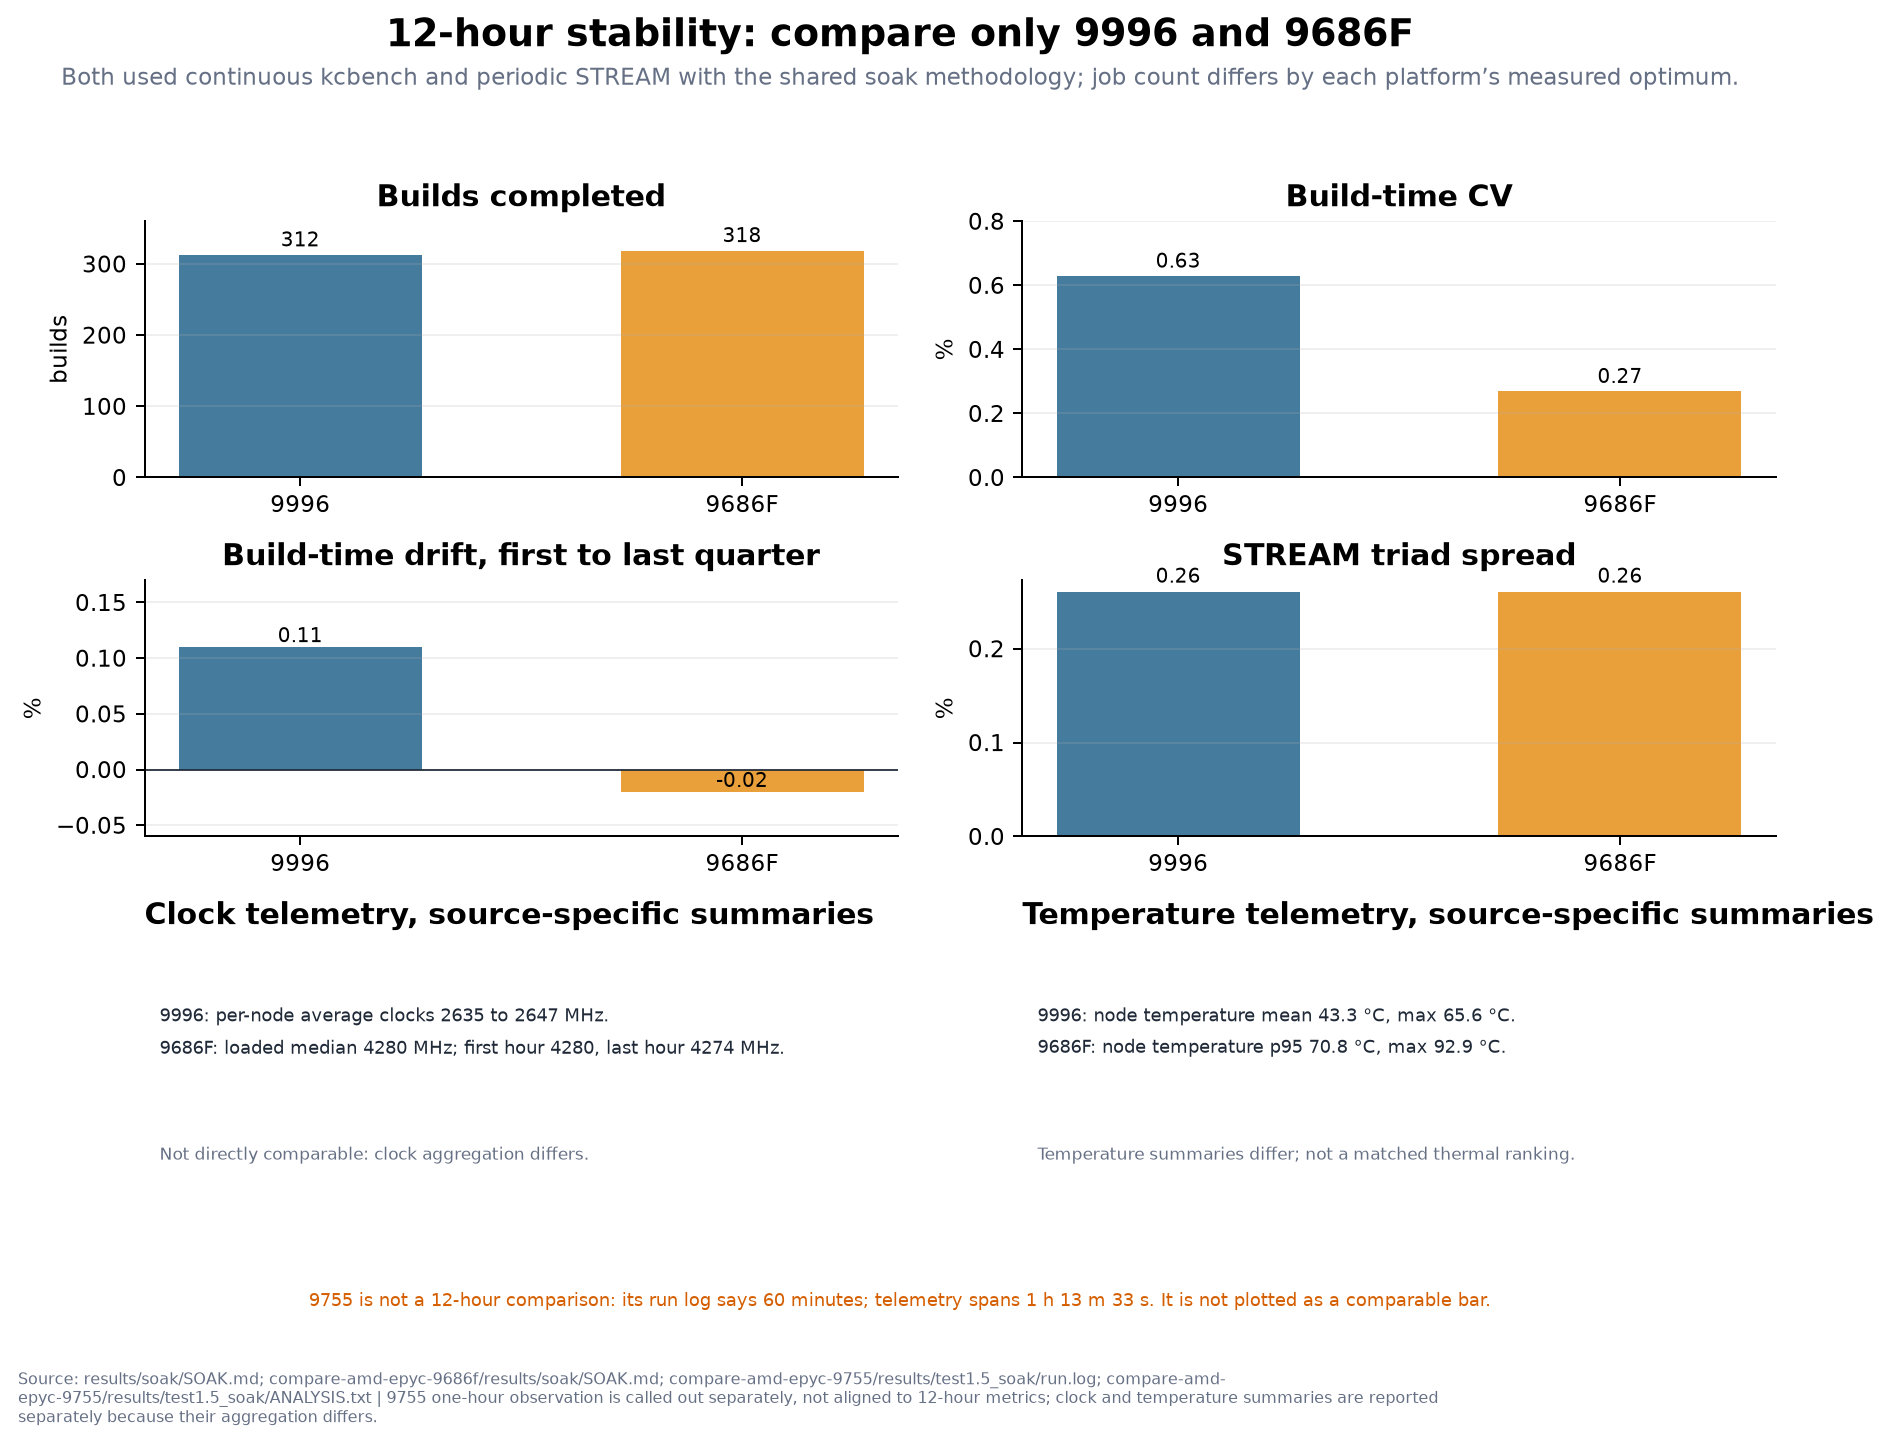
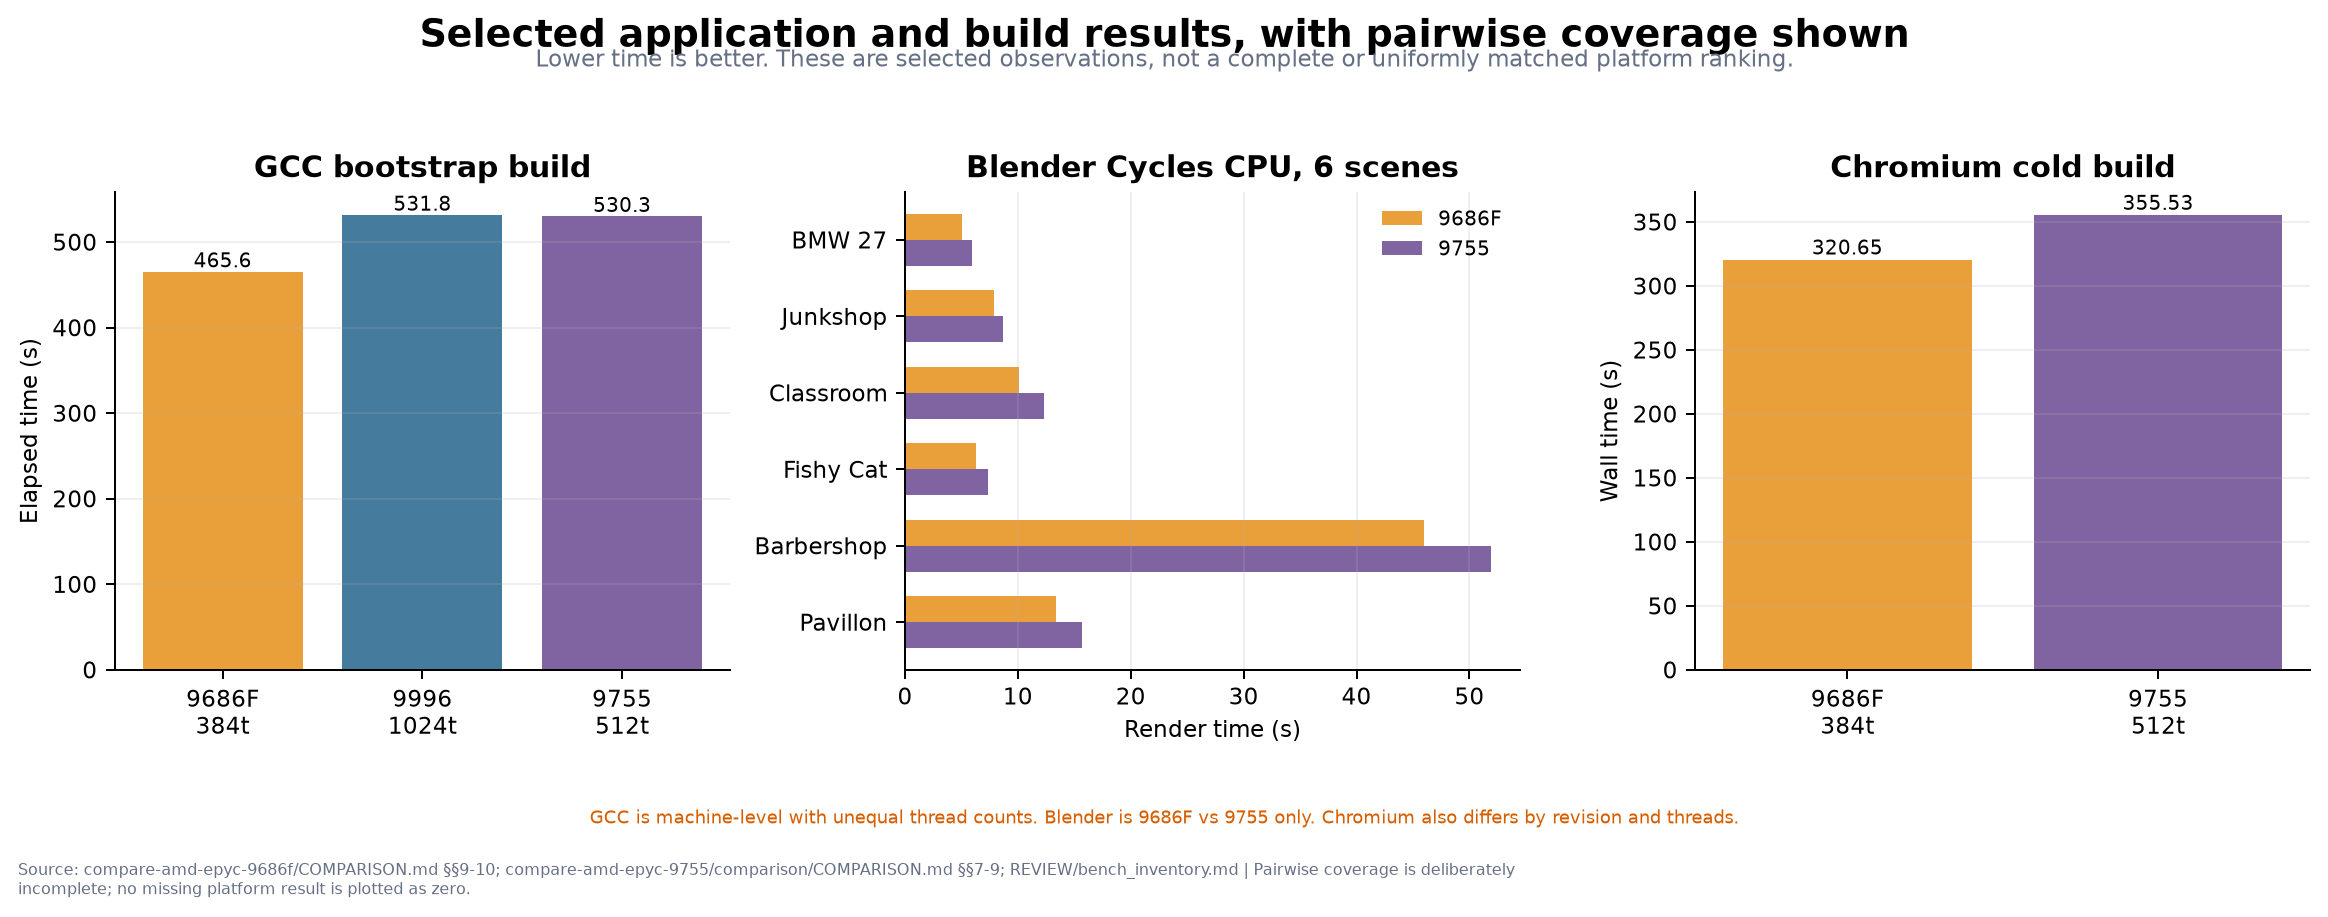
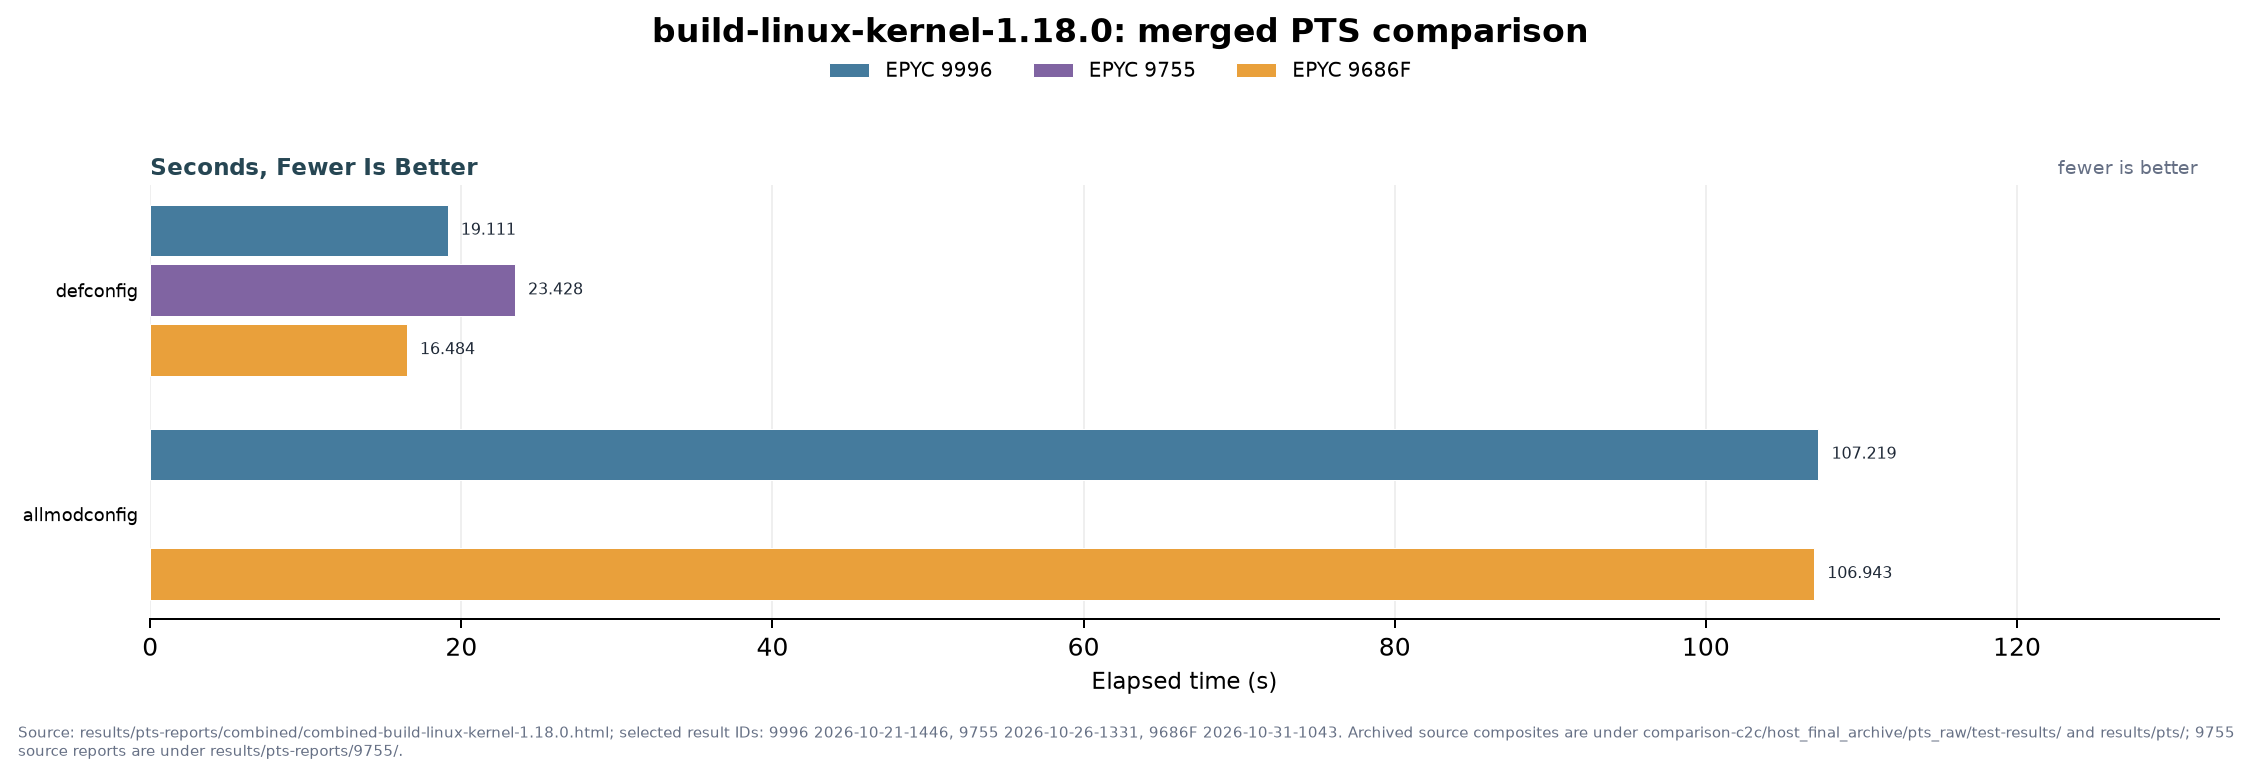
The 12-hour 9996 build/STREAM run completed 312 builds, with 0.63% coefficient of variation and +0.11% first-to-last-quarter drift. The 9686F run completed 318 builds, with 0.27% CV and -0.02% drift. This was an allmodconfig build plus 32 GiB STREAM triad blocks every two hours (with the telemetry). The job counts differ: -j535 on the 9996 and -j384 on the 9686F, which were from doing sweeps of -j to find the optimum on each box.
kcbench numbers
Persistence run Duration and outcome Limits
9996 12-hour build/STREAM soak; 312 successful builds; 0.63% CV; +0.11% drift Stability evidence for the recorded procedure, not a general reliability guarantee
9686F 12-hour build/STREAM soak; 318 successful builds; 0.27% CV; -0.02% drift Logger max-clock glitch disclosed in report; do not rely on peak readings
The 9755 (2x128c Zen 5) kcbench allmodconfig was about ~234 (for comparison).
Moar benchmarks!!
These are summarized from the Phoronix test suite I ran
Memory
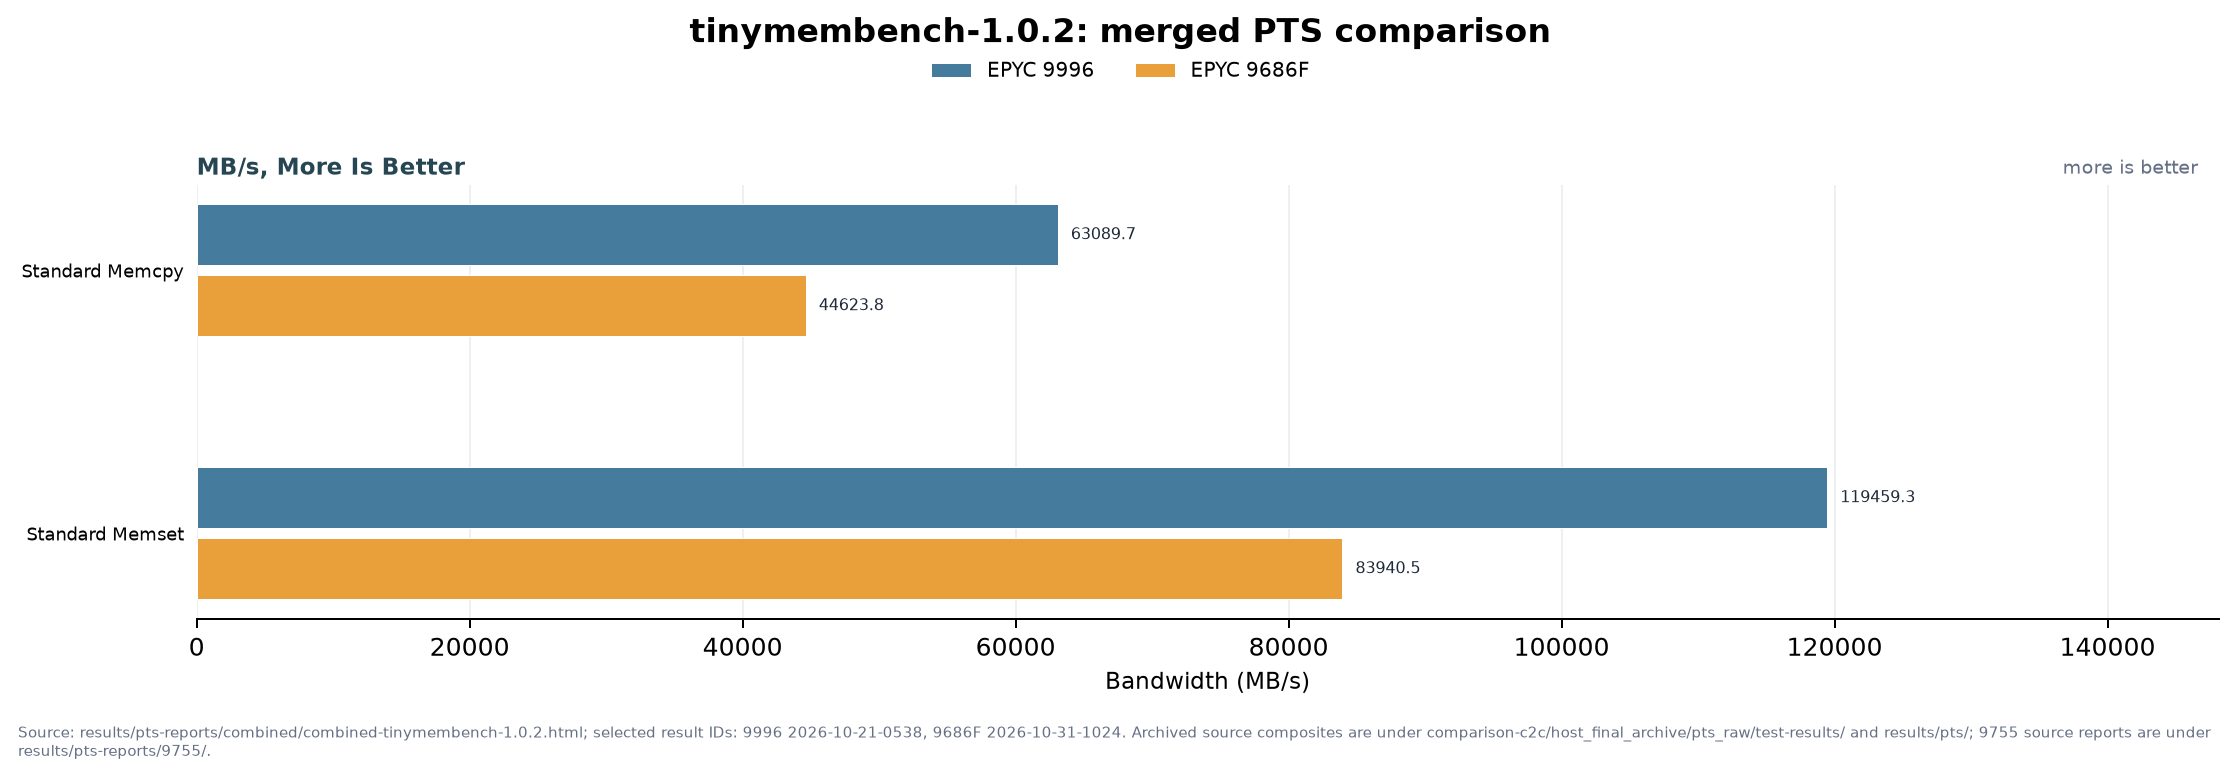
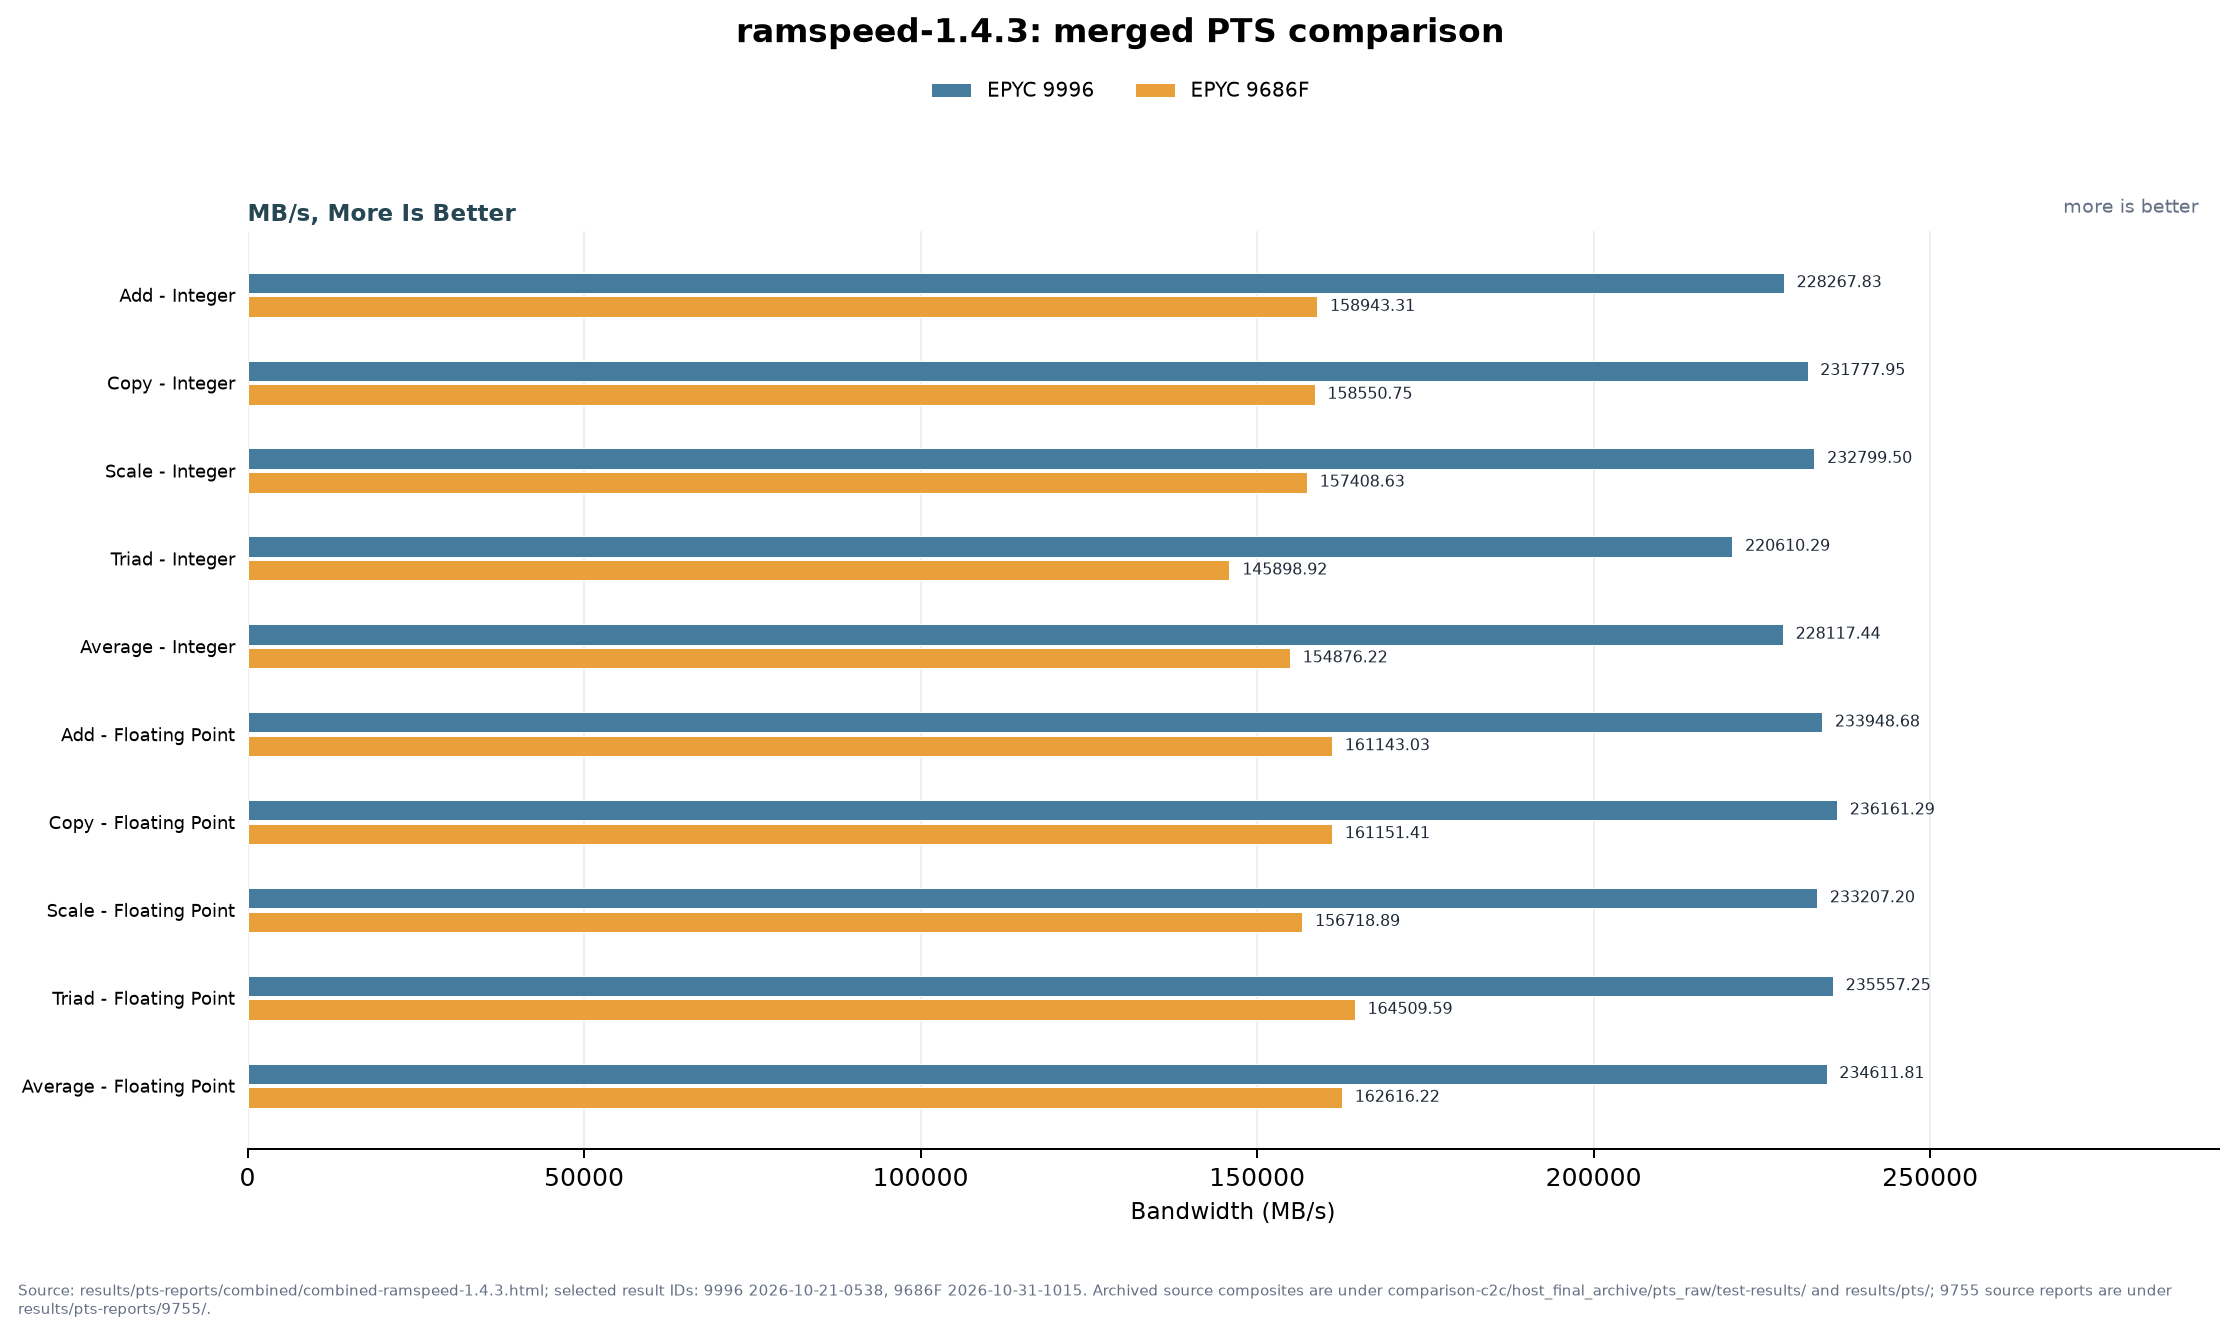

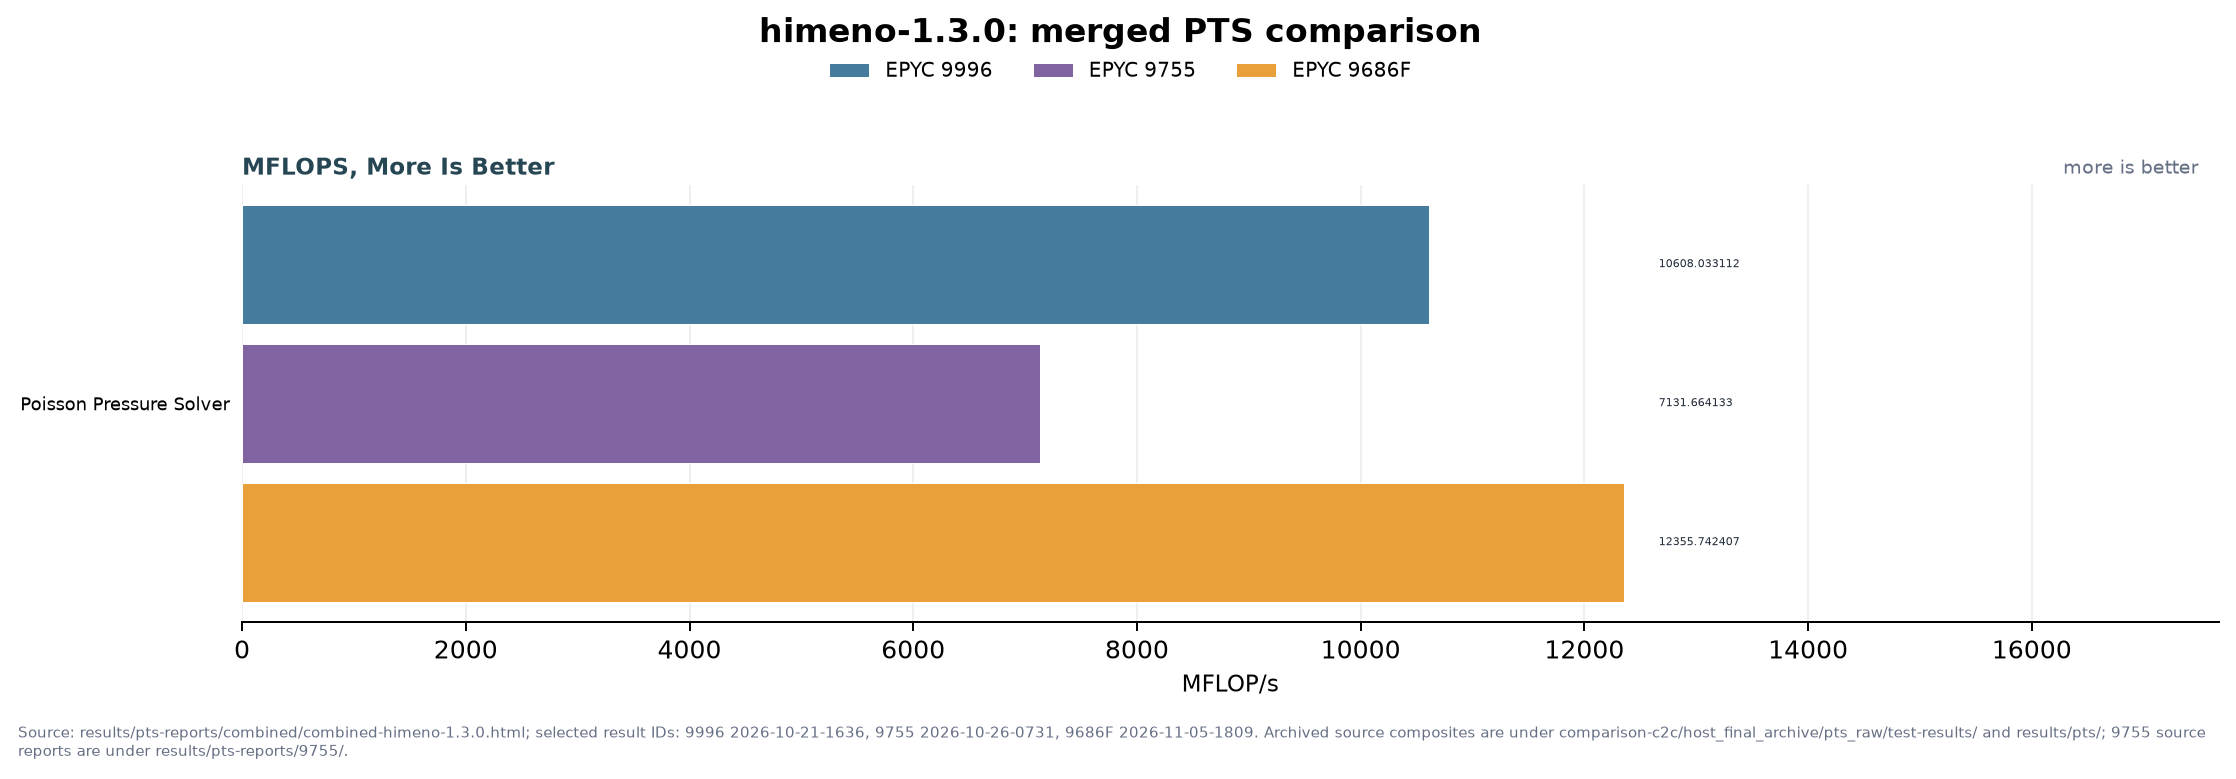
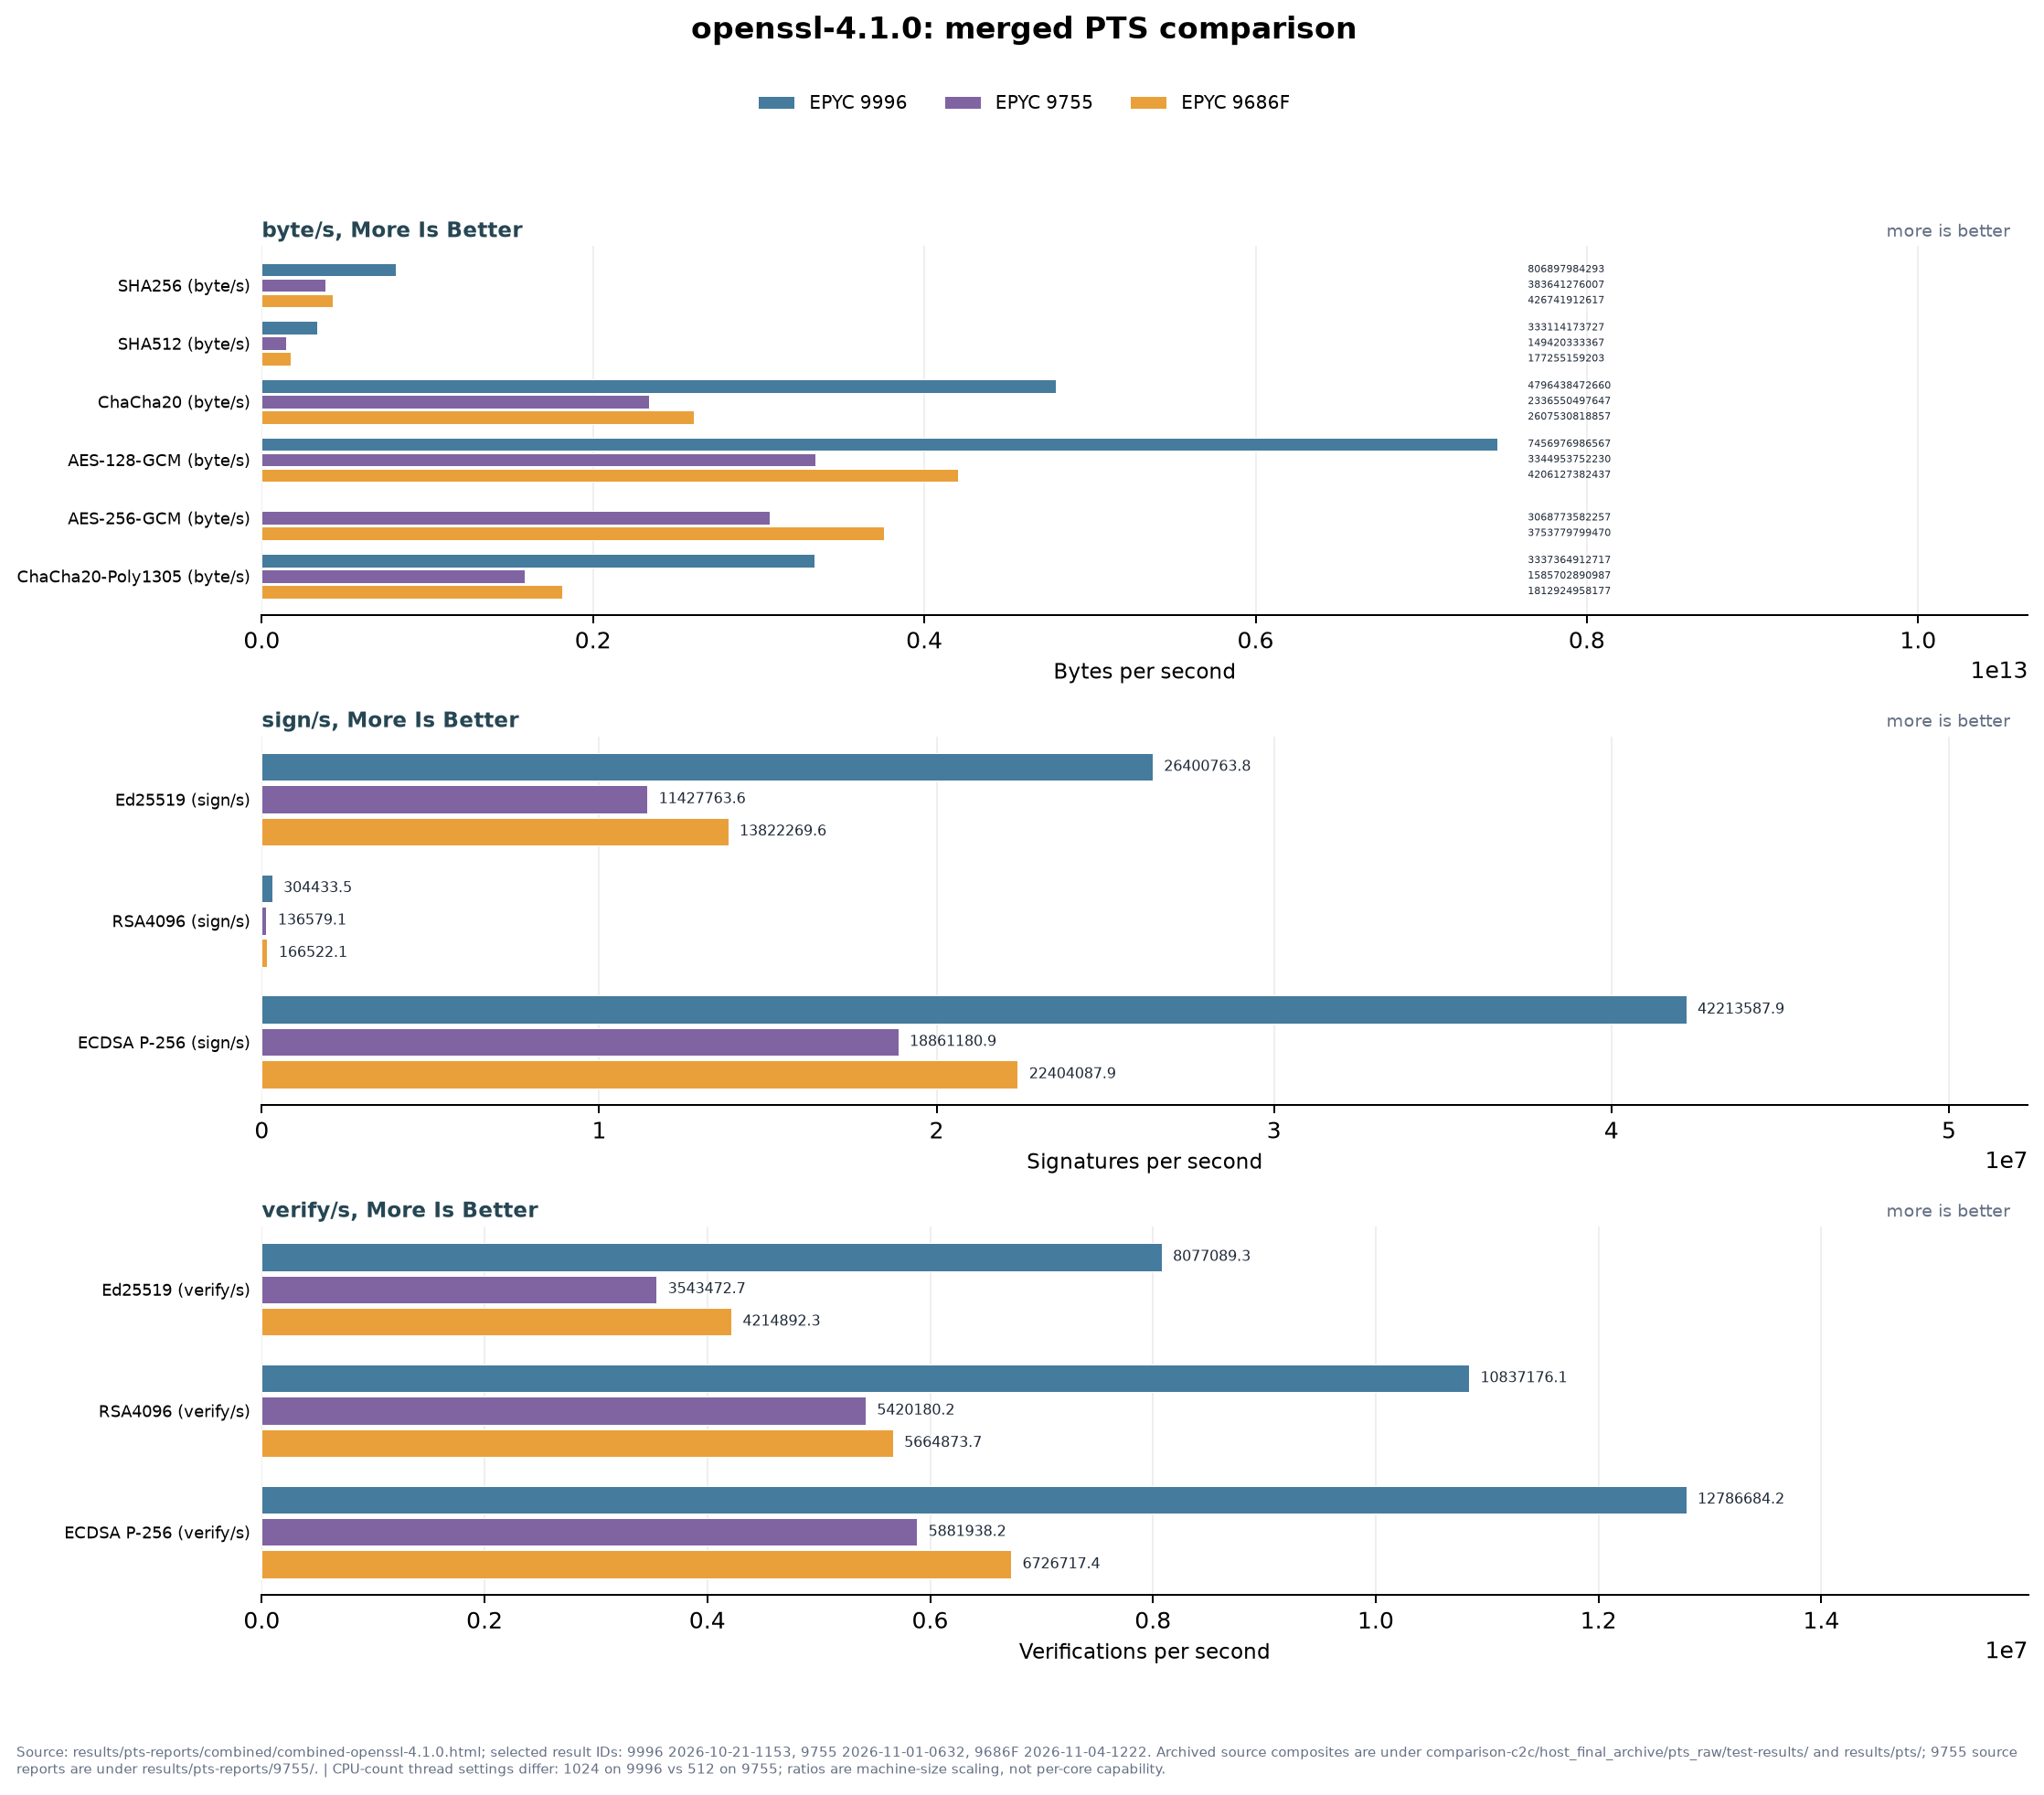
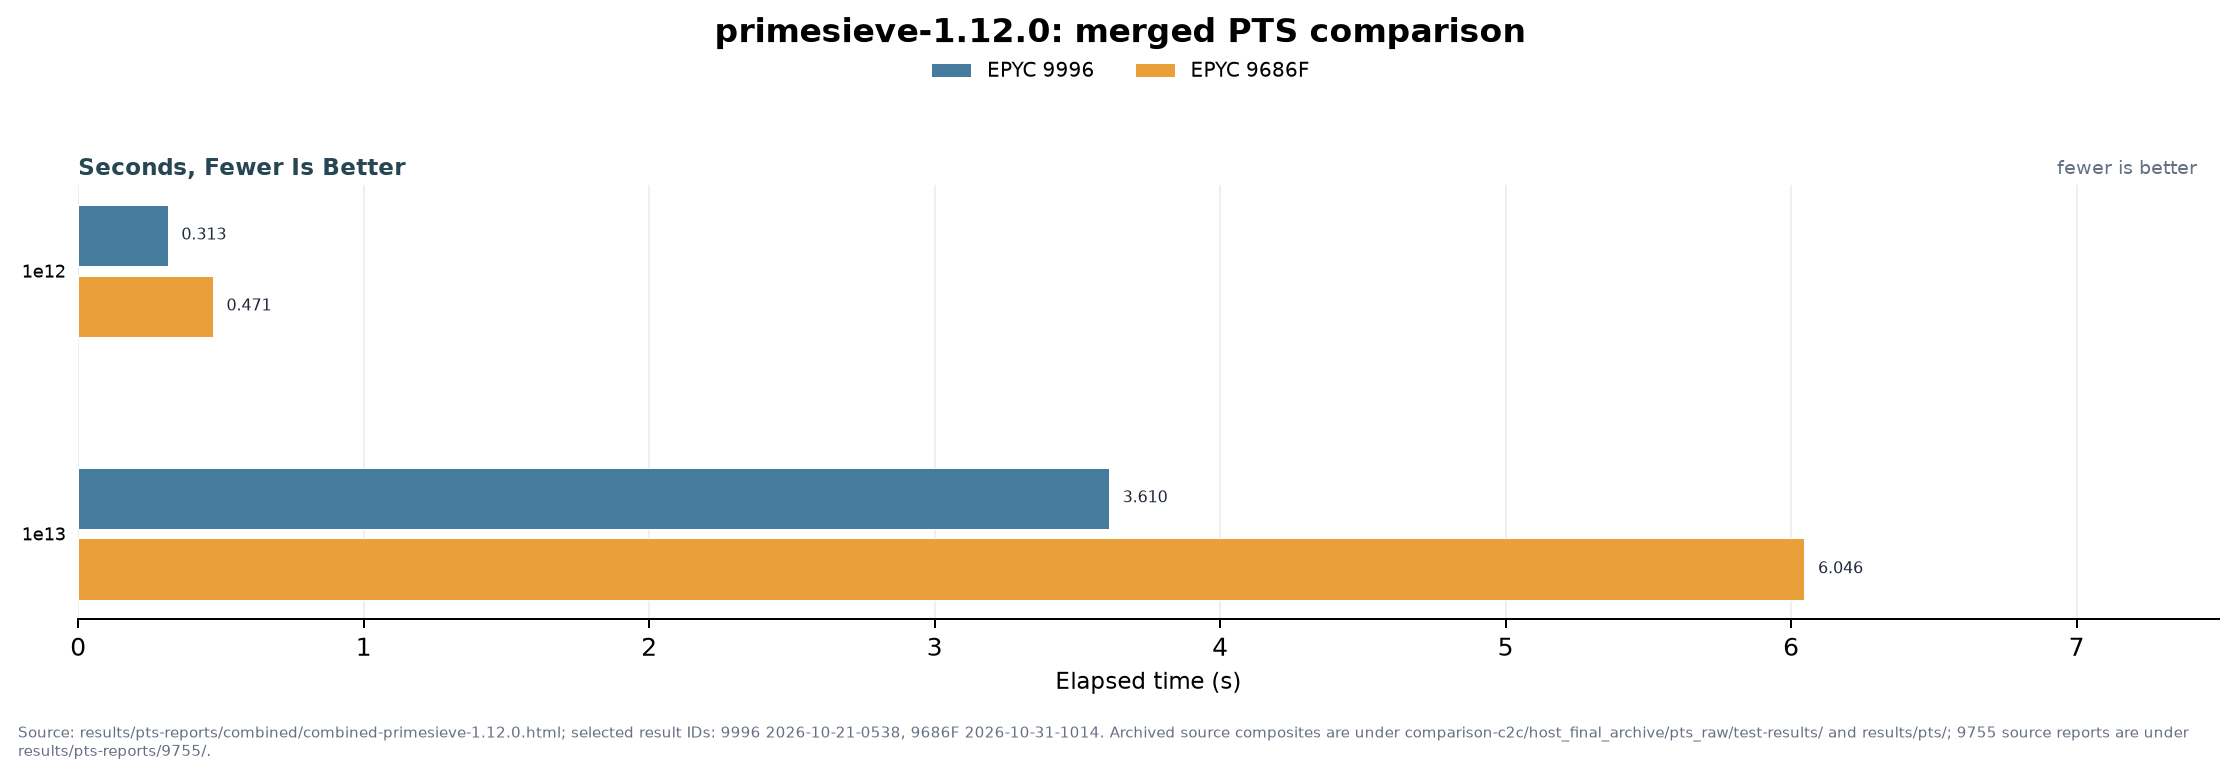
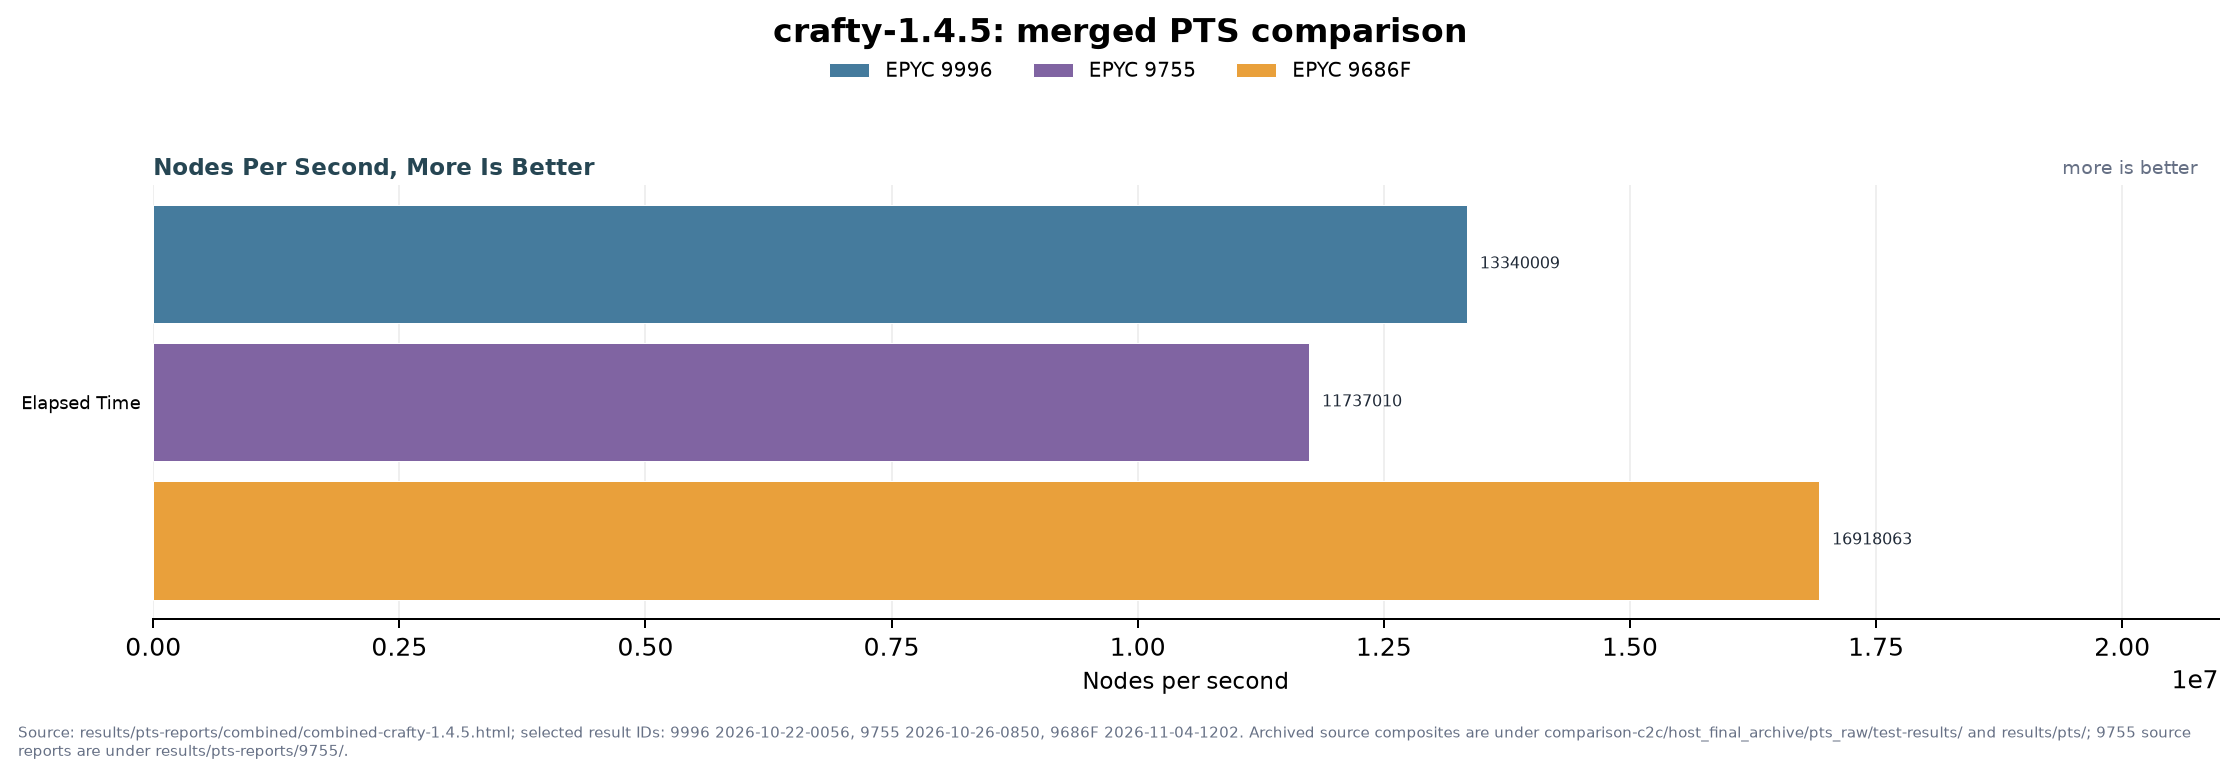
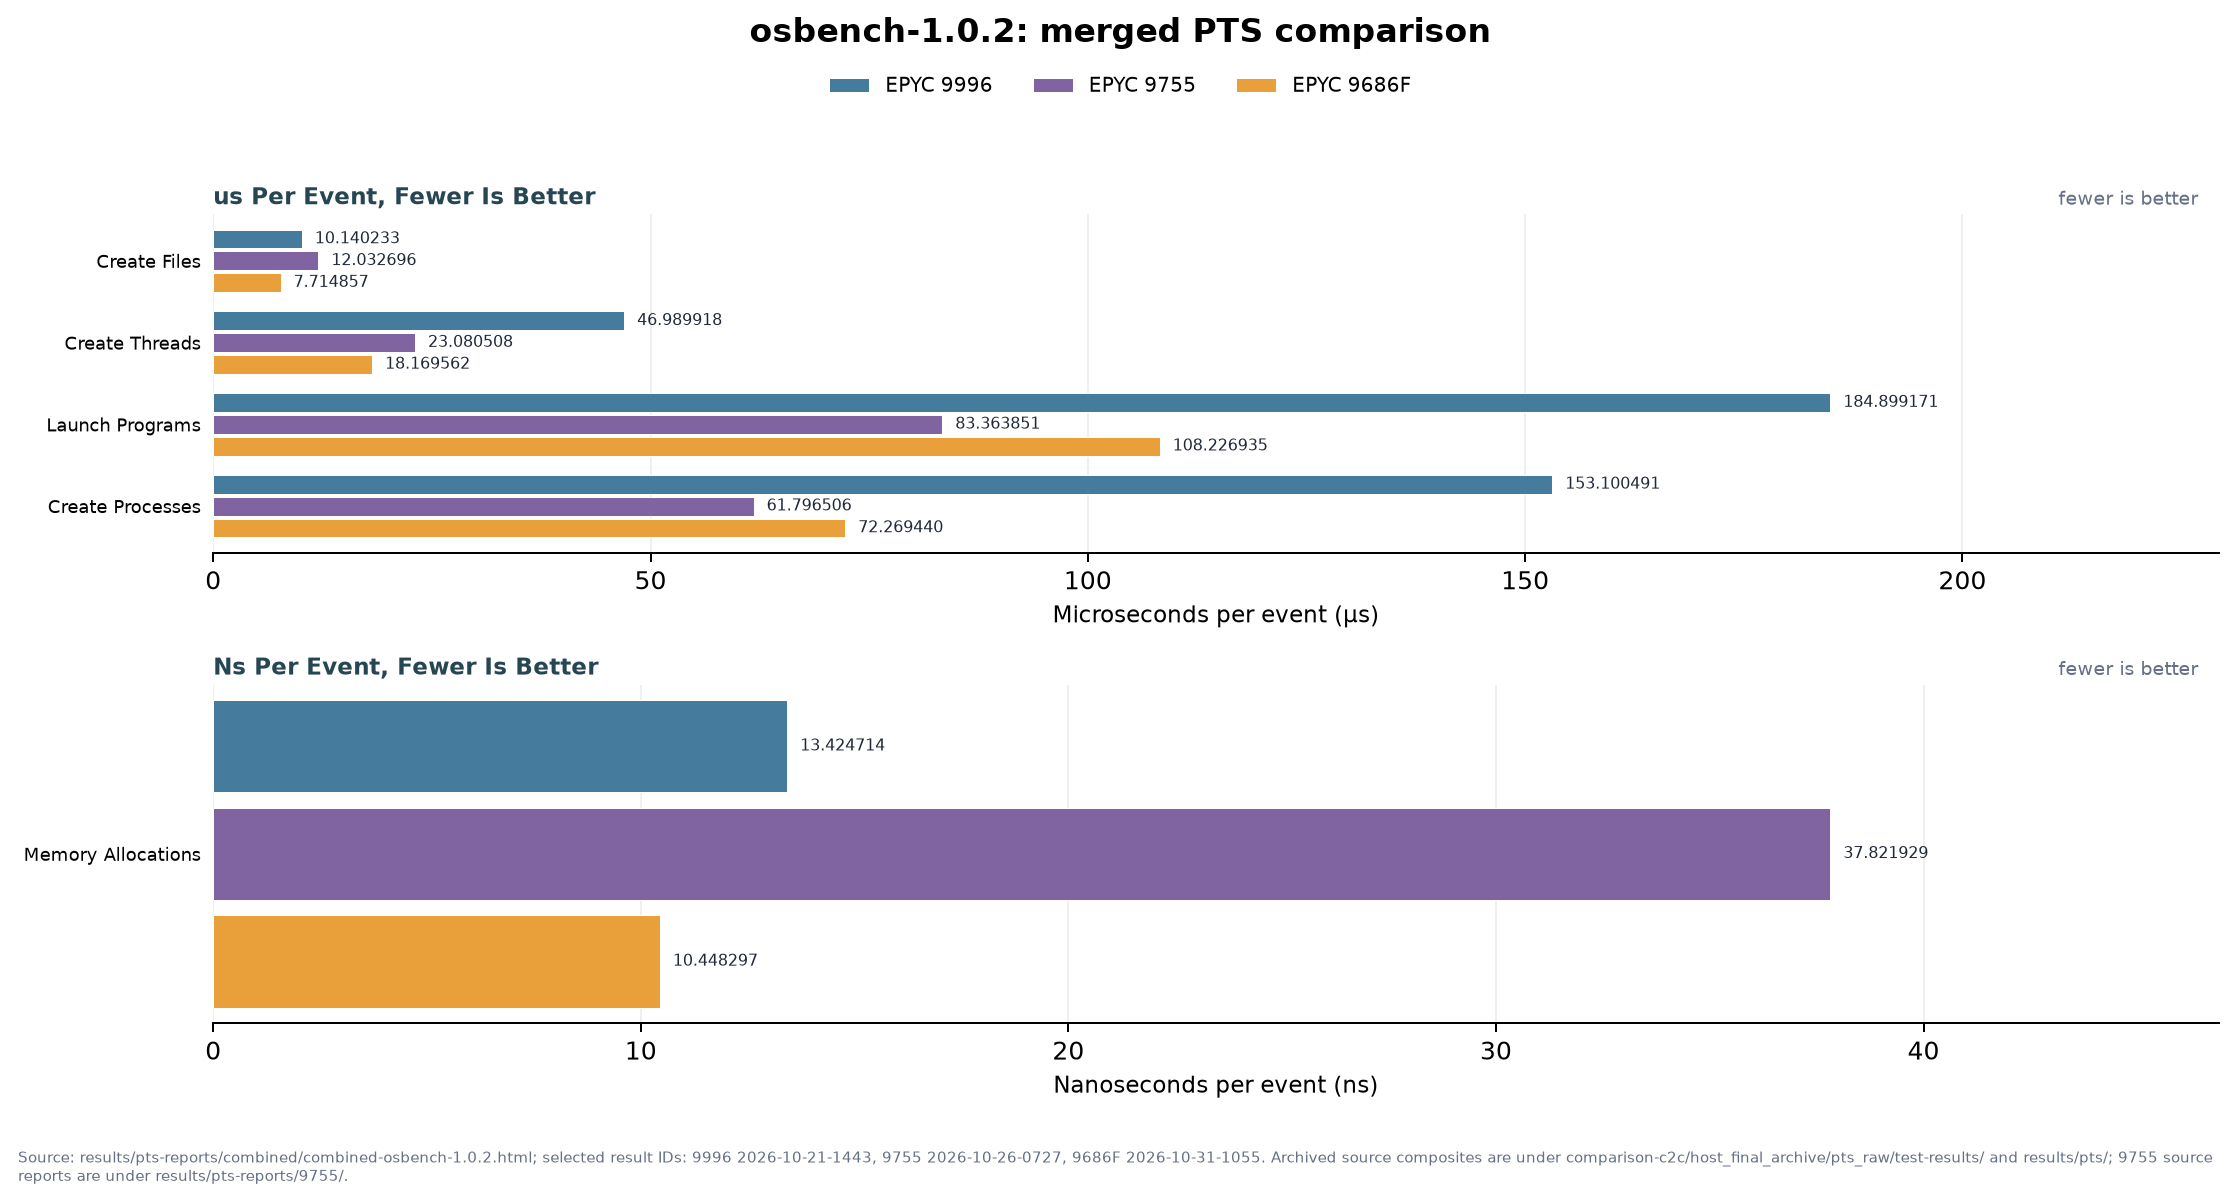
This one was interesting in that the “create thread” time delta here was maybe because the system wasn’t super heavily loaded… heh
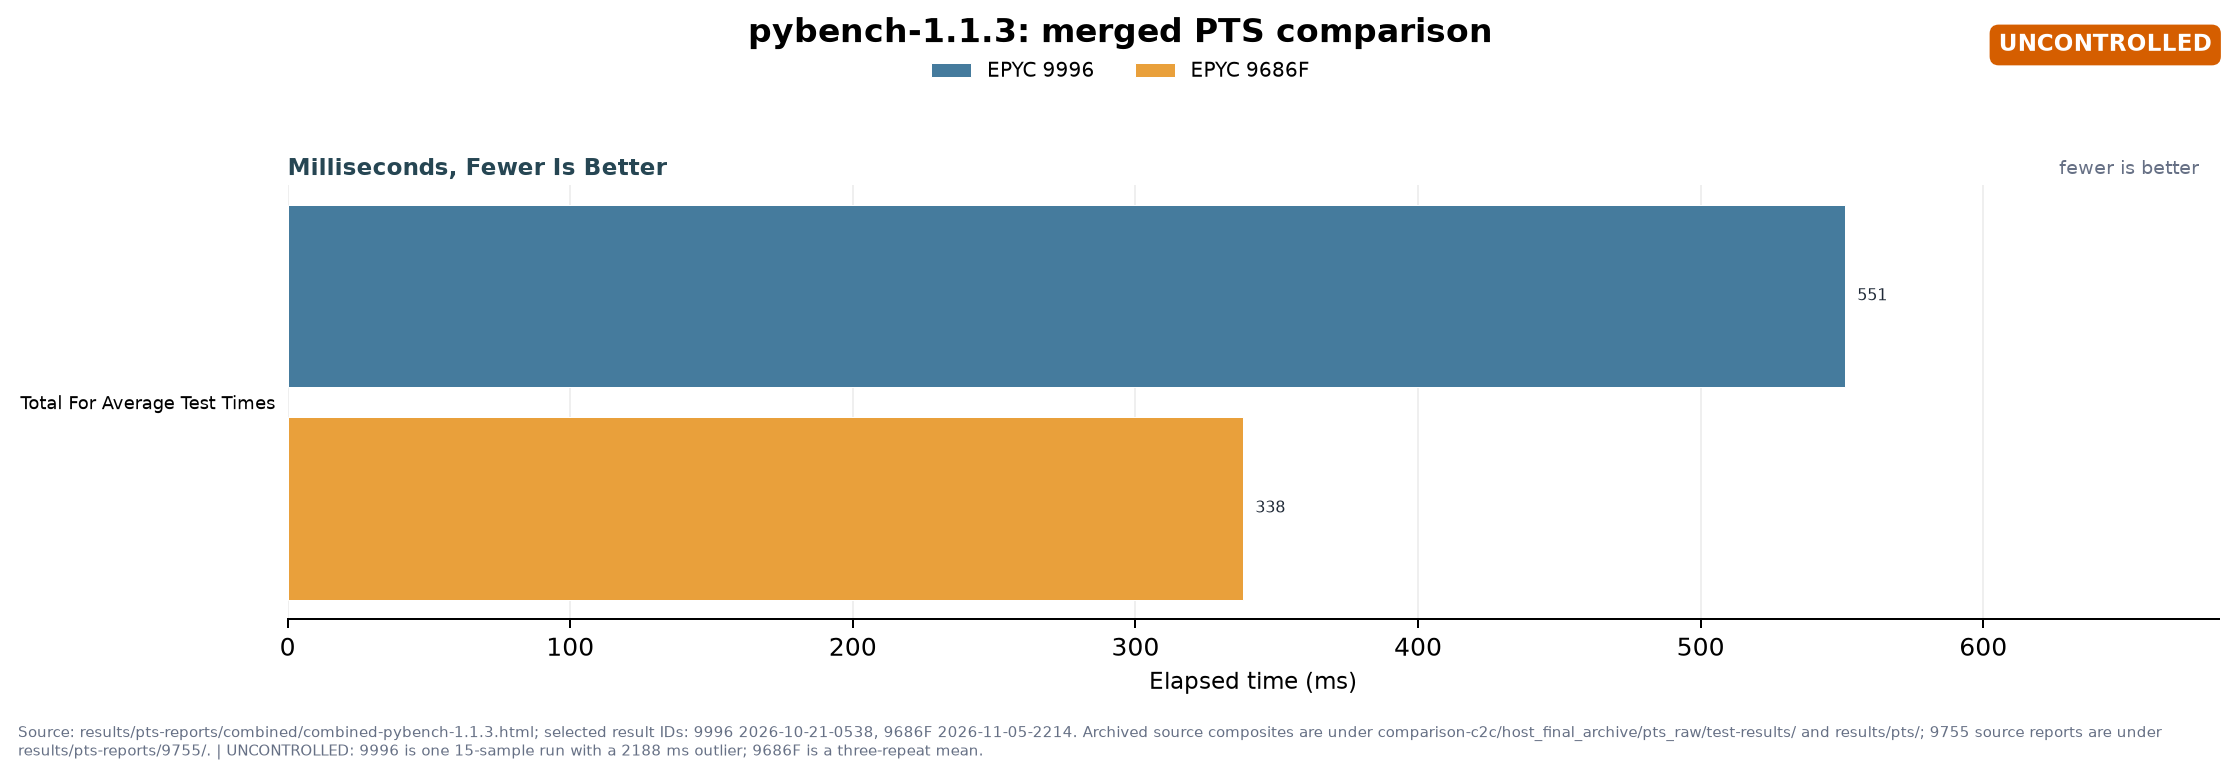
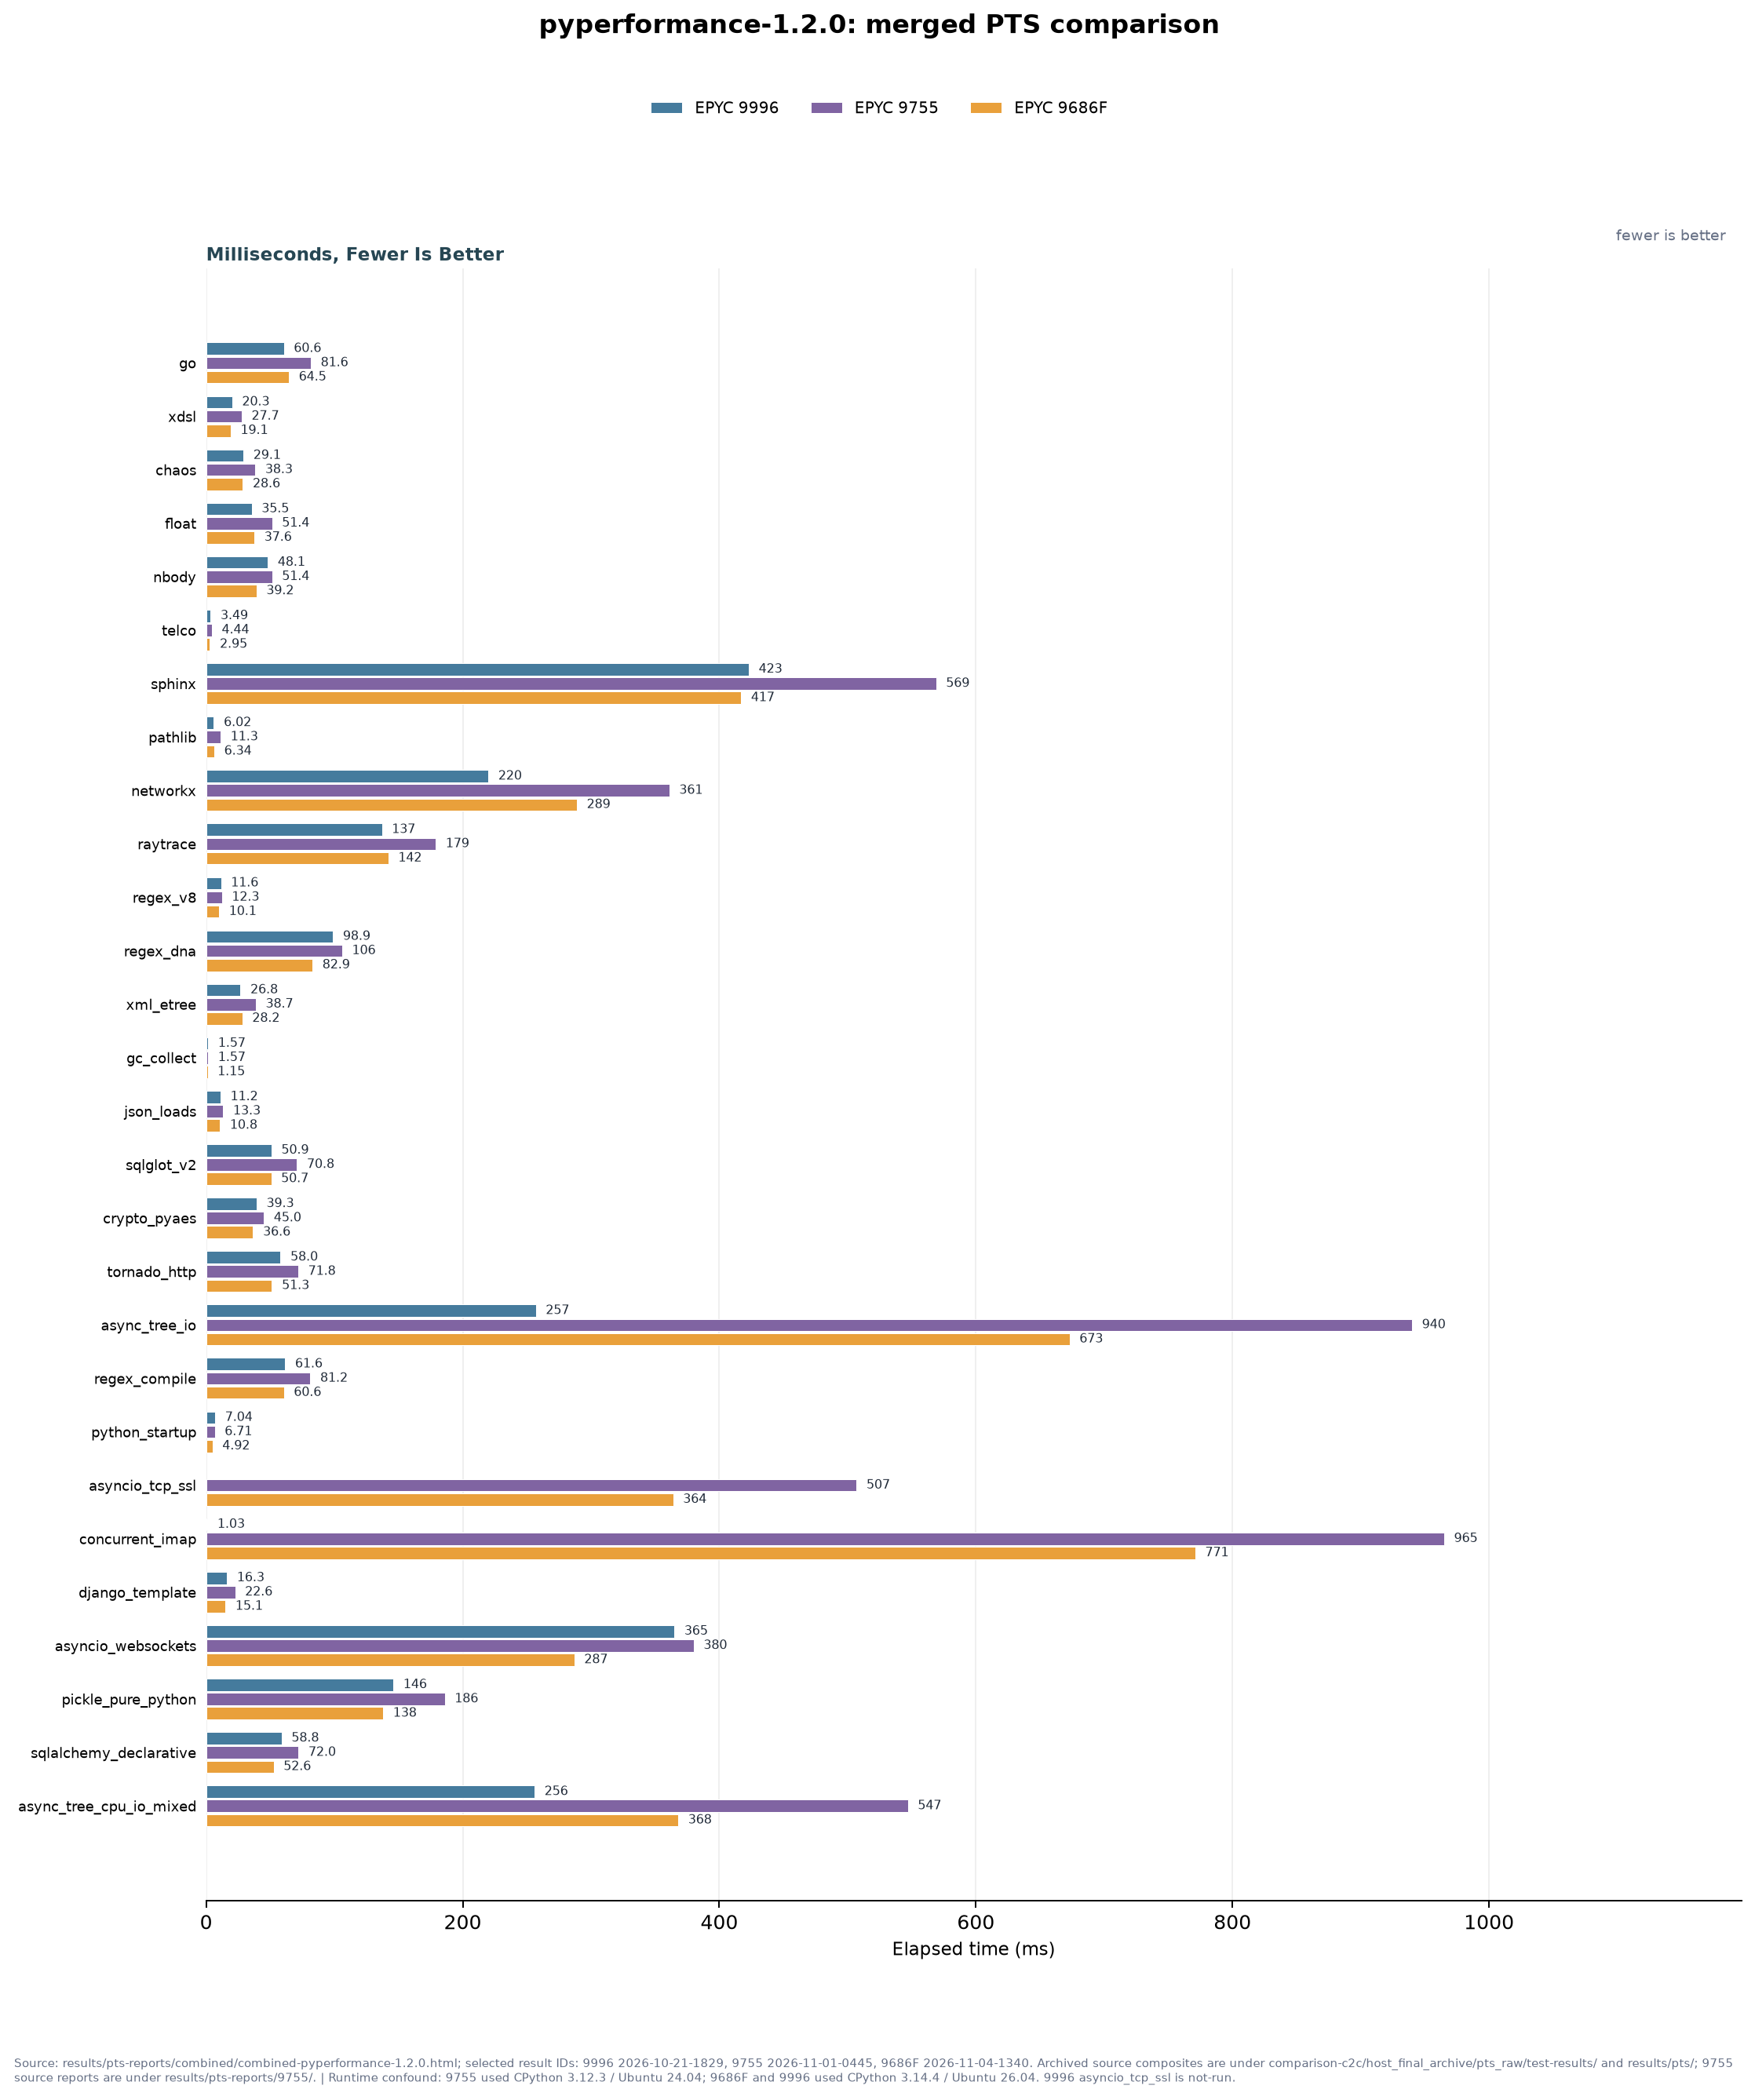
Python!
CPU Inferencing??!?

As I said in the video.. useful for research purposes. The “tile” based math instructions that AMD and Intel are working on together for next generation look very promising.
The AVX512 speedups on Zen 6 are very VERY nice.
MEXT on the menu
MEXT up I want to test.. MEXT.. haha. Soon ™. I am somewhat skeptical because I already use kernel same-page merging and zswap so… how much better can MEXT be? Depends on how bad the software is at managing it’s memory allocation (hint: probably prettybad), I suppose…