7950x3d vs i7-12700T mystery, would appreciate running a quick test on a W680 system

Strangely, my command line C program (it processes two .csv files, no graphics) runs ~25% slower on my just-built Ryzen 7950x3d system than on my older and much-lower-spec Intel i7-12700T system. It should run much faster. (details below)

Since I need ECC, I’m considering returning both the 7950x3d CPU and the Asus ProArt X690E Creator motherboard, and building a W680 system, probably with an Intel i9-13900 CPU and an Asus W680-ACE motherboard.

Before doing so, and since the performance difference is a mystery, it would really help to do a remote-access test (max 15 minutes) on an existing W680 system, to confirm that running on a W680 system will be an improvement.

So any offers would be appreciated!

The test requirements are: a W680 motherboard, 12th or 13th gen Intel CPU (faster than an i7-12700T), 8GB RAM or more, 50MB of disk space on a M.2 Gen4 SSD (or larger/faster) , and Windows 10/11.

The Details
Although the program is simple, it must run fast – because in normal use it processes large files (~150GB). For simply testing speed (in records/second), 50MB is plenty.

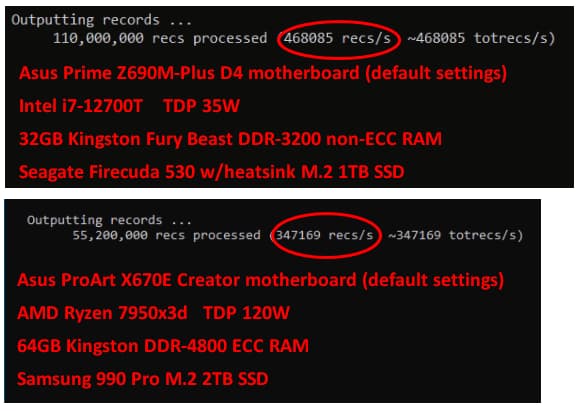
As shown below, the i7-12700T (passively cooled) outperforms the 7950x3d.

7950x3d vs i7-12700T

To find out why the 7950x3d is slower, I’ve tried several ideas without success, such as:

  • replacing the ECC RAM with non-ECC RAM: hardly noticeable difference
  • running Geekbench 6 on both computers: the 7950x3d returns a higher score
  • profiling (with Visual Studio’s profiler) the program on both computers (see below)
  • overclocking the 7950x3d: a slight improvement, the 17-12700T is still much faster

The profiler shows slight differences in which low-level library functions are called (the same .exe is used on both computers). This is the only clue that might explain the difference. Perhaps the low-level library functions detect which CPU is being used, and execute CPU-specific code. If so, I’m not able to recode those functions.

Have you tried pinning the process onto a core of the 7950x3D? You’ll want to try a core from both CCDs, the X3D cache might help a lot here. Having the process move between CCDs might explain a performance difference, check core usage in task manager.

So … I’m guessing this is a binary program that you can’t recompile? If so you’re in a kind of tough position. You’ll need to get into some pretty detailed profiling to work out the issue here - probably something involving instructions per second. Unfortunately what little profiling I have done is entirely on Linux.

If you do have the source code, there is likely a lot of stuff you can do to speed it up.

I could provide access to a 10 or 11 VM running on my 12700k/X13SAE-F (W680) VMware host, if that would be of any use. How many cores does the program utilise?

Just try something very easy and single threaded to determine if it’s related scheduling like running LAME or something with a reasonable large wav(e) file.

I’m going to guess that your parser lib performs poorly though…

Thanks, cowphrase, for your interesting suggestion to pin the program to specific core.

I tried, results are below.

But first, regarding the program itself: I wrote it, in C, and have the source. I compile it with Visual Studio – and use the Visual Studio profiler to see where CPU time is spent.

The times that differ between the two CPUs (though not by much) are inside calls to the _ftelli64() library function. _ftelli64() is inside a Microsoft binary library – for which I don’t have the source code.

Regarding assigning the program to a specific core (using the START /AFFINITY … command): The results are interesting (and curious):

  1. On the i7-12700T (has 16 P-cores and 4 E-cores) :
  • Without assigning a core, Windows 10 assigns the program to two P-cores (8 and 10): ~450,000 recs/second. Performance Monitor (PM) shows both cores running at 100% (which is curious because it’s a single-threaded program).
  • Assigning the program to a single P-core results in about the same performance – and PM shows that one P-core running at 100%.
  • Assigning the program to a single E-core results in about half the above performance – and PM shows that one E-core running at 100%.
  1. On the 7950x3d (has 16 CCX0 cores and 16 CCX1 cores):
  • Without assigning a core, Windows 10 assigns the program to a CCX1 core, but then continuously changes from one CCX1 core to another: ~360,000 records/second.
  • Assigning the program to a single CCX1 core results in about the same performance as just above.
  • Assigning the program to a single CCX0 core results in ~300,000 records/second.

All interesting, but no obvious path to beating the i7-12700T! Which is why I’m considering switching to an Intel CPU on a W680 board.

1 Like

Thanks, ScottishTom, for your offer to help.

I’m not familiar with VMware. Does it run under emulation? If yes, then the emulation would probably run much slower, and wouldn’t reveal if a 12700k is faster than a 7950x3d not running under emulation.

But if it doesn’t run slower, I’d really appreciate trying it on your computer.

Regarding how many cores: Under normal use, the program runs on many cores simultaneously (specified by a command line parameter). But a single core test will reveal what I want to know, because I can compare it with single core tests on my i7-12700T and 7950x3d CPUs.

This is interesting.
If you used the intel vtune profiler you could nail down what exactly about _ftelli64() is stressing the Intel processor, you could likely infer why the process is slower on the AMD processor from this information.
AMD has the uprof tool that could be run on their processor to glean information, but it isn’t as helpful as vtune.
-this seems to be a common trend among alot of software, Intel has better tools to optimize for there CPUs than AMD does so more software than you’d think runs significantly better on Intel CPUs.
Solidworks up until recently would run ~60% faster on an Intel i9-12900K over a Ryzen 9 7950x,

Have you tried running the same test using identical storage? I assume that your output is written to disk.

Thanks, twin_savage.

That info argues for switching to a Intel CPU (on a W680 motherboard).

Also, my focus is more on getting the fastest hardware for the job, and less on identifying why the 7950x3d is slower when it shouldn’t be.

I’ve already tried some of the Asus ProArt X670E performance boosting features in the BIOS, with only minor improvements.

The Samsung 990 Pro (on the AMD motherboard) is supposed to be a little faster than the Seagate Firecuda 530 (on the Intel motherboard). Both are Gen4.

Yes, the output is normally written to the same drive. But I’ve disabled this output for testing. All numbers reported above are with output disabled.

Even if output is disabled, I assume input is read from storage? I’d test on both systems with identical drives to eliminate this as a cause - could be much cheaper to fix.

So faster on non-X3D CCX implies it’s pure cpu limited, faster on X3D CCX implies it’s memory limited. IIRC CCX0 is the X3D CCX? Out of curiosity how does your memory look - # of sticks and speed.

If this is your program, then 9/10 chance you can optimise this to run even faster. I’d suggest looking at a flame graph to see what code path is calling _ftelli64 so much. Identify hot paths with the Flame Graph - Visual Studio (Windows) | Microsoft Learn.

Having so many calls to _ftelli64 sounds a little strange. Is something polling in a tight loop?

That would be ideal. But I only have one Firecuda 530.

Also, the program seems CPU bound (the cores run a 100%), so a different SSD seems unlikely to help.

And the build does have another M.2 Gen4 SSD (TeamGroup 8GB), and the performance is similar.

1 Like

In general that’s a bad metric. 100% CPU basically means “the system is busy doing something”, but that something could be waiting around for data from storage, data from memory, waiting for cpu cache, etc. That’s why it’s important to do proper profiling, and find the bottle neck in your program.

3 Likes

The system has 64GB of RAM (2x32GB). Two sticks of Kingston KSM48E40BD8KM-32HM.

Total usage (including Windows) with the test program is 5.5GB (9%).

(More RAM is needed by other programs.)

Yes, the test program can be further optimized, but that doesn’t change the fact that the 7950x3d is running the program slower than a much-lower-spec CPU. I.e., if I did optimize it further, I’d still want to run the program on the faster hardware (because the full dataset is so large, billions of records).

Yes, _ftelli64() (identified on the hot path) could be called fewer times. But that doesn’t change the above point about optimization. Also, _ftelli64() should be a quick operation. It returns the current file position, something the stream I/O layer should already know.

But I’ll try to reduce calls to _ftelli64() on the chance that there is something peculiar with how _ftelli64() works on a 7950x3d, and report back.

The program is currently slower on the 7950X3D because of a (yet unclear) bottle neck. If you manage to optimise the program to remove the bottle neck, it may end up running faster on the 7950X3D (though I’ll admit unlikely).

Unless you can run on all 16 cores - then it’ll probably beat out the intel.

Also, _ftelli64() should be a quick operation.

Yes, but quick operations can still be bottle necks when called thousands of times a second. Getting the time is a great example - each call is a system call that requires the process to give up control to the kernel. Trivial if called once, problematic when called too much.

A flame graph should be very useful to see the potential impact of _ftelli64() here.

In normal operation, the program launches n instances of itself, and each instance works on a different section of the main input file – and each instance runs in a different core. Doing so offers a significant increase in throughput.

At some point, perhaps n >16, the throughput starts dropping, possibly due to too many simultaneous SSD operations.

But at each n I’ve tried (many of them), the i7-12700T outperforms the 7950x3d.

So far, every optimization I’ve made has increased throughput – on both CPUs – and the i7-12700T continues to prevail.

Perhaps getting the time gives up control (it shouldn’t), but if _ftelli64() gives up control only on the AMD machine, then the application as a whole is better off with an Intel machine.

I.e., while it’s possible to reduce calls to _ftelli64() for this program, and doing do might give the AMD machine the edge, there are other programs (also related to the main purpose of the computer) that trying to reduce calls to _ftelli64() will be difficult.

In short, I don’t think optimizing is the answer, unless it reveals the cause of the slowness AND points to how to eliminate the slowness, not via optimization, but through some OS, BIOS, or software setting that makes the AMD CPU run as well as the Intel CPU.

Even so, I’ll try to reduce _ftelli64() calls for this program on the possibility of learning something.

1 Like

Totally get not wanting to go down an optimization rabbit hole just to cater to a specific arch, there’s only so much time available to us.

To clarify on that solidworks example, eventually the development team did properly optimize for AMD processors after years of the disparity and the performance difference between the 12900K and 7950x flipped so that the AMD processor is now ~7% faster than the intel in the same CPU rebuild operation (a common and annoying modeling operation being benchmarked).
I think the only reason this optimization happened was that AMD hit a critical threshold in market share to get sufficient attention and resources devoted to it.

This is pure conjecture on my part, but I feel like in the open source world the developers are more willing to dig down into these types of weird optimization problems more out of “well it should perform the same between the two” sentiment rather than a regard for their own time.

There are a lot of possible reasons the intel cpu is faster but a couple that come to mind:

  • is the compiler up to date? Is it aware of zen4?
  • compiler optimisation flags?
  • is the program bound to visual studio or could you use another compiler, like gcc?
  • to eliminate or reduce the io factor you might try to run on a ramdisk?
1 Like

I’m returning the X670E motherboard and the 7950x3d CPU in favor of an Asus Pro WS W680-ACE motherboard and an Intel i9-13900K CPU.

The reason is that every optimization I’ve tried so far has improved performance on both platforms, and in each case the much-lower-spec i7-12700T continues to outperform the 7950x3d by the same ~25% margin.

If I had more time, it might be interesting to further investigate the mystery. But right now, it’s more important to focus on the application.

Thanks to all for your many suggestions !

I’ll report back after the new parts are working. The i9-13900K arrived a few hours after I ordered it. The motherboard should arrive late next week.