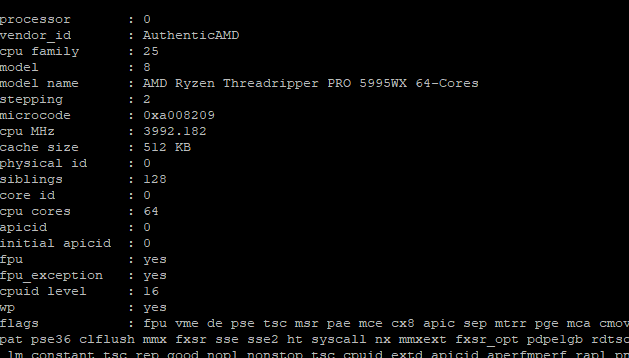
I have an Asus Sage II motherboard with a 5995wx and 1TB Ram (2933MHz)
I am having a weird issue where it is doing very poor performance for a python based quality signal processing script. I have a few Dell R630s that have 88 threads each and they process about 3000 documents a second. My TR Pro machine (using the same version of software Ubuntu 20.04, python3.10, etc) starts out at doing like 11k documents a second and then slowly drops to 200 documents a second and maintains that speed. I have looked at cpu, disk, and RAM bottlenecks and nothing is coming back as the smoking gun. I started looking at NUMA configs and noticed that it shows as a single NUMA node. I tried changing it in the BIOS to NPS4 and on save, the machine reboots, turns off completely and then boots back up with the previous settings. I cannot get it to manually set the NUMA nodes per socket or be able to disable memory interleaving. I am on bios version 1501. Any ideas?
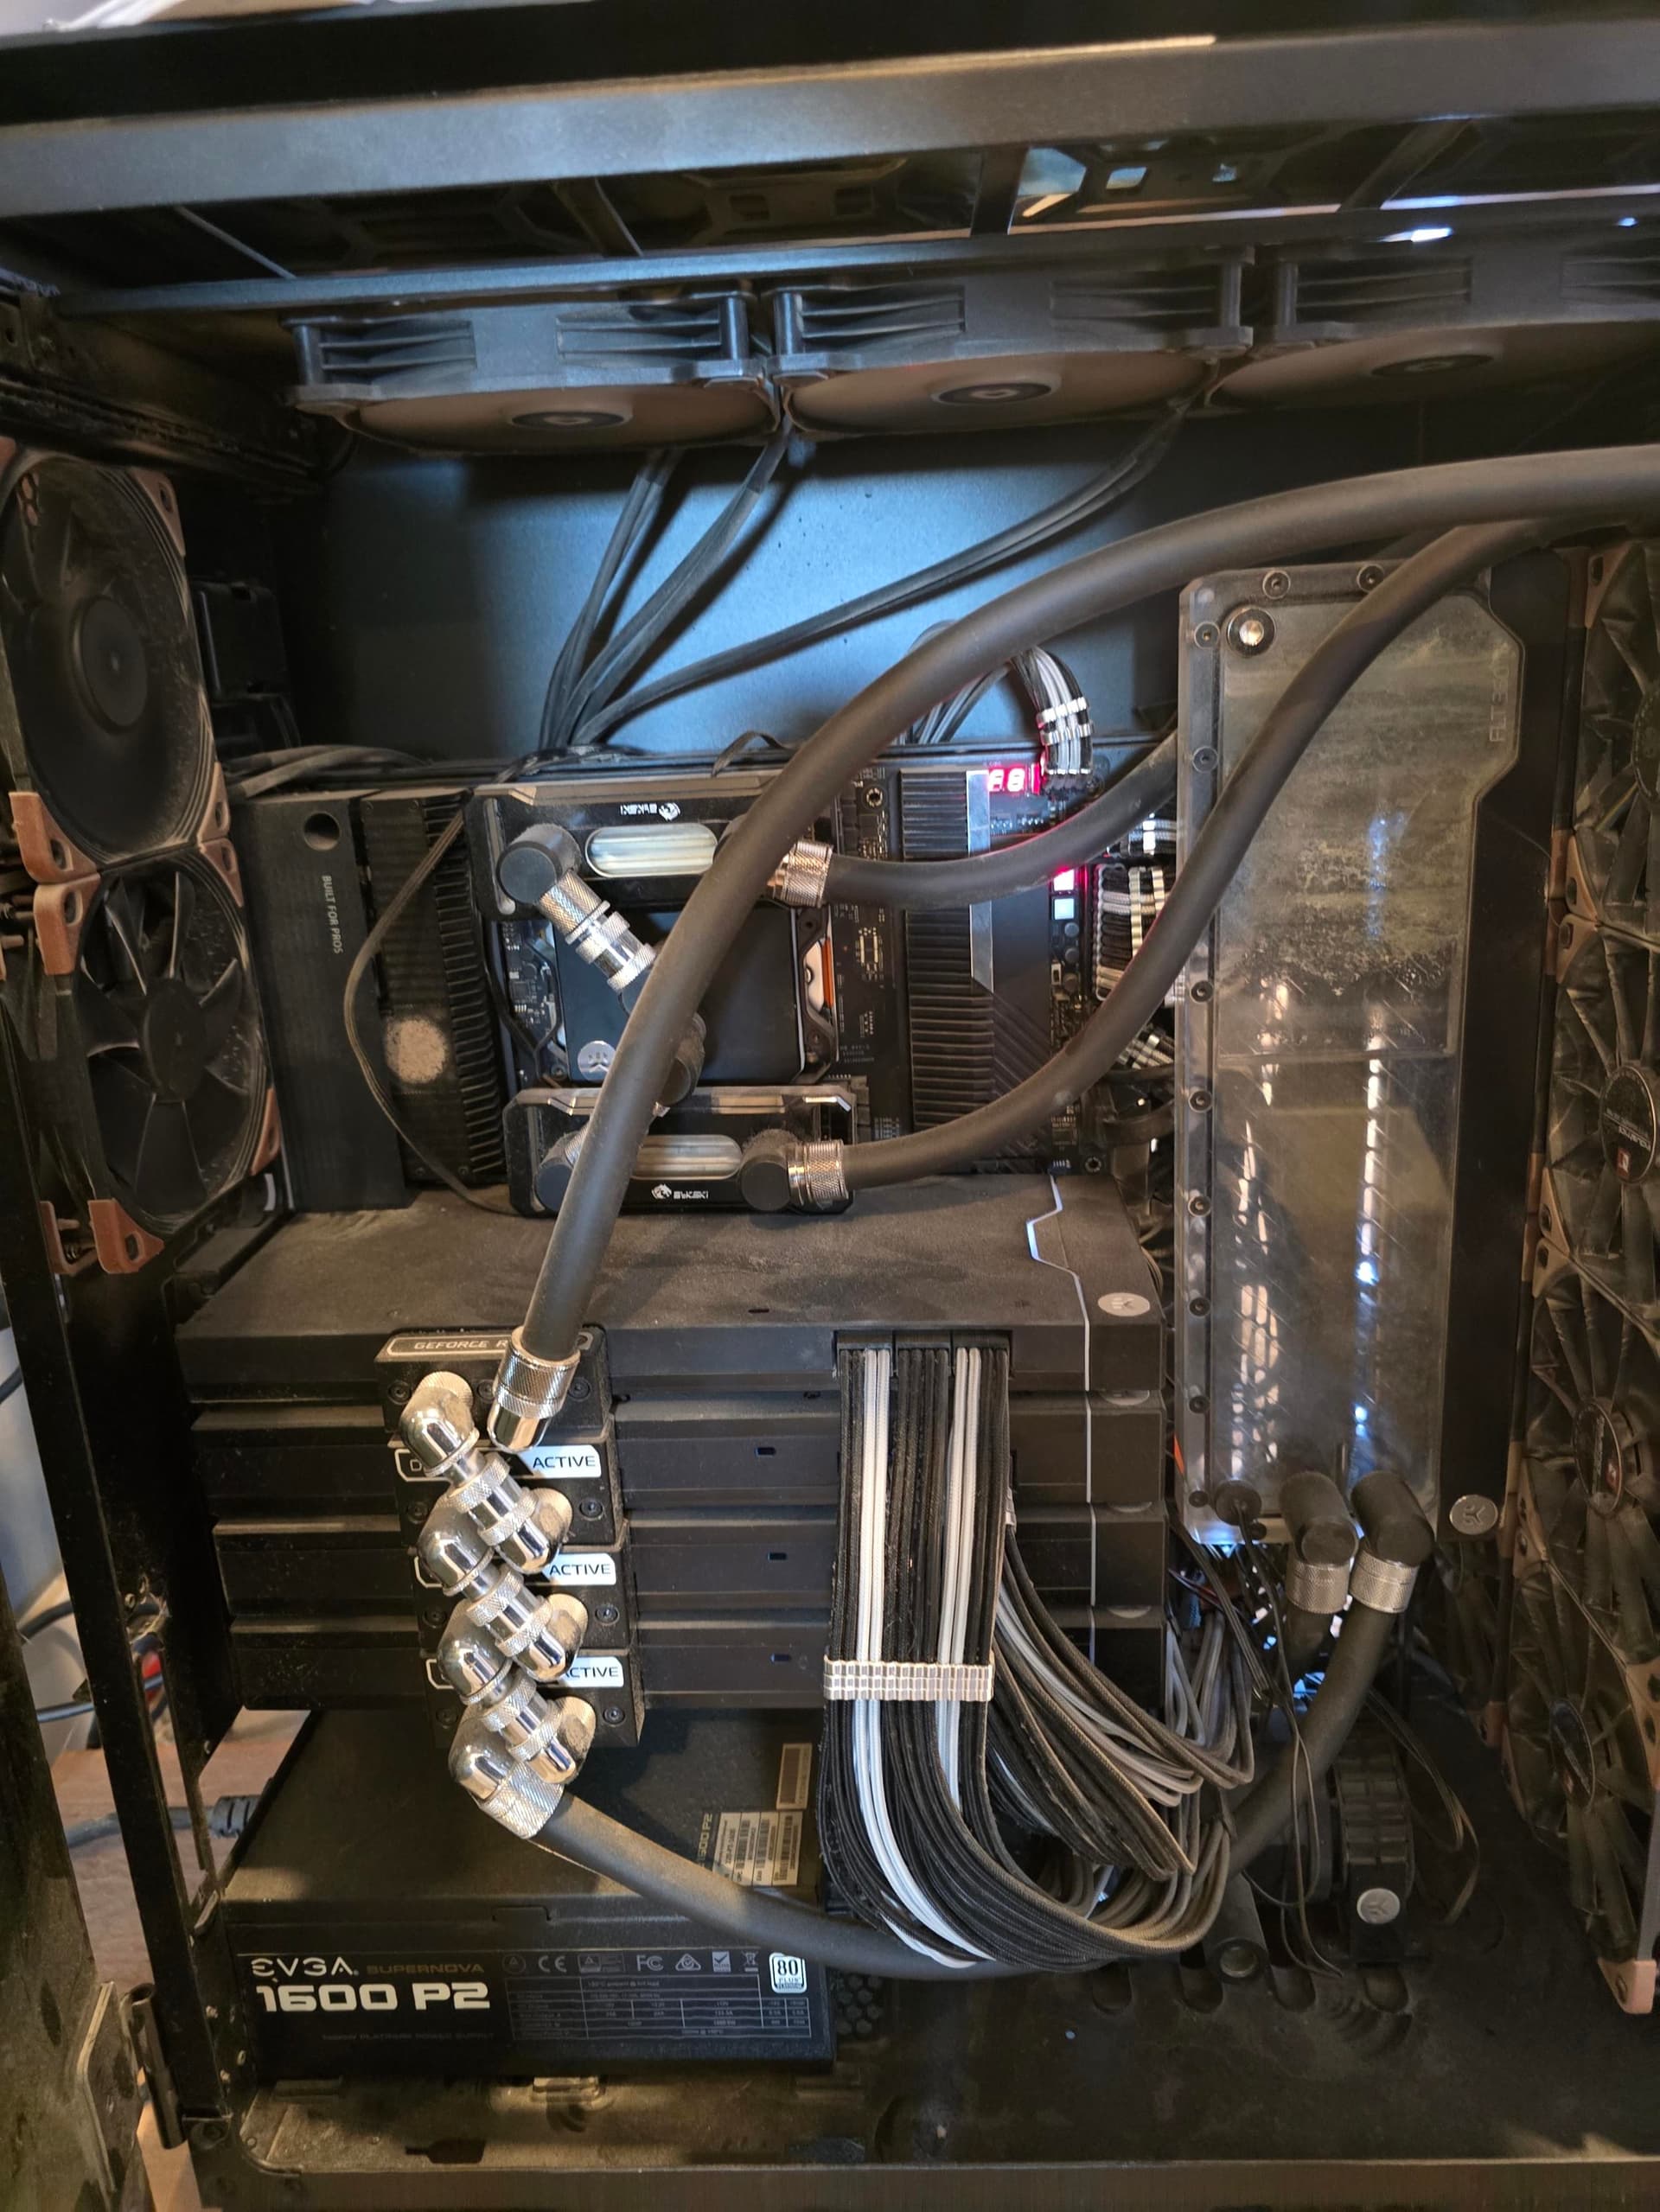
I currently have them water cooled (Bitspower 4 Dimm x2). But yeah… those guys get hot.
If it is a memory issue, would the CPU load not diminish as the RAM struggles to keep up? the CPU usage stays at 90% overall crunching 11k file a second, or 200 files a second. I was originally running the workload in a WSL2 instance, and switched to a native Ubuntu OS to rule out software/virtualization.
I cant seem to figure out how to get lm-sensors to see the RAM. I have Tctl, 2 Composites, and a Sensor 1 in psensor, and lm-sensors:
theskaz@KevenPC:~$ sensors
k10temp-pci-00c3
Adapter: PCI adapter
Tctl: +35.4°C
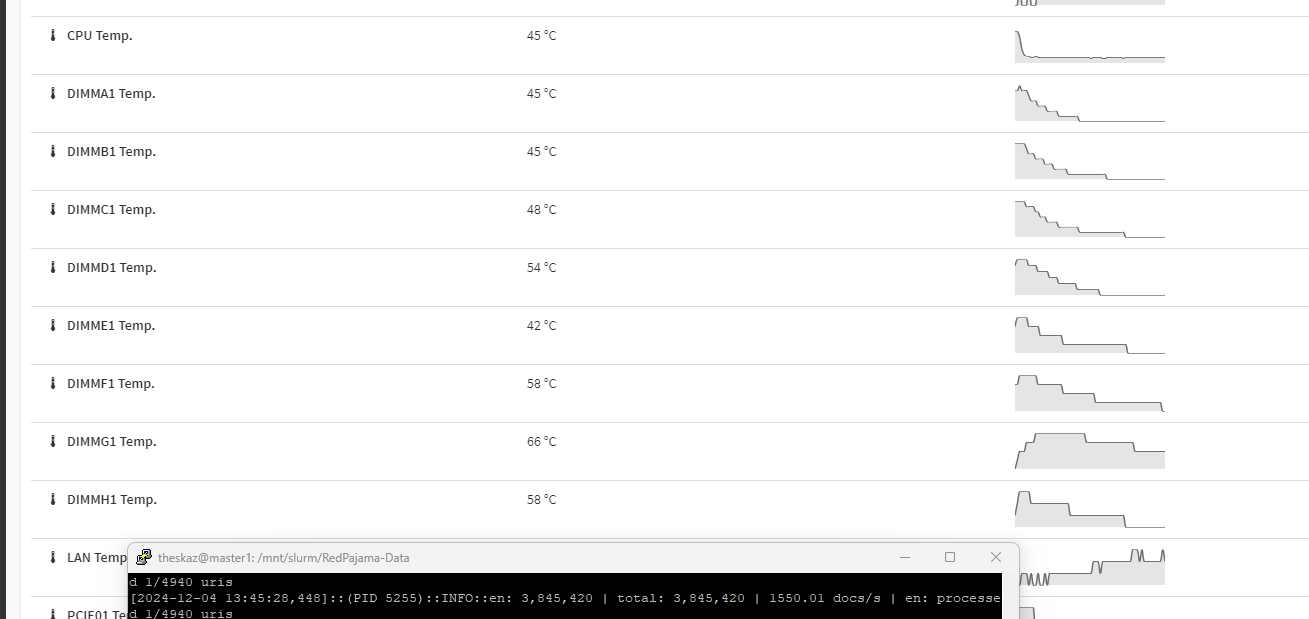
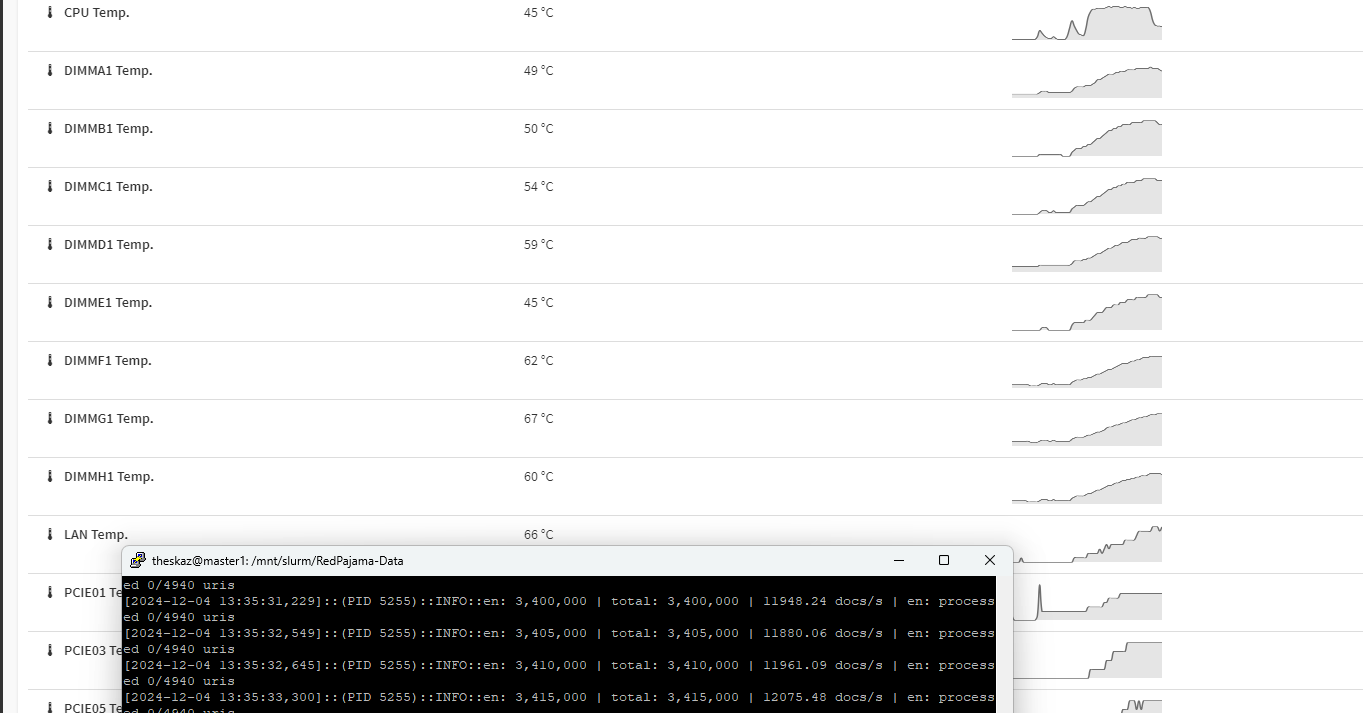
Here is so info. Screenshots below show the docs per second at the beginning, and then about 10 minutes later. You can see that I went from 12k to 1.5k in that time and the relative temps of the DIMMs and CPU at that time. The max on the dimms are 63, then the fans kicked in and brought it down. Keep in mind that this is all one watercooled system.
after a couple of hours of running, it DIMMs range from 45-66C and CPU is 45C with the liquid at 31C. 7 dimms fall between 45-50C and one is an oddball at 66C. Also wanted to note that everything is extremely sluggish. for example, to enter htop in the terminal, it took over a minute.
Do you have PCIe Advanced Error Reporting (AER) enabled in the motherboard’s BIOS?
Extensive PCIe Bus Error Correction can cause the symptoms you’ve described. With AER enabled you should be able to see PCIe Bus Errors in the operating system’s logs otherwise these might stay hidden and you’re in the dark why a system is acting weirdly since the platform doesn’t report them to an OS.
Thermal expansion and contraction of the metal in your watercooling blocks that are also linked together with rigid fittings can slightly move the dGPUs in the PCIe slots which might lead to a bad pin-pad contact in a PCIe slot.
(One of the reasons I prefer loose soft tubing and never cooling multiple components as a fixed unit even if it looks less dope)
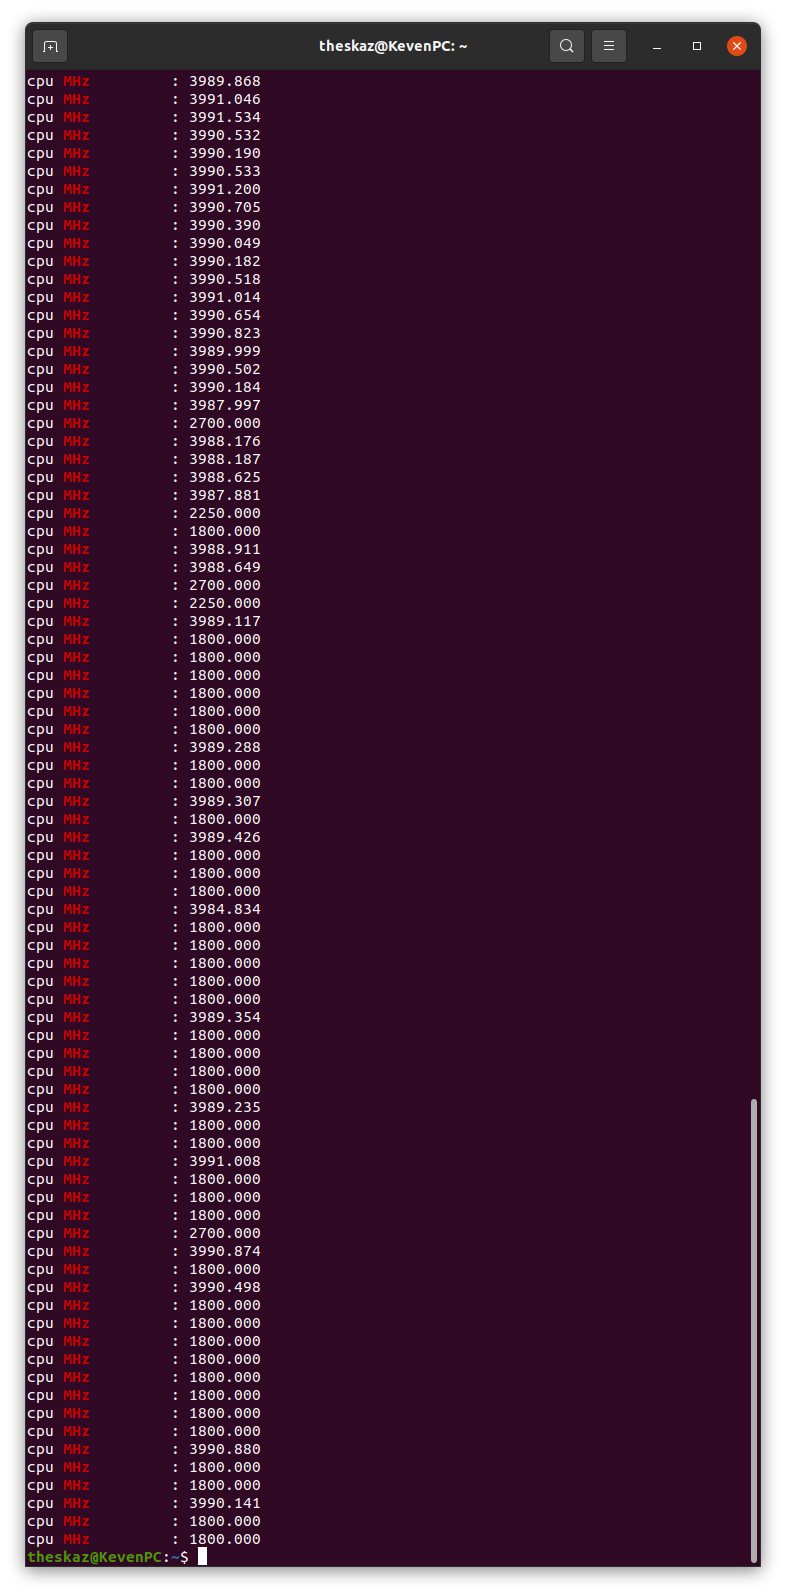
That command as is, shows nothing, but dropping the grep and understanding we are looking at CPU MHz It ranges from 2700 - 3990. It only stays at 2700 for a single tick, then back to the 39xx
Sorry the watch command interferes with the output it seems. Please run the command without the watch like the following manually a couple times during the execution of the application. It should show all your 64 processors, in your screenshot you only see the first core. My suspicion here is that maybe the cores resort to a low frequency because of power management troubles?
cat /proc/cpuinfo | grep MHz
If you application applies load to all cores they should all be around the base frequency of the processor, in your case that would be about 2.7GHz under full load.
Do you happen to know if there are explicit PCIe AER settings in Zen 3 Threadripper motherboard UEFIs?
I’m unfortunately a Threadripper ownership virgin (wanted to go for Zen 4 but am not happy with AMD’s product segmentation choices), my experiences only come from AM4/AM5 motherboards and their PCIe behavior.