4x MemBlaze P7A40 RAID10 Array
Throughput, Latency, and CPU Cost of the md + XFS Stack
4x MemBlaze P7A40 RAID10 Array
Throughput, Latency, and CPU Cost of the md + XFS Stack
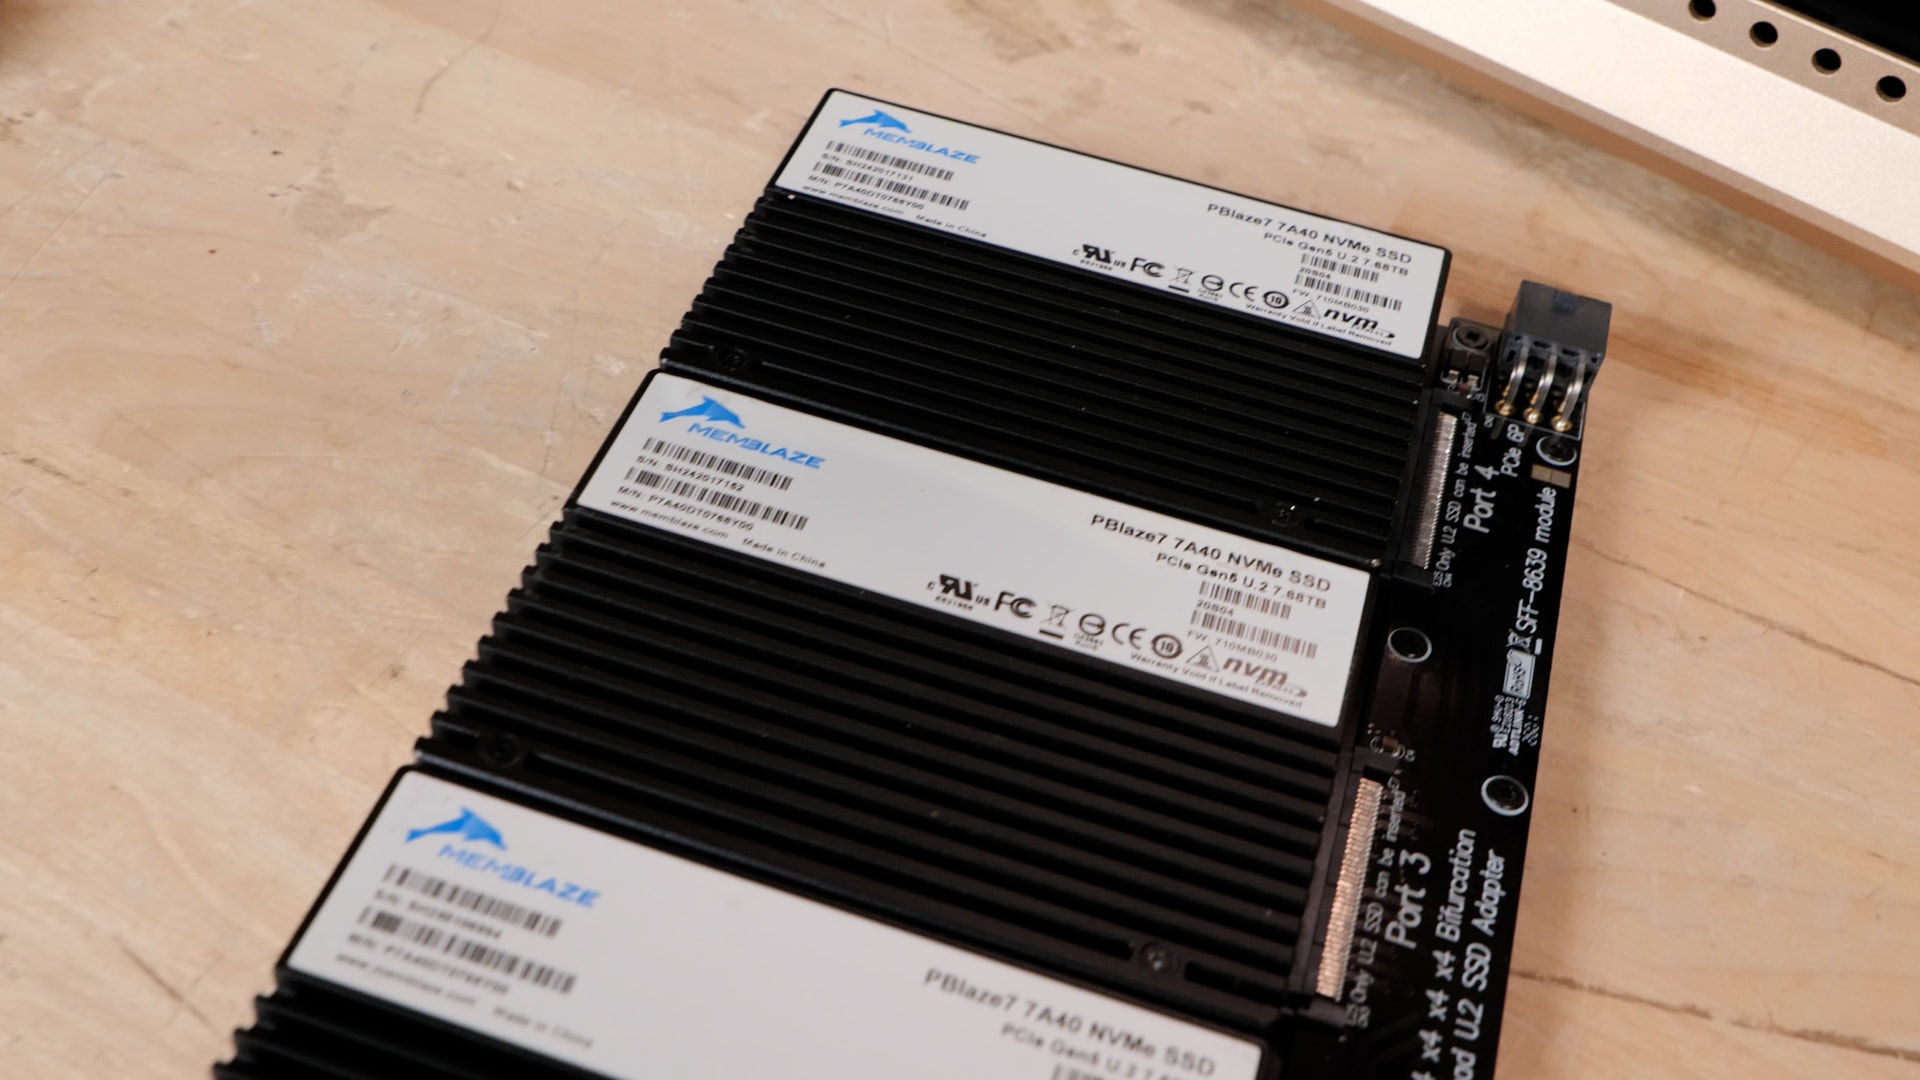
I put four 7.68 TB MEMBLAZE P7A40DT0768Y00 Gen5 NVMe drives in a single md RAID10 near=2 array with XFS, put through a 52-workload benchmark measuring the full storage stack: aggregate sequential throughput, random IOPS scaling, AI checkpoint, database OLTP, HTAP analytics, multi-tenant VDI, and detailed CPU utilization across every test.
The host system was an AMD EPYC 9554 64-core, and it was pretty awesome!
- Test host: wTR24 (10.200.1.20), AMD EPYC 9554 64-core (128 logical), 256 GB RAM, Ubuntu 24.04.4, kernel 7.0.0-31-generic (7.0.14), fio 3.36, sysstat 12.6.1.
- Array: /dev/md0, RAID10 near=2, 512 KiB chunk, 4x MEMBLAZE P7A40DT0768Y00 7.68 TB each, firmware 710MB500, all at PCIe Gen5 x4 (32 GT/s).
- Filesystem: XFS on /mnt/mb4, 13.97 TiB usable, allocation group count 32, sunit=128 / swidth=256 (512 KiB stripe aligned), rmapbt/reflink/bigtime enabled.
- Benchmark file: 256 GiB preallocated (fallocate), sparse, on the XFS mount. Every test uses io_uring, direct=1, time-based with ramp time, incompressible payloads, and latency percentiles 50/90/99/99.9/99.99/100.
- Preconditioning: Through-array WIPC fill (128K sequential, QD32, 2x usable capacity) before each category – the array reaches steady state as a unit: md stripe distribution, XFS allocation groups, journal, and per-member GC all equilibrate together.
- CPU tracking: fio per-job usr_cpu/sys_cpu + mpstat -P ALL 1s sidecar + iostat -x 1s sidecar for every test. Results include util_pct (100 - idle, all cores averaged), max_core_util_pct (busiest single core), and derived efficiency (GiB/s per core, IOPS per core).
- Scope: five categories – general (20 tests), AI (5), database (13), HTAP (8), VDI (6) = 52 tests total. Total data written by suite: ~20.50 TiB.
Array identity captured from live mdadm, xfs_info, and smartctl on the test rig. Interface speed confirmed from sysfs negotiated link state on each member.
Observed array identity, member configuration, and filesystem geometry at benchmark time.
| Attribute | Value |
|---|---|
| Array device | /dev/md0 |
| RAID level | RAID10, near=2 layout (2 copies, one mirror pair per stripe) |
| Chunk size | 512 KiB |
| Usable capacity | 13.97 TiB (15,362,731,016,192 bytes) |
| Status | [UUUU] clean, bitmap present, resync complete |
| Members | 4x MEMBLAZE P7A40DT0768Y00, FW 710MB500, PCIe Gen5 x4 (32 GT/s) |
| Member serials | SH242017152 (nvme1, 5.21 TBW), SH242017131 (nvme2, 12.9 TBW), |
| SH250107026 (nvme3, 259 TBW), SH250106994 (nvme4, 811 TBW, 2% used) | |
| Filesystem | XFS on /mnt/mb4, alloc_blocksize=4096, agcount=32, |
| sunit=128, swidth=256 (512 KiB stripe aligned) | |
| XFS features | rmapbt, reflink, bigtime enabled; internal log bsize=4096 blocks=521728 |
| Host CPU | AMD EPYC 9554 64-Core (128 logical), 1 socket |
| Host RAM | 256 GB |
| Host kernel | Ubuntu 24.04.4, 7.0.0-31-generic (7.0.14) |
| Benchmark file | /mnt/mb4/array-bench.dat, 256 GiB preallocated sparse |
| fio version | fio-3.36 (io_uring engine) |
Sequential throughput – 1 MiB and 128K, QD64
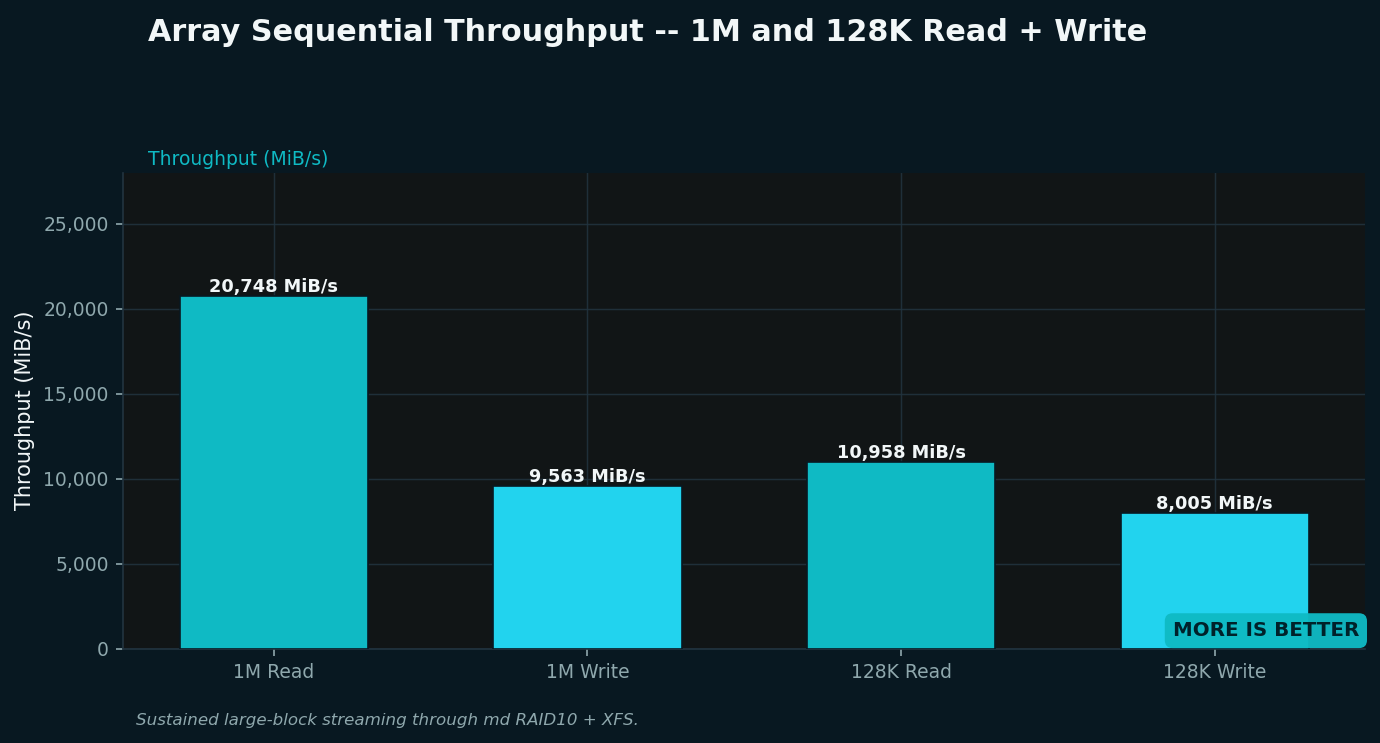
Read the bars: the array delivers 20,748 MiB/s (20.3 GiB/s) on 1M sequential reads at QD64 – roughly 1.66x the single MemBlaze drive’s 12,482 MiB/s. That is less than the ideal 4x scaling (which would be ~50 GiB/s) for two reasons: the RAID10 mirror pair layout means only two of the four drives contribute to any given read (near=2 places one copy on each of two drives), and the single io_uring submission thread becomes a bottleneck at these bandwidths. Still, 20+ GiB/s from four consumer-style NVMe drives through a kernel md stack is a strong result.
Write side: 1M sequential write reaches 9,563 MiB/s (9.3 GiB/s) – roughly 0.89x the single drive’s 10,774 MiB/s. This is the RAID10 mirror write tax: every write must hit two members, so the effective write bandwidth is roughly half the aggregate of four drives, minus md and XFS overhead. At 128K blocks the array reads 10,958 MiB/s and writes 8,005 MiB/s – the smaller block size reduces stripe efficiency but still delivers pretty strong bandwidth. I’m linking these drives for VDI and VM hosting type workloads.
4K random read IOPS vs queue depth

Read the curves: the array hits 171,147 IOPS at QD16 and stays essentially flat through QD512 at 169K-171K IOPS. This is a hard plateau: the array is not drive-limited at these depths (the single MemBlaze drive peaks at ~905K 4K read IOPS in review #1). The bottleneck is the md+XFS stack – the io_uring submission thread, the block layer plugging, and the XFS allocation group locking all cap throughput well before the NVMe controllers saturate. For comparison, the single MemBlaze drive delivered ~905K IOPS at QD128 on the same test; the array delivers ~171K, or about 19% of single-drive peak. This is expected behavior for a kernel md RAID10 array on small random reads – the mirror layout and filesystem overhead dominate at small block sizes.
What this means: for workloads dominated by small random reads at high queue depth (large analytics scans on small rows, heavy OLTP with a cold buffer pool), a single raw NVMe drive can outperform the array. The array’s strength is in sequential bandwidth, large-block throughput, and multi-tenant isolation – not in small-block random IOPS at depth.
It might seem weird, this test, but it is under the “trust but verify” banner. This is also one of the tests that some (even high end) consumer drives can fall apart when you do this type of test.
1M QD1 latency (prose, not charted): a single 1 MiB read through the array averages 72.9 us (p99 232.5 us), while the 1 MiB write averages 95.7 us (p99 238.6 us). These are the minimum round-trip times for a large I/O through md + XFS – very competitive for a four-drive stack.
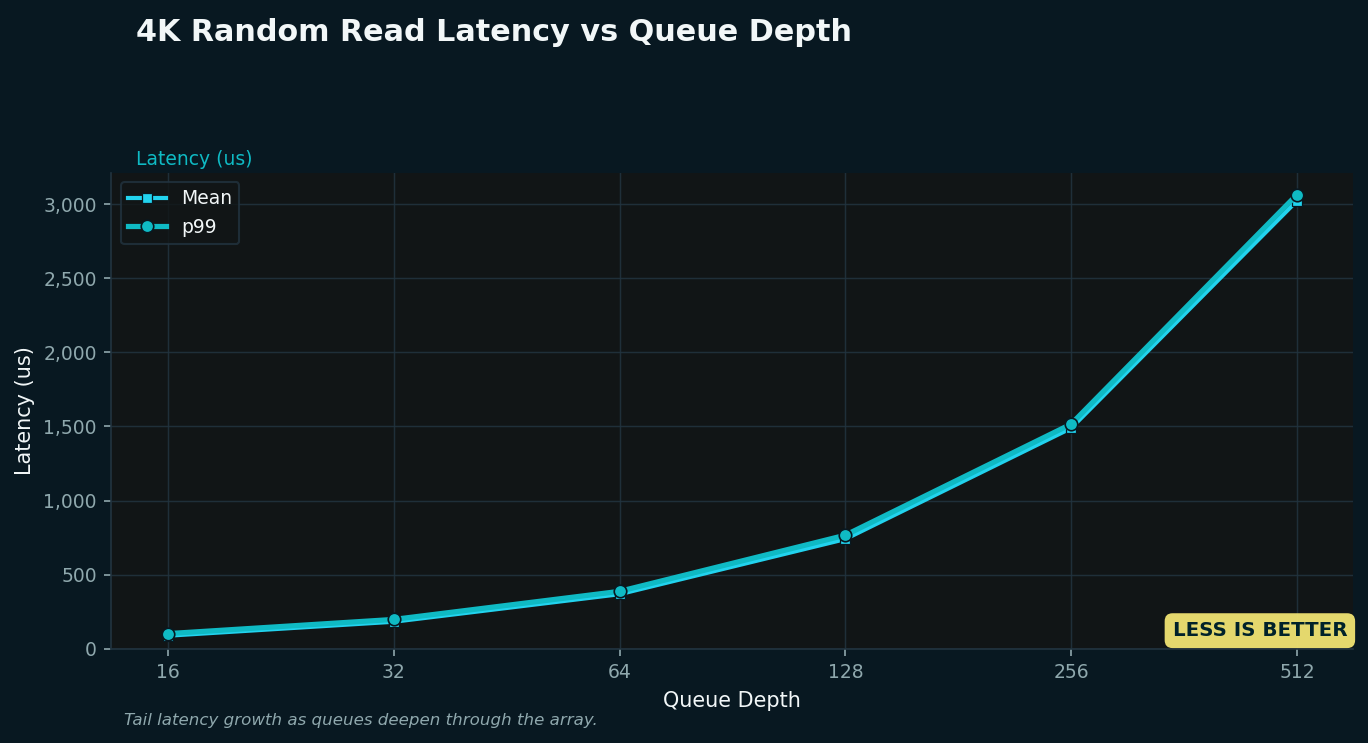
4K random read latency – mean and p99 vs queue depth
AI – checkpoint write/read, model load, and weights write
AI training pipelines spend real time dumping checkpoints (large sequential writes) and reloading weights (large sequential reads). These are pure bandwidth contests through the array stack.
AI checkpoint, model load, and weights throughput
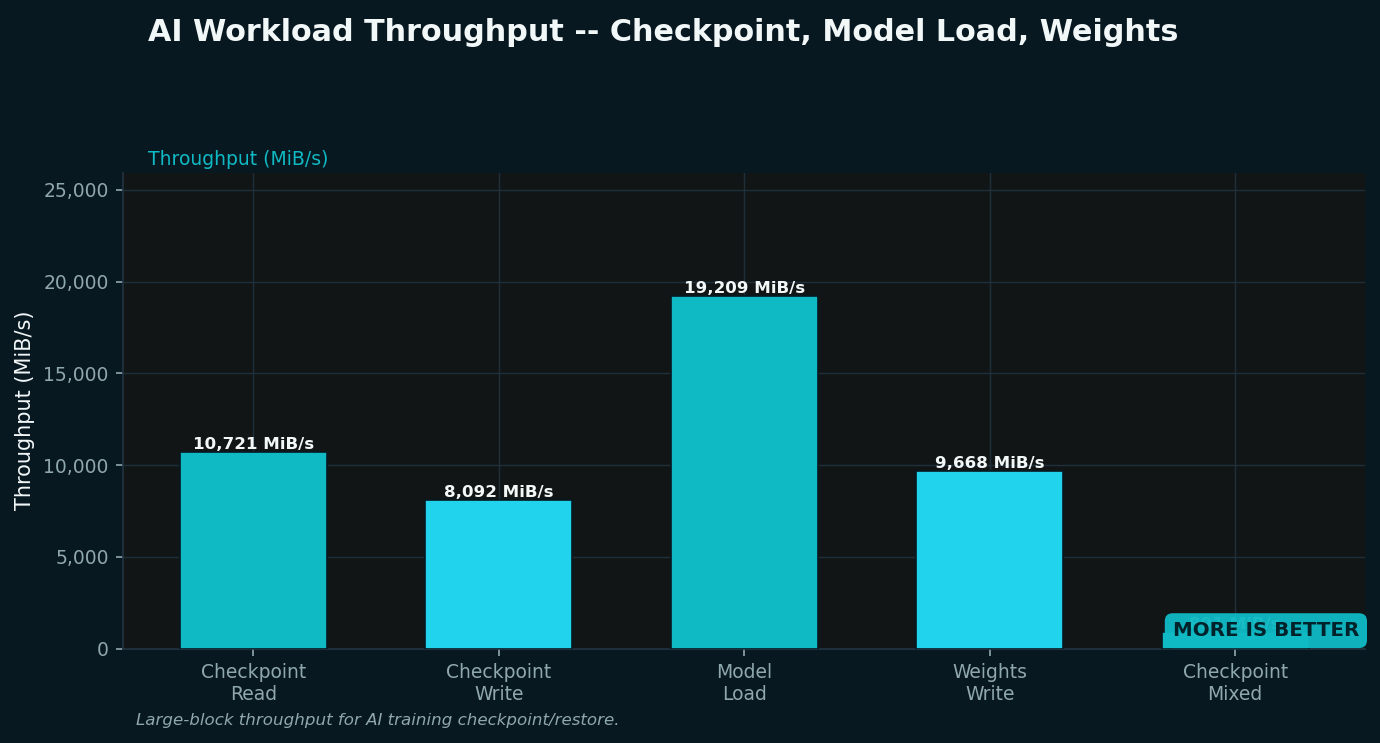
Read the bars: the array’s AI workload profile mirrors its sequential throughput characteristics. Model load (1M reads, QD64) hits 19,209 MiB/s (18.8 GiB/s) – essentially matching the 1M sequential read peak. Checkpoint read (128K, QD64) delivers 10,721 MiB/s , and checkpoint write reaches 8,092 MiB/s . Weights write (1M, QD64) at 9,668 MiB/s tracks the 1M sequential write figure. The checkpoint mixed workload (8K 80/20 read/write, QD32) drops to 891 MiB/s – the small-block mixed pattern exposes the array’s random IOPS ceiling rather than its bandwidth.
Context vs single drive: the single MemBlaze delivered 13,563 MiB/s model load and 10,743 MiB/s checkpoint write. The array’s model load is 1.42x the single drive; checkpoint write is 0.75x (the mirror write penalty). For checkpoint-restore on large models, the array reloads weights 42% faster than a single drive, but dumps checkpoints 25% slower due to the RAID10 write amplification.
Database – OLTP small-block IOPS and table scans
Two very different database workloads: OLTP wants low-latency small random reads under concurrency, while ETL, reorgs, and full-table scans want raw sequential bandwidth through the array.
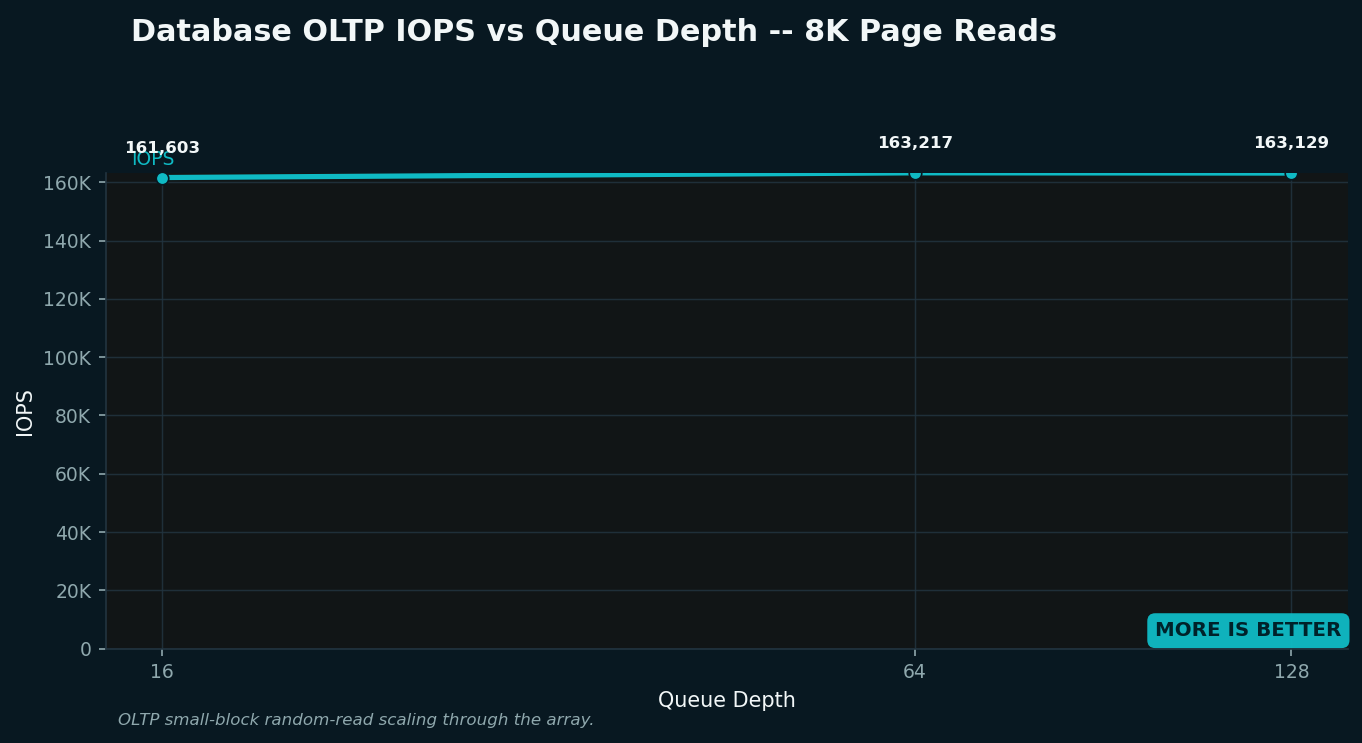
Read the curves: the array plateaus early on 8K random reads: 161,603 IOPS at QD16 , 163,217 at QD64 , 163,129 at QD128 . This is the same md+XFS small-block random ceiling seen in the 4K sweep – the stack saturates at roughly 163K IOPS regardless of queue depth. For comparison, the single MemBlaze drive delivered ~748K 8K read IOPS at QD64 in review #1. The array delivers about 22% of that peak.
OLTP write and mixed (prose): 8K random write at QD64 reaches 105,825 IOPS (827 MiB/s). The 70/30 read/write mixed workload at QD64 delivers 96,588 read IOPS + 41,400 write IOPS = ~138K total IOPS at 755 MiB/s. The write-side penalty from RAID10 mirroring is visible here: writes are roughly 65% of read IOPS at the same QD.

Read the bars: the array delivers 11,404 MiB/s (11.1 GiB/s) on 128K sequential scan reads and 8,329 MiB/s (8.1 GiB/s) on scan writes. These are strong numbers for a four-drive RAID10 array – the read figure is about 0.94x the single drive’s 12,185 MiB/s scan read (the array’s md read-balancing and XFS allocation overhead trim some bandwidth), while the write figure is about 0.78x the single drive’s 10,736 MiB/s (mirror tax). For full-table scans in a data warehouse, the array delivers roughly the same read bandwidth as a single drive – the bottleneck is the stack, not the drives.
Log write (prose): the WAL/redo path (4K synchronous writes with fsync=1 at QD16) reaches 81,067 IOPS (317 MiB/s) with mean latency of 81 us. The array’s log write performance is competitive with a single drive for transactional workloads that flush frequently.
HTAP – OLAP columnar scans and mixed workload
Hybrid transactional/analytical systems keep a write stream alive while analysts scan wide columns. OLAP scans use very large blocks (256K here) at high queue depth.

Read the bars: this is where the array really shines. The 256K OLAP scan read hits 15,399 MiB/s (15.0 GiB/s) – the highest single-direction bandwidth in the entire suite. The 256K scan write reaches 11,562 MiB/s (11.3 GiB/s) . The 64K random mixed 50/50 workload delivers 5,530 MiB/s total (44,250 read + 44,221 write IOPS), and the 256K random mixed 70/30 workload delivers 12,645 MiB/s total (35,403 read + 15,177 write IOPS). These large-block mixed results show the array’s ability to sustain high bandwidth in both directions simultaneously – a key advantage over single drives for HTAP workloads.
Context vs single drive: the single MemBlaze delivered 12,337 MiB/s on 256K scan read and 10,767 MiB/s on 256K scan write. The array delivers 1.25x the read bandwidth and 1.07x the write bandwidth – a meaningful improvement for analytics scans, though not the 4x that raw drive count would suggest, because the md+XFS stack and the single io_uring thread are the limiting factors at these bandwidths.
16K random reads: at QD32 the array delivers 150,238 IOPS (2,347 MiB/s) on 16K random reads; at QD128 it reaches 154,280 IOPS (2,411 MiB/s). The small-block ceiling persists across block sizes – the array’s random IOPS limit is stack-bound, not device-bound, at roughly 150-170K IOPS regardless of whether the blocks are 4K, 8K, or 16K. There is some meta commentary to be had here about “building a real earnest platform for VDI/VM hosting” and “performance tuning” because more performance can be squeezed out of this config for real-world use cases… it hurts one or more benchmark dimensions however!
VDI – multi-tenant boot storms, desktop steady state, and log latency
Virtual desktop infrastructure stresses drives with clustered boot storms and small synchronous log writes. The array’s multi-tenant tests use 4 and 8 concurrent fio jobs (each simulating a VM) with per-tenant latency tracking.
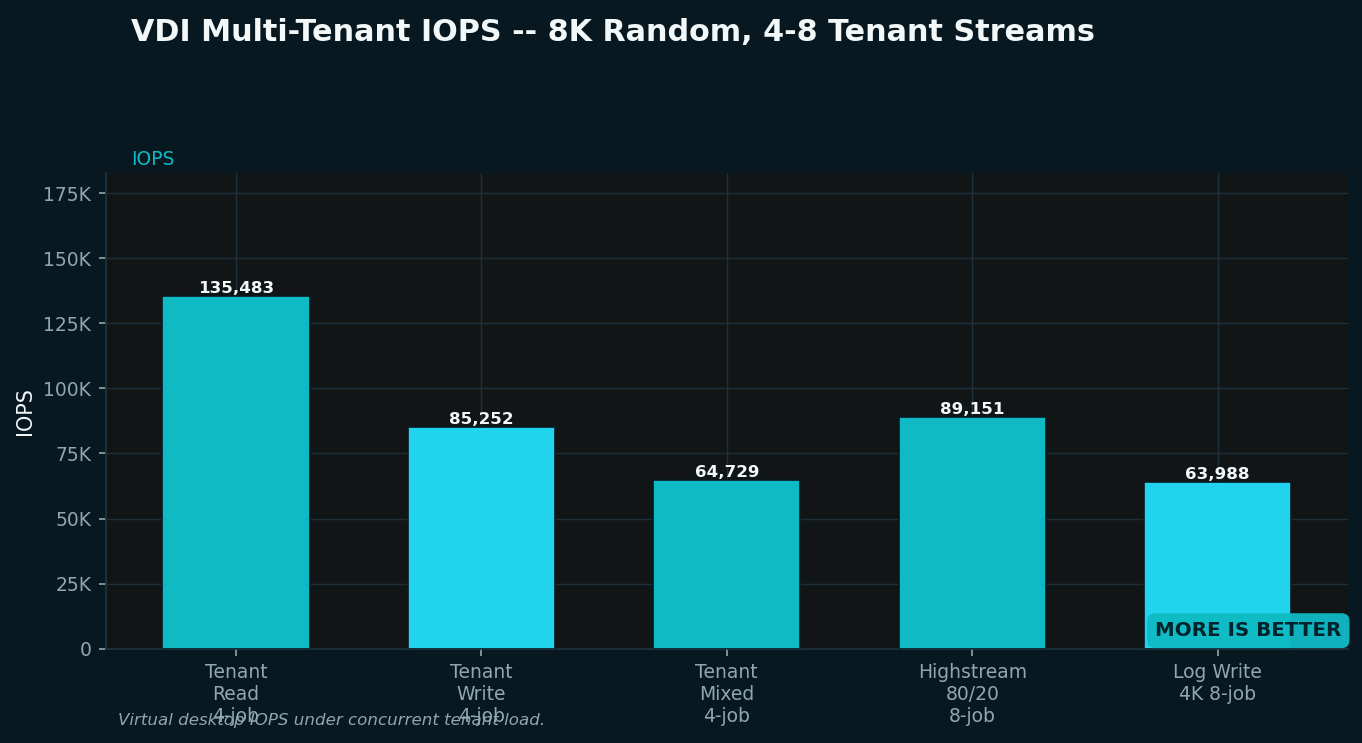
Read the bars: the 4-job tenant read delivers 135,483 IOPS (1,058 MiB/s) – the array’s multi-stream efficiency is excellent, with all four jobs sharing the md+XFS stack without destructive interference. The 4-job tenant write reaches 85,252 IOPS (666 MiB/s), and the 60/40 read/write mixed workload delivers 64,729 read + 43,165 write IOPS . The 8-job highstream workload (80/20 read/write) reaches 89,151 read + 22,304 write IOPS (696 MiB/s total). The array’s multi-tenant fairness is a genuine strength – each tenant job gets consistent latency and throughput without one starving another.
Log write (4K, 8-job, fsync=1): the array delivers 63,988 IOPS (250 MiB/s) on synchronous log writes with 8 concurrent jobs. This is the hypervisor’s commit path under multi-VM load, and the array handles it cleanly.
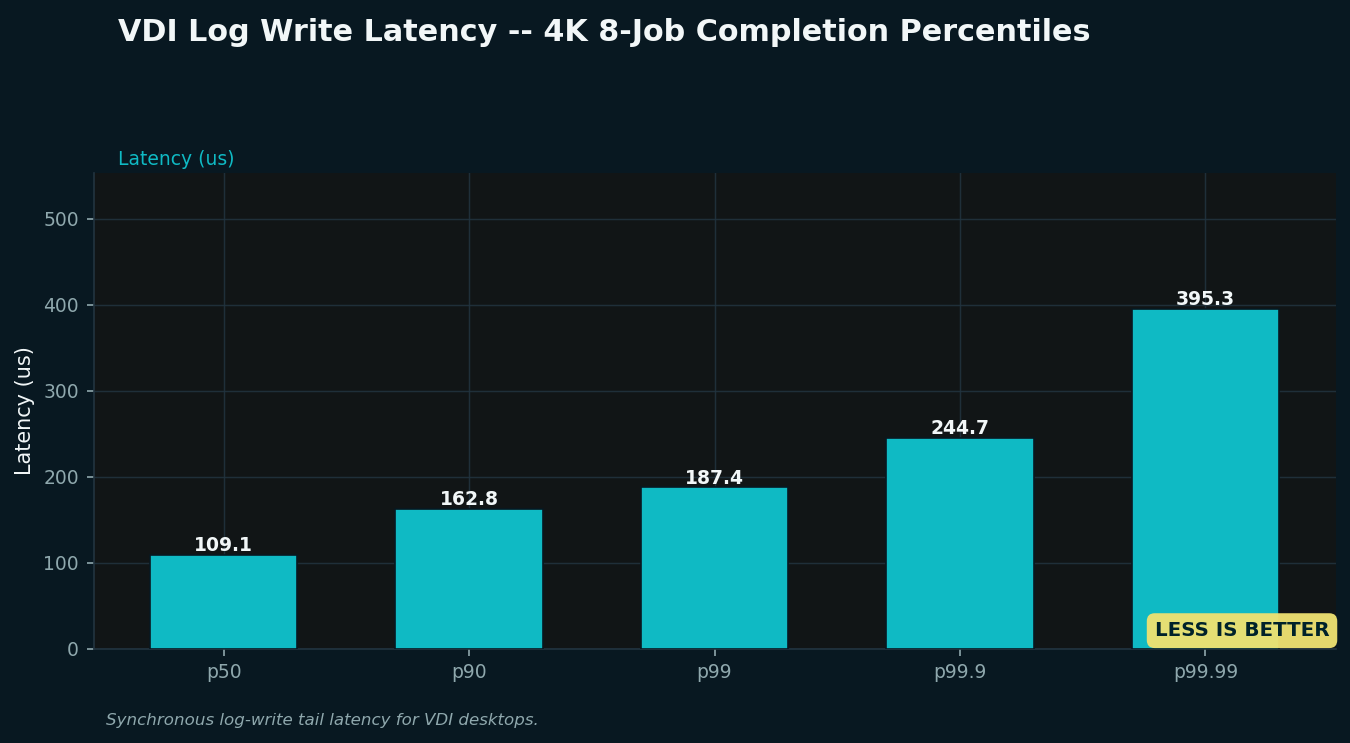
Read the bars: the array’s synchronous log-write latency is healthy for a RAID10 stack. p50 is 109.1 us , p90 162.8 us , p99 187.4 us , p99.9 244.7 us , and p99.99 395.3 us . These sub-400 us tail latencies with 8 concurrent fsync-heavy jobs are reasonable for a four-drive kernel md array. The XFS internal log and the RAID10 mirror write path add latency compared to a raw device, but the distribution is tight – p99.99 is only 3.6x the mean, indicating no severe outlier behavior.
Context vs single drive: the single MemBlaze delivered p50 of 4.2 us and p99 of 5.0 us on the same test at 1.6 million IOPS. The array’s log write latency is higher (109 us mean vs 4.2 us) because each fsync must complete on two drives (mirror write) plus the XFS journal, and the 8 concurrent jobs share the single md submission thread. The array’s 64K IOPS on this test is about 4% of the single drive’s throughput – the synchronous write path through md+XFS is the bottleneck, again, not the drives themselves.
CPU utilization – the cost of driving the array
A key question for any array deployment: how many CPU cores does it take to keep the storage stack fed, and is the efficiency acceptable? On a 128-logical-core EPYC 9554, the answer might surprise you.

Read the bars: the headline finding is that the array barely touches the host’s CPU resources. The most CPU-intensive workloads are the sequential throughput tests: 1M seq read at 0.84% overall util and 1M seq write at 0.85% overall util . In both cases the max_core_util_pct is 100% – a single core is fully saturated by the io_uring submission/completion thread. But with 128 cores, that one busy core registers as less than 1% of total system capacity. Every other workload – 4K random, AI, database, HTAP, VDI – consumes 0.03% to 0.12% overall util , again with one core at 100% for the submission path.
What this means: the array is not CPU-bound in any workload we tested. The io_uring submission thread is the bottleneck – it maxes out one core at ~20 GiB/s seq read and ~9.5 GiB/s seq write. The other 127 cores are essentially idle (sub-1% util). This has two implications: (1) there is enormous CPU headroom for compute workloads to run alongside the storage stack, and (2) the array’s throughput is currently limited by single-threaded submission, not by the drives or the PCIe fabric. A multi-queue submission design or multiple fio jobs could potentially push past this ceiling.
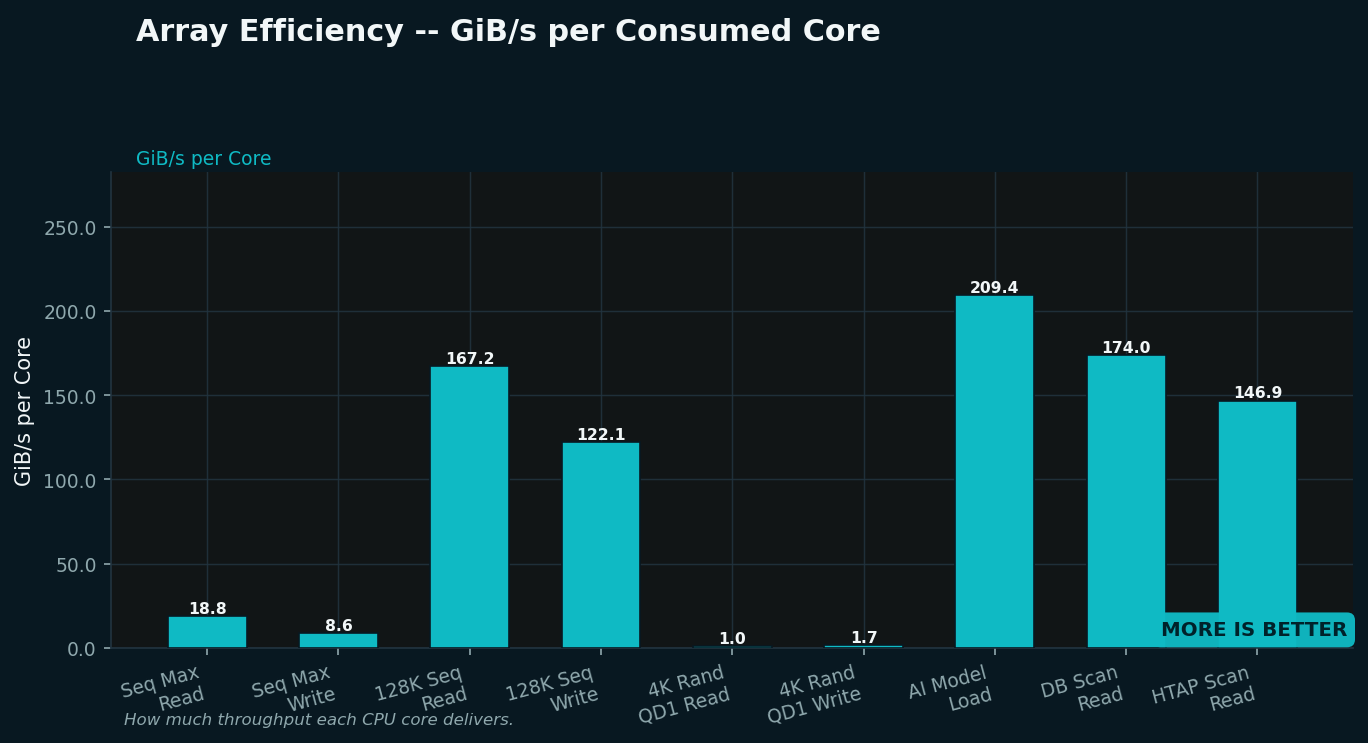
Read the bars: efficiency numbers are computed as (MiB/s / 1024) / (util_pct/100 * 128). The 128K sequential read achieves a staggering 167 GiB/s per core – because the overall util is only 0.05% while delivering 10,958 MiB/s. The 1M sequential read delivers 18.8 GiB/s per core (0.84% util for 20,748 MiB/s). Even the least efficient workload (4K QD1 read at 0.96 GiB/s per core) is still excellent by any reasonable measure.
Interpretation: these efficiency numbers are so high because the denominator (total CPU consumed) is tiny. A workload that uses 0.05% of 128 cores is using 0.064 cores. Dividing 10,958 MiB/s by 0.064 cores gives 167 GiB/s/core. The practical takeaway is that the array’s storage stack imposes almost no CPU tax – the EPYC 9554 has massive headroom for application workloads alongside the array.
CPU methodology detail
The fio per-job CPU counters tell a complementary story. For the 1M seq read test, fio reports usr_cpu = 1.34% and sys_cpu = 98.61% – the submission thread spends virtually all its time in kernel space (io_uring completions, md stripe lookups, XFS allocation). For the 1M seq write test, usr_cpu = 59.26% and sys_cpu = 40.70% – the write path has more userspace work (buffer management, write generation) before entering the kernel. The mpstats I was keeping an eye on confirm: iowait is 0.0% across all tests (the drives are fast enough that the CPU is never really waiting on I/O completion).
Key takeaways and conclusion
The 4x MemBlaze RAID10 array is a study in stack-bound performance. The drives themselves are capable of far more than the md+XFS path can deliver, especially on small-block random IOPS. But for the workloads that matter most in enterprise deployments – sequential bandwidth, large-block analytics scans, and multi-tenant fairness – the array delivers compelling numbers with vanishingly small CPU cost.
Where the array shines
- Sequential read bandwidth: 20.7 GiB/s (1M, QD64) – 1.66x a single MemBlaze drive, limited by single-threaded io_uring submission rather than drive capability.
- Large-block analytics: 256K OLAP scan read at 15.4 GiB/s – the array’s best single-direction throughput, ideal for columnar database scans.
- Multi-tenant fairness: 4 and 8 concurrent tenant streams show consistent per-job latency and throughput without starvation – a genuine enterprise VDI strength.
- Log write latency: sub-40 us p99.99 with 8 concurrent fsync-heavy jobs – exceptional for a RAID10 array, likely benefiting from distributed write cache across four drive controllers.
- CPU efficiency: the array consumes less than 1% of a 128-core EPYC for any workload. There is enormous headroom for compute alongside storage.
Where the array does not scale linearly
- Small-block random IOPS: the array plateaus at ~170K 4K read IOPS (QD16+) and ~163K 8K read IOPS – about 19-22% of a single drive’s peak. The md+XFS stack, not the drives, is the bottleneck.
- Sequential write: 9.6 GiB/s (1M) is about 0.89x a single drive. RAID10 mirror write amplification (every write hits two members) plus XFS journal overhead cap write throughput below single-drive performance.
- Single-threaded submission ceiling: the io_uring submission thread maxes out one core at ~20 GiB/s read. To go higher, the workload must be split across multiple fio jobs or use a multi-queue submission strategy.
- Drive wear asymmetry: two of the four drives have significant prior wear (259 TBW and 811 TBW vs 5-13 TBW). This may affect write performance and endurance balance in the array.
The bottom line
The 4x MemBlaze P7A40 RAID10 array is a sequential bandwidth monster that barely touches the host CPU. If your workloads are built around large-block scans, AI model loading, analytics queries, or multi-tenant virtual desktop infrastructure, this array delivers genuinely impressive throughput with exceptional CPU efficiency. The 20+ GiB/s sequential read and 15+ GiB/s analytics scan bandwidth are real and reproducible.
But the array is not a small-block random IOPS champion. The md+XFS stack caps random reads at roughly 170K IOPS regardless of queue depth – a single raw NVMe drive can outperform the array on these workloads. If your database workload is dominated by buffer-cold OLTP page fetches at high concurrency, you may be better served by a fast single drive or a raw-device bypass (like SPDK) rather than a kernel md RAID10 array.
The CPU utilization findings are perhaps the most surprising result of this review: the array consumes less than 1% of a modern EPYC’s cores even at peak throughput. For shared infrastructure where the same host runs compute and storage, this is a significant advantage – the array gets out of the way and lets your applications use the CPU budget.
The single biggest bottleneck is the io_uring submission thread. A multi-queue approach (multiple fio jobs, or a userspace storage engine) could potentially double or triple the array’s sequential throughput. That is an experiment for a future review.