Ryzen Pre-Week 25 fabrication RMA issue

Just doing a build test with an affected CPU under new BIOS + microcode. (Still waiting for them to tell me that they will ship out a part/have one available)

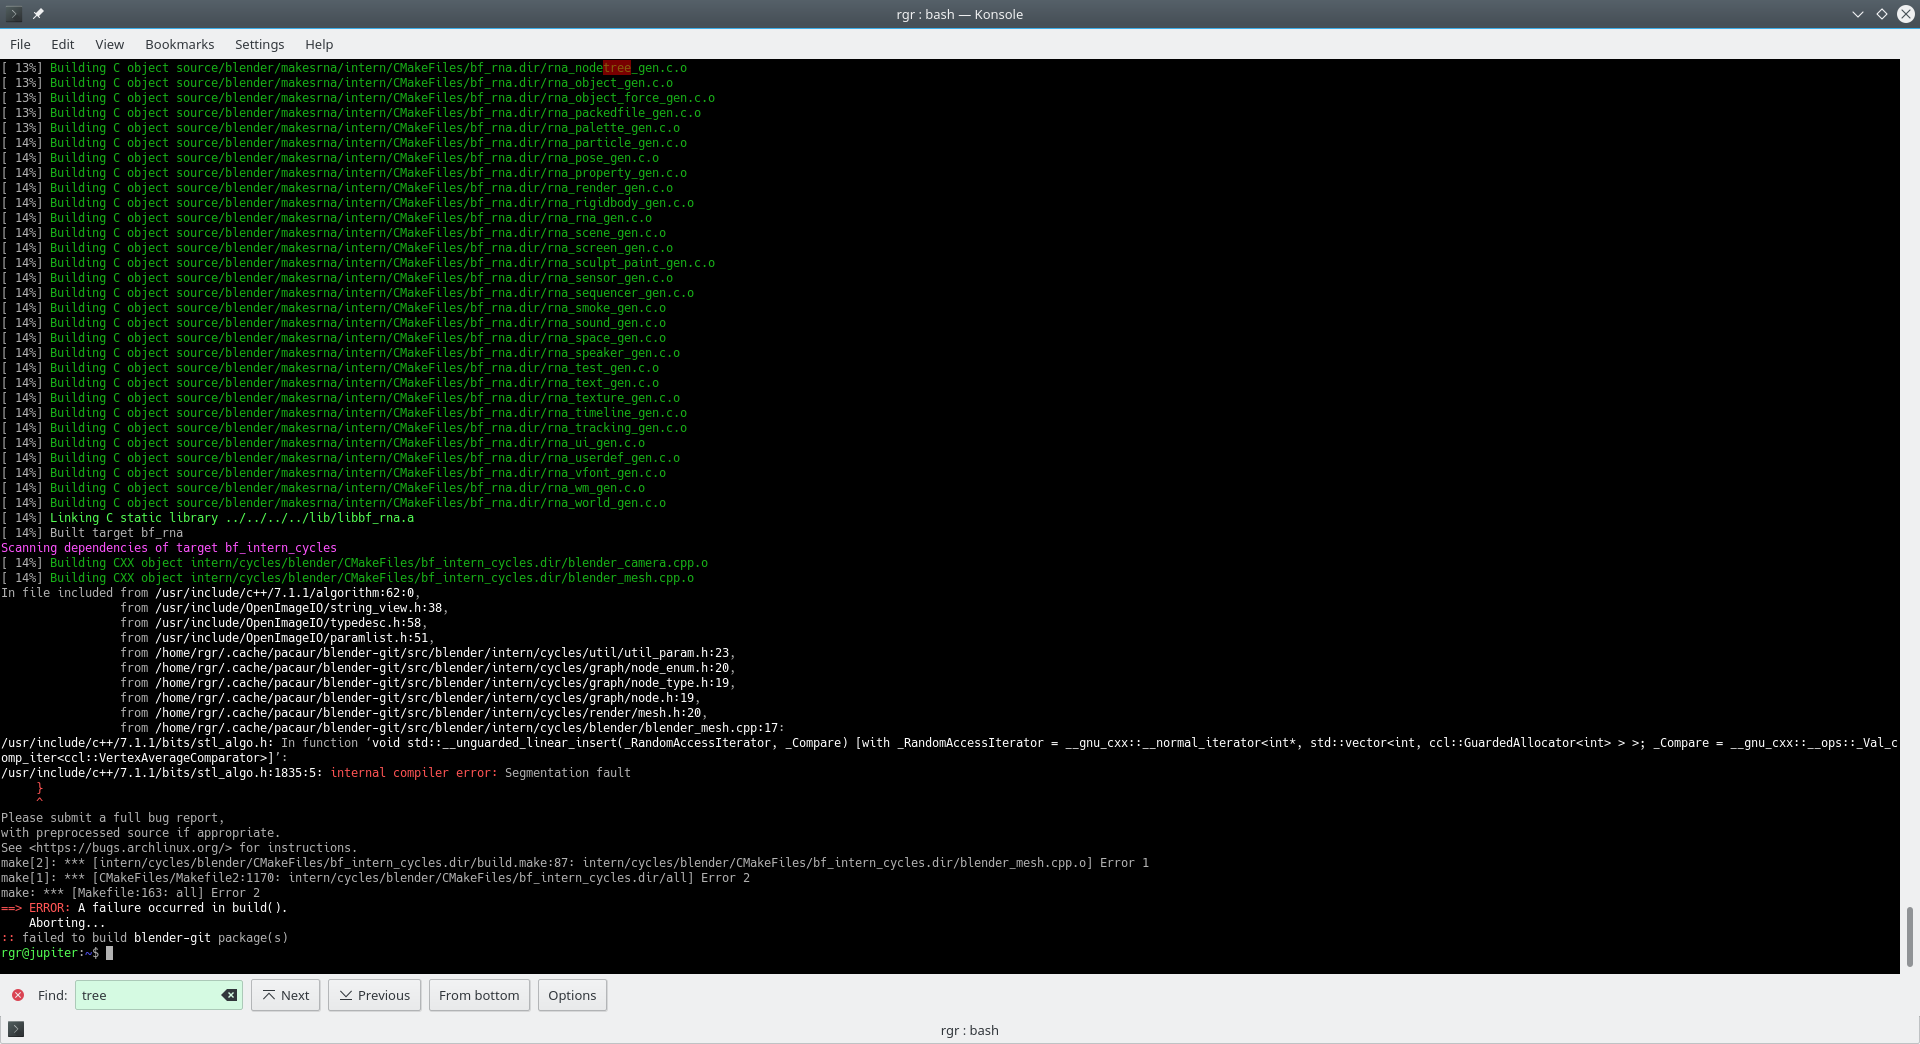
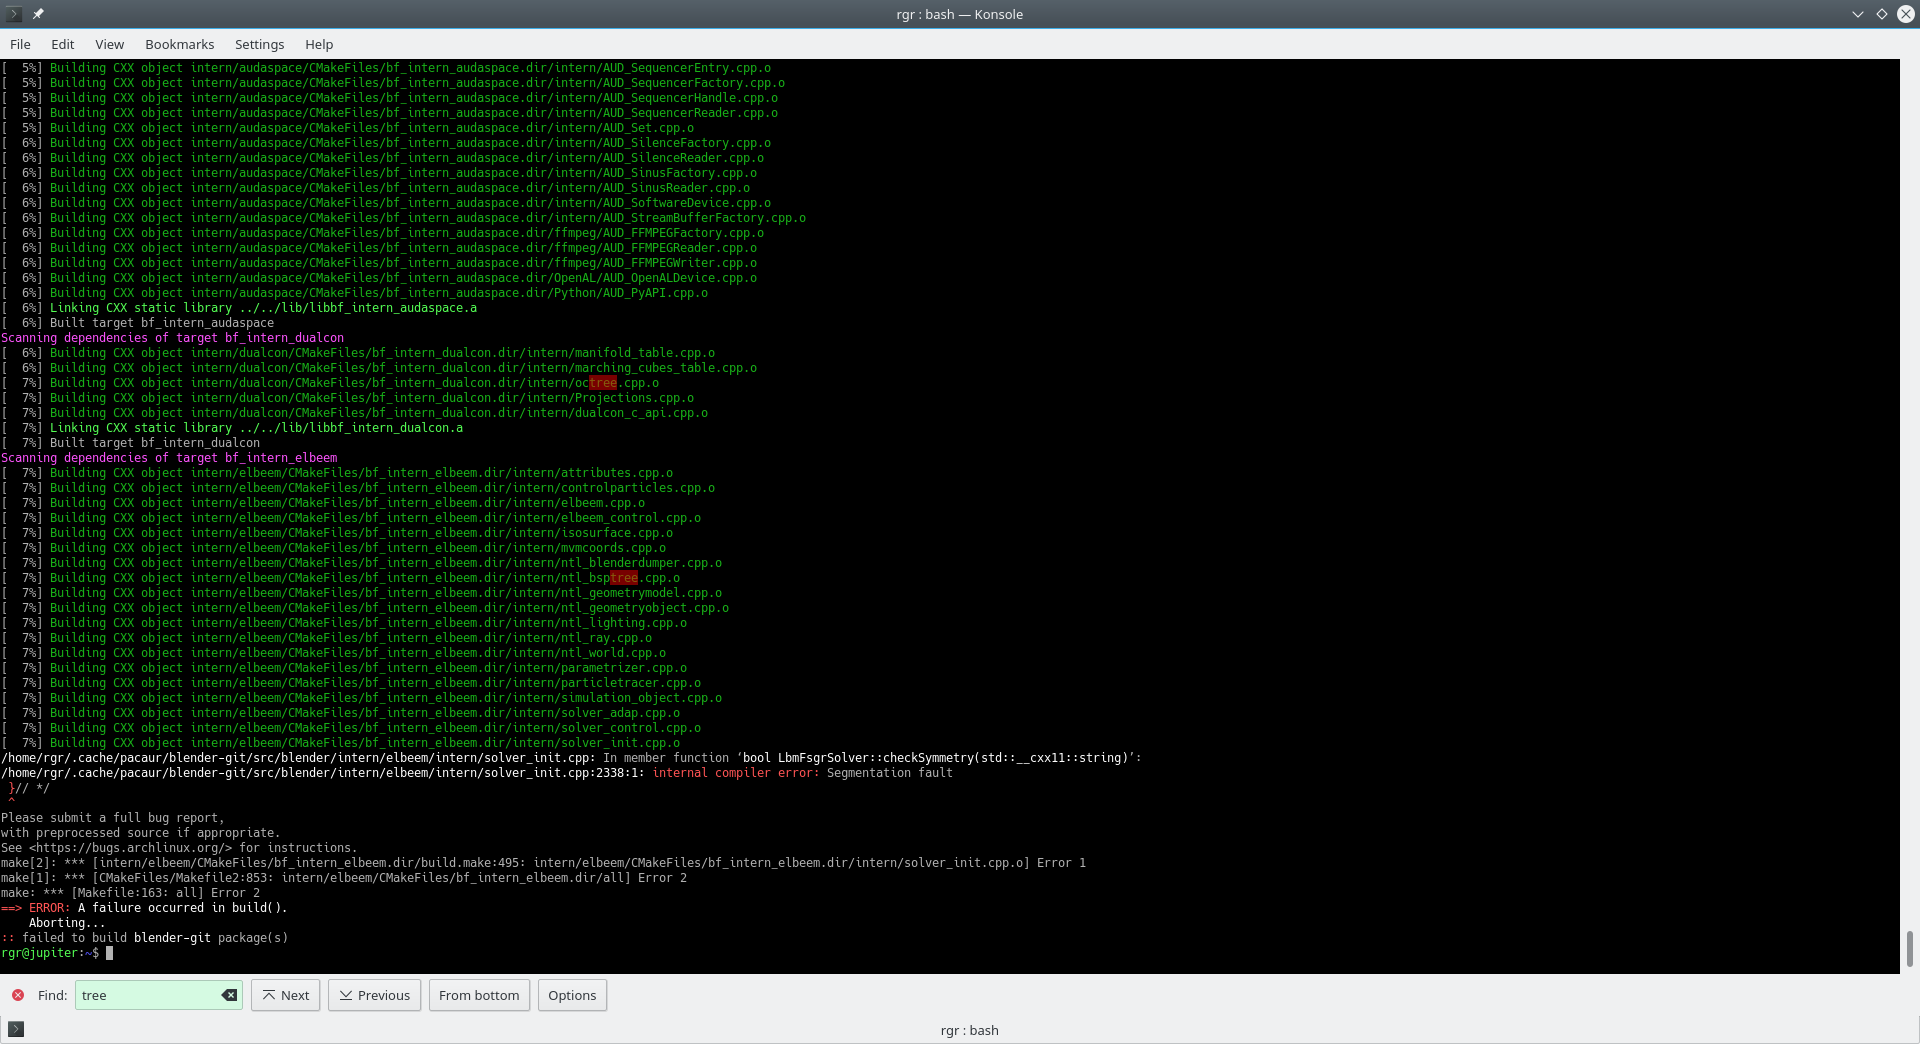
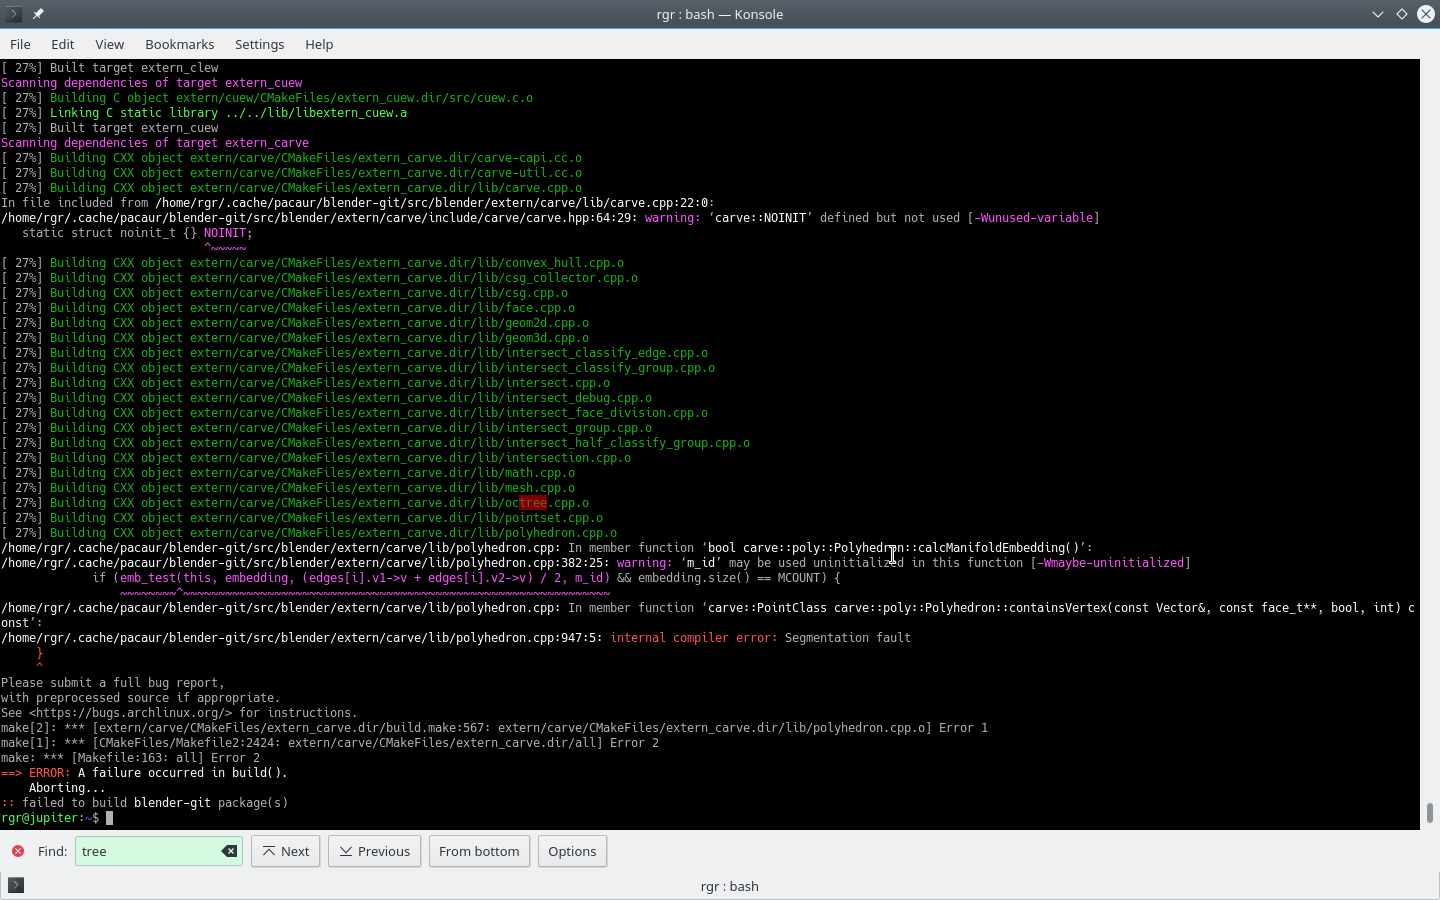
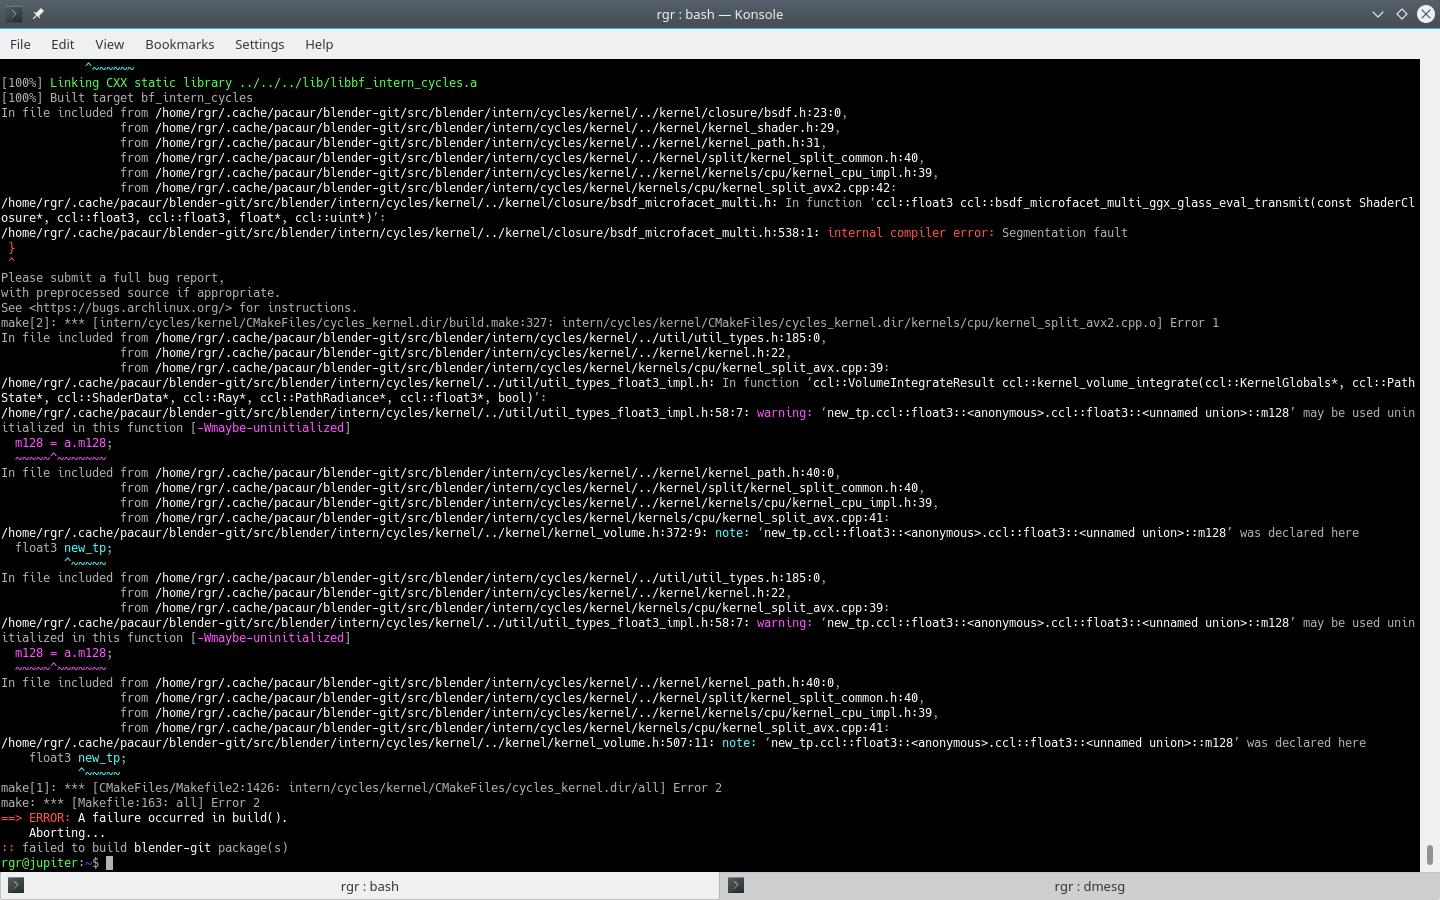
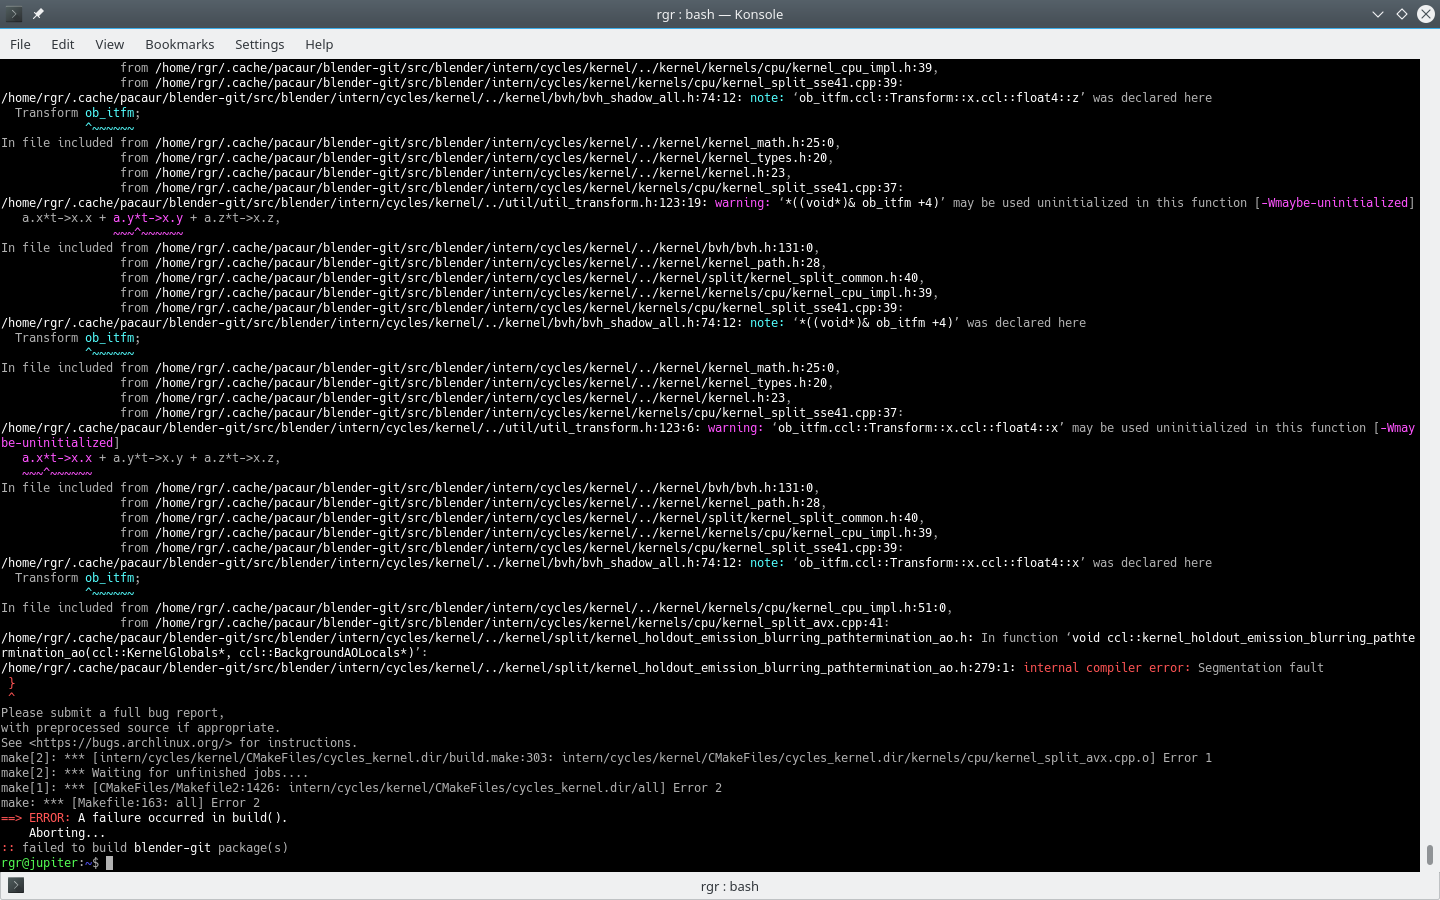
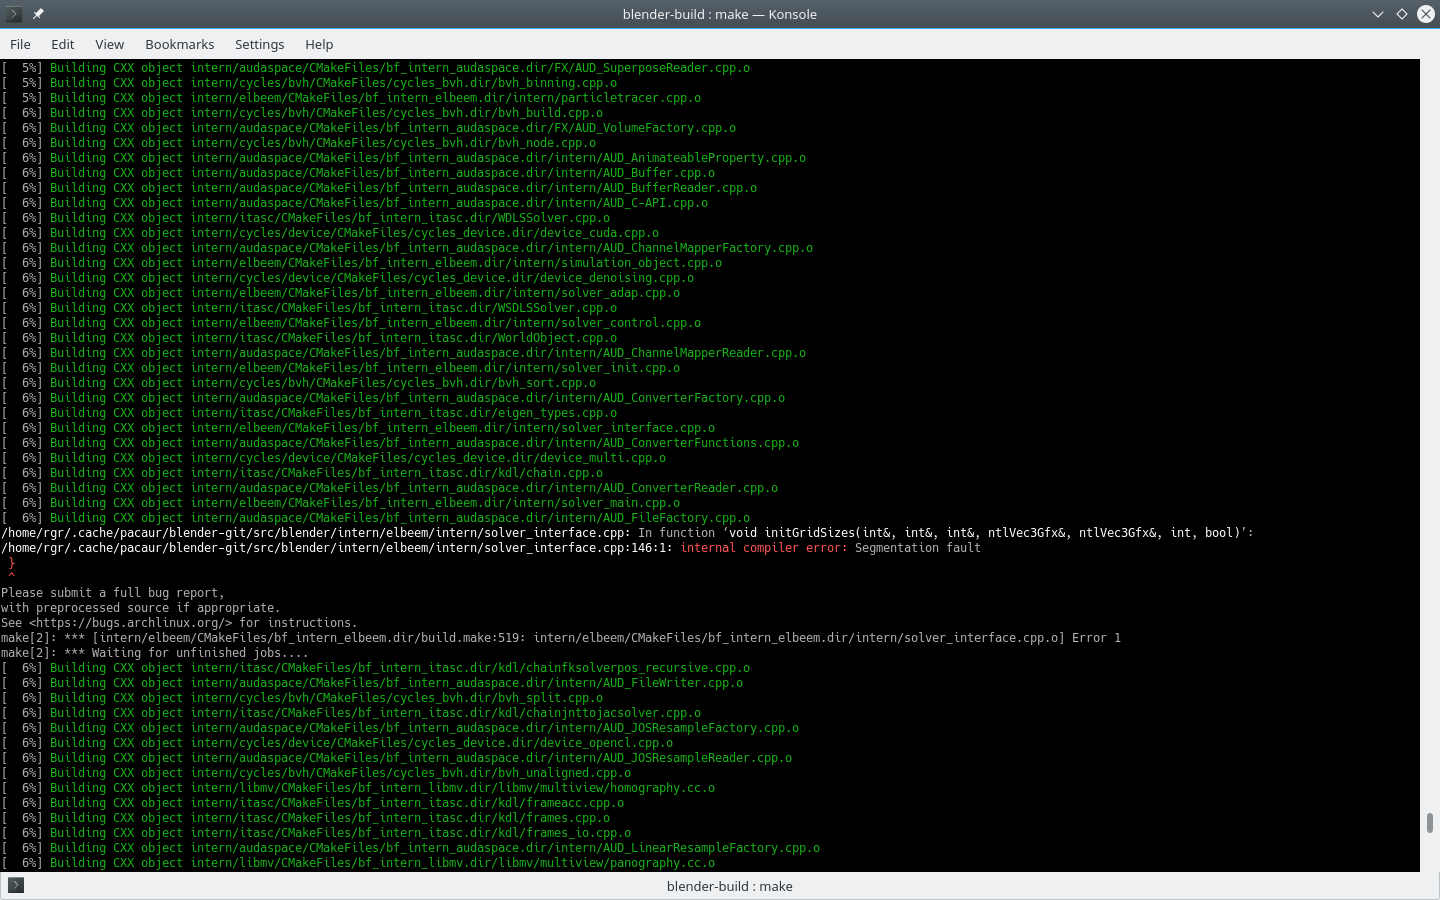
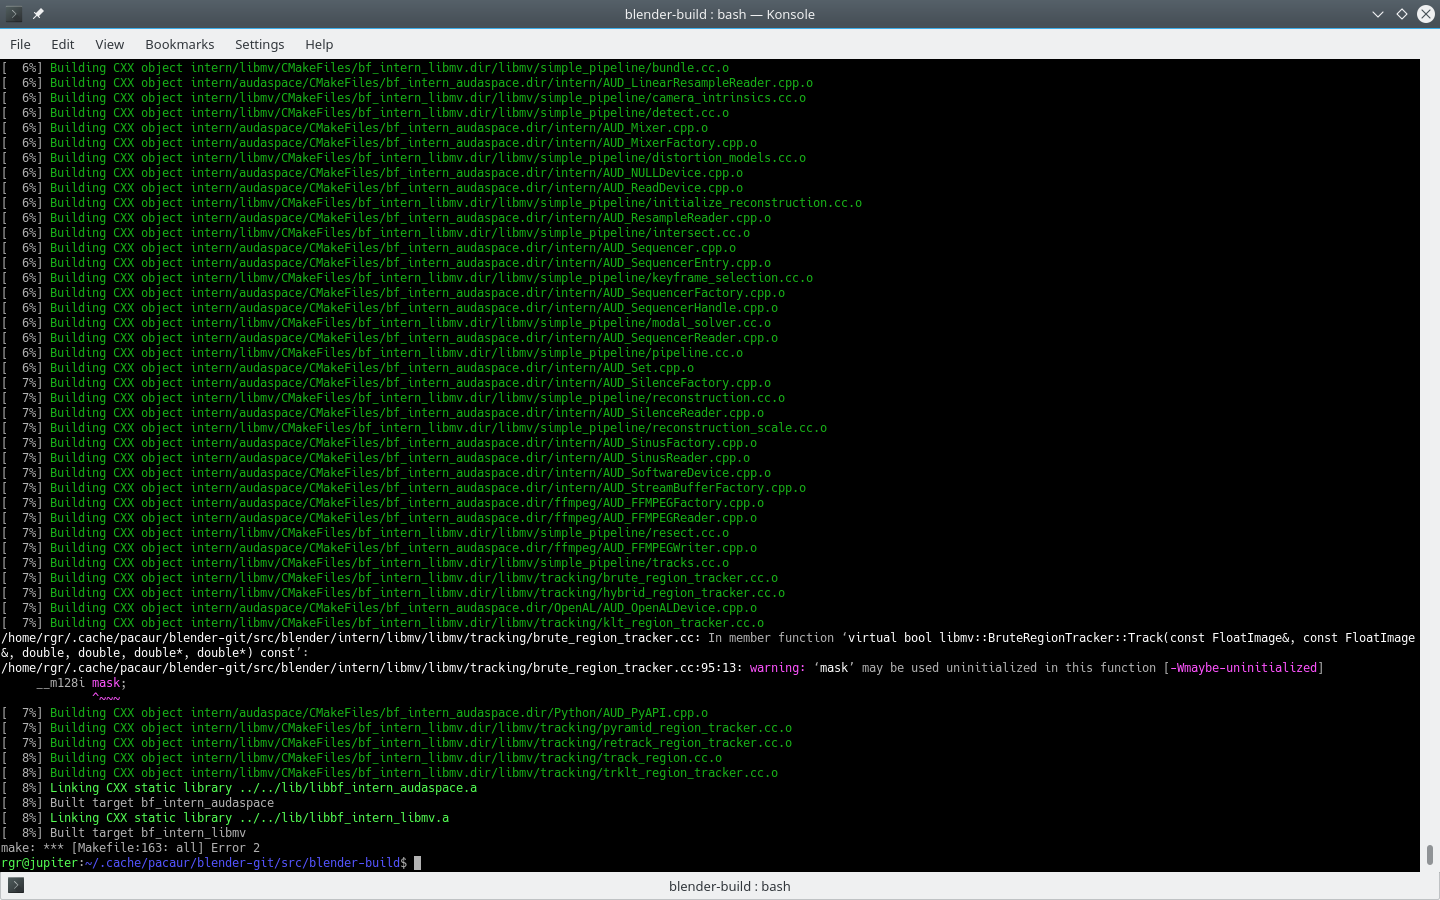
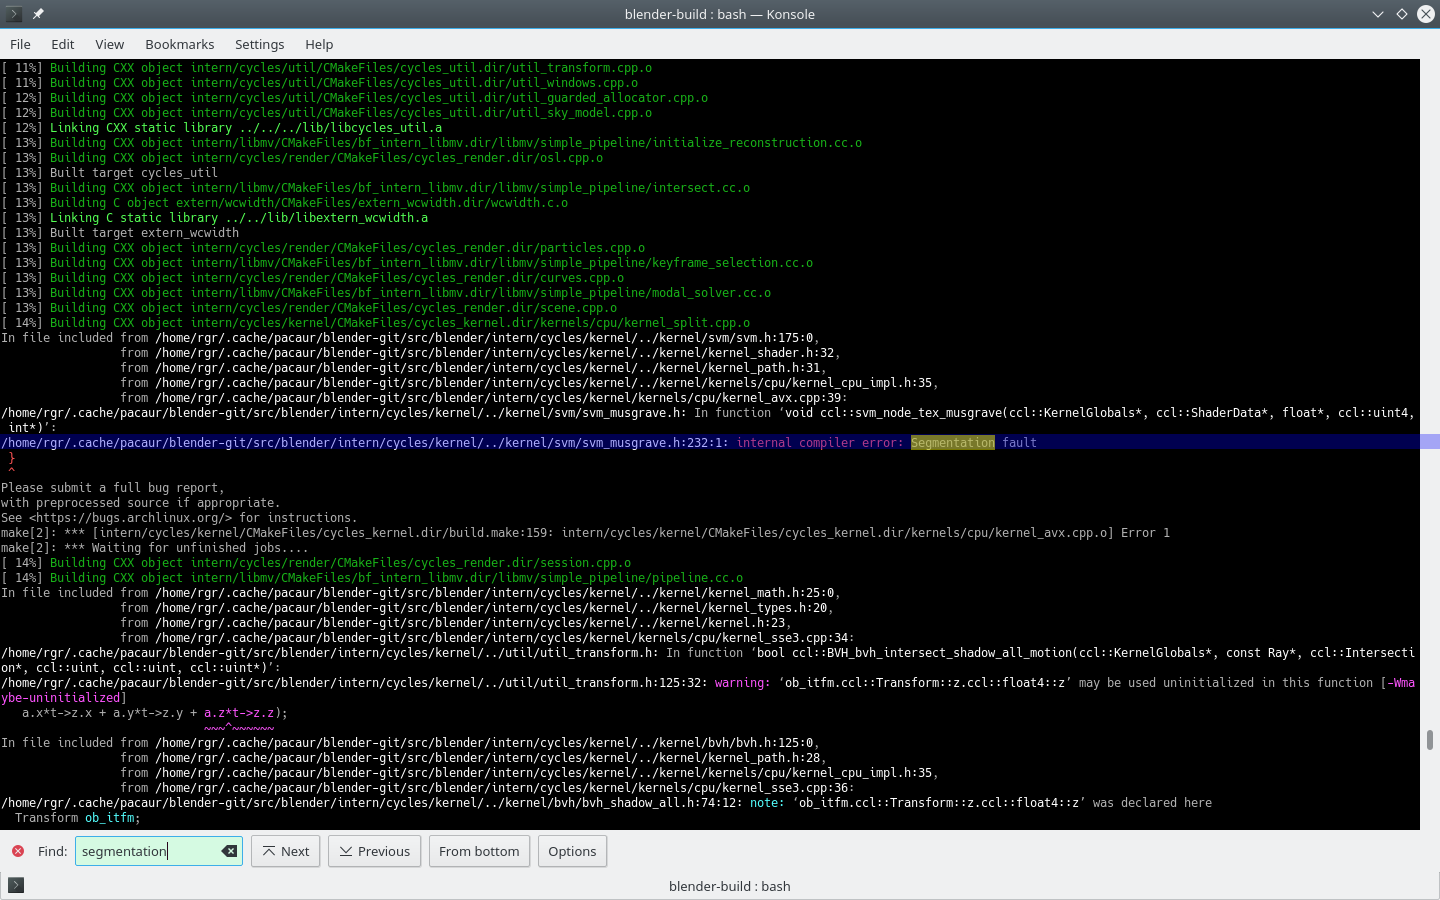
Doesn’t seem to affect the segfault voodoo. It’s really bad with building blender. Muuuuch worse than GCC stress build.
And even then it’s completely unpredictable.

All builds at same settings:

1.1V SoC, 2133MHz JEDEC RAM, 1.365V vCore, LLC Level 1.

Starting from a clean state every time.

1st attempt (1thread)

2nd attempt (1thread)

3rd attempt (1thread)

Attempt 4 (16 threads)

Aaaand, even that failed:

Attempt 5 (16 threads)

Fails at 100% almost complete

Attempt 6 (16 threads)

Simply stopped no fail or success.

Attempt 7 (16 threads)

Passed

This is the kind of insanity I am looking at here.
And yes GCC kill-ryzen got nothing on this. NOTHING

So you’d think it’s the RAM… Well ran memtest V7.4 + Hammer several times. Passed every time.

4 Likes

Infact I’m now going to prove that the AMD recommended ‘segfault fix’ settings are actually worse for this scenario.

3 Likes

If you need a second machine for validation and can talk me through how to fly the thing, I’m game.

If you’re on arch linux it should be as easy as pacaur/yaourt -S blender-git

You can also use pacaur -Se blender-git and edit the build script to use make -j16.

I will post another one guide for a general clean build from the git repo.

So stock settings, with 1.365V at LLC Level 4.

1st Build (16 threads)

failed while linking executable (100%)

2nd Build (16 threads)

pass

3rd Build (16threads)

Passed again

After that I’m going to demonstrate that Default (auto) voltage on vCore at LLC4/5 and 0.950V SoC is even more reliable.

Oh and disabling uOP cache,SMT, C states, Cool and Quiet does nothing to this. I’ve tried those.
Only thing that has any effect is Voltages and LLC.

2 Likes

This is all you need:

https://wiki.blender.org/index.php/Dev:Doc/Building_Blender/Linux/Ubuntu/CMake

You can also use the commands from the arch PKGBUILD as a guideline

https://aur.archlinux.org/cgit/aur.git/tree/PKGBUILD?h=blender-git

1 Like

Cool, gonna look at that. Currently running the build from the GUI package manager in manjaro.
… because casual GUI pleb.

Are you still pre-heating the CPU with mprime or is that not even needed?

Nope.

Not even needed to run mprime.
Btw by default the PKGBUILD runs with only one thread to build so it’s going to take while. Either way that doesn’t seem to affect how it fails. It fails early on 1 thread or later on 16threads but around the same time.

Yup, segfault. Gonna rerun and than gonna set everything to default / base spec and do it again.

I presume it’s the same Internal Compiler Error: Segmentation Fault?
Not the stack trace on dmesg.

Correct.

internal compiler error: Segmentation fault

It seems that it is using more than just one thread exclusively or maybe htop isn’t fast enough to show it. It is jumping threads anyway.

Ok so here is build with my tweaks:

Vcore default (auto)
SoC 0.95V Calibration Level 1.
CPU LLC Level 4.

Build 1 (16threads)

Fail

Build 2 (16 threads)

Pass

Build 3 (16 threads)

Pass

Build 4 (8 threads)

Fail

Of note here is that the build almost always fails in sections of blender kernel render code that are AVX/SSE3 heavy.

Wasn’t the voltage thing in some parts of the chip related to that as well?
I didn’t realize this is still the same issue.


Ongoing here, for much longer than the first time when I had mprime -t running and started the build and then after a few minutes killed mprime. Maybe the shift of workload can trigger it easier.

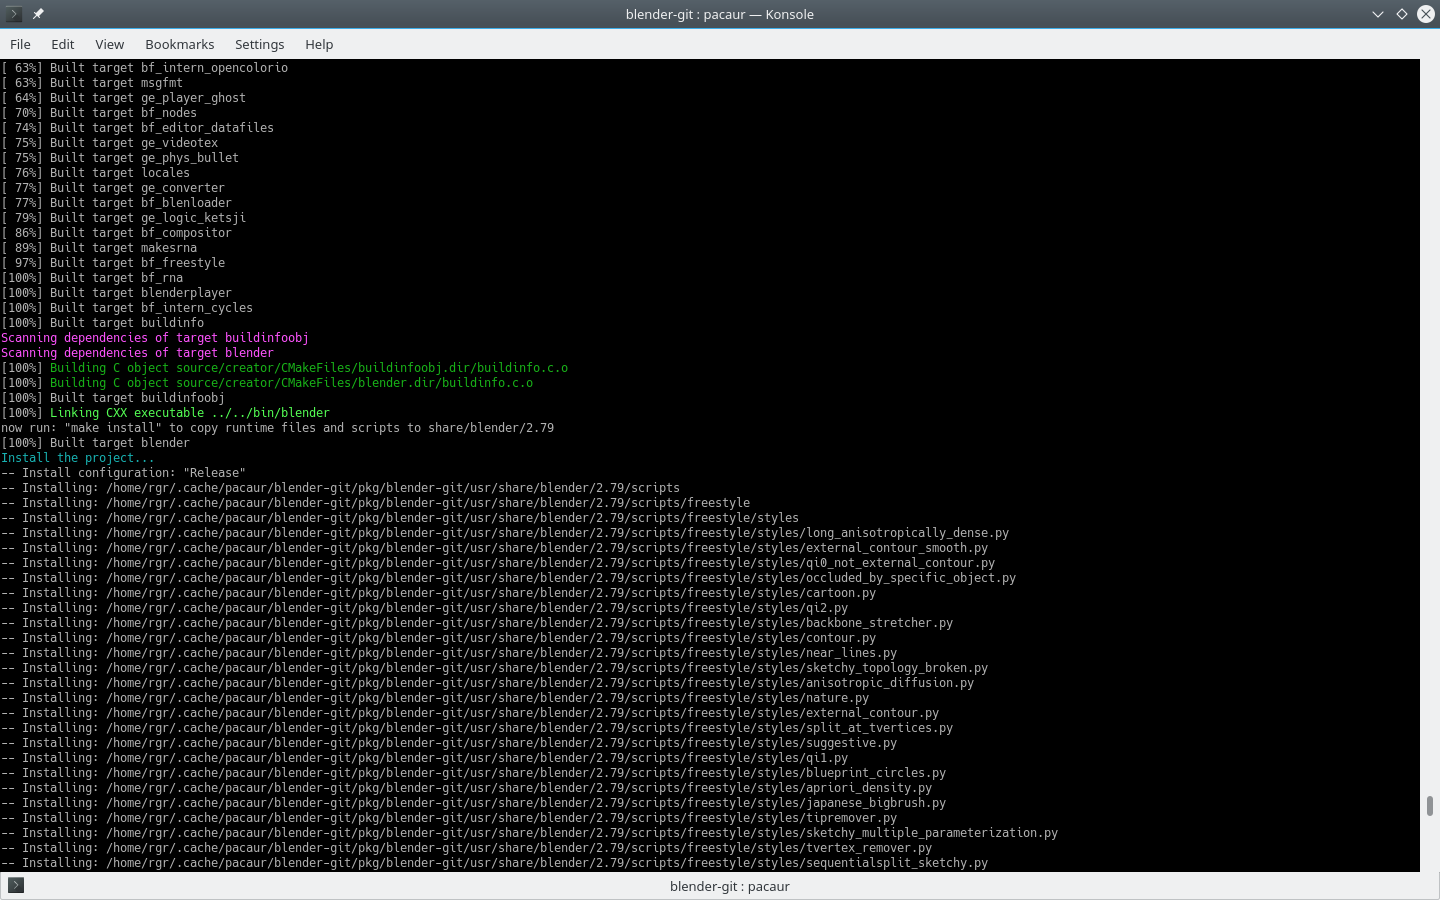
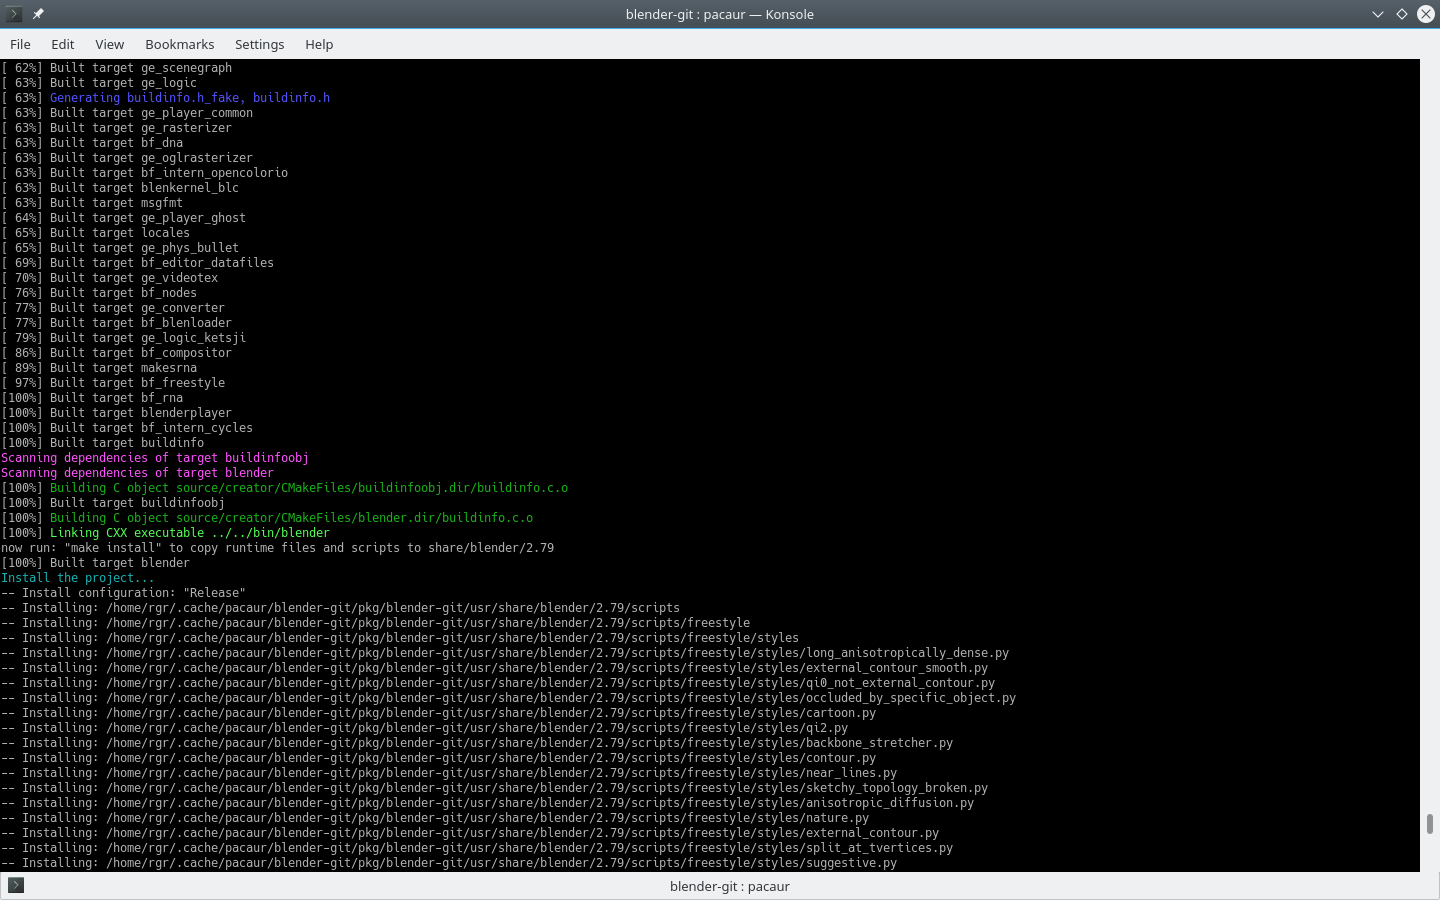
Seems to be stuck forever at

[ 16%] Building CXX object intern/cycles/kernel/CMakeFiles/cycles_kernel.dir/kernels/cpu/kernel_sse41.cpp.o

Does that happen, just getting stuck for half an hour?

For the record, running at the moment:
R7 1700 @ stock clock,
vcore offset + 0.050
SOC offset + 0.025
DDR4 2933 at 1.35V on four sticks

Yes the weird stopping can also happen.

But this is not related to the FMA3 power issue. This seems to be an entirely different general power issue that affects wider parts of the system.

1 Like

Build 2 (8 threads)

Fail

Build 3 (8threads)

Fail

It’s hardly stable but your chances of a successful build increase the more threads you use…
This is bizarre.

Build 4 (8 threads)

Fail

Build 5 (16 threads)

Ofcourse it damn passed…

I’ll try compiling blender on my 1800x running Slackware-current. Should be interesting.
Note that the uOP cache and using “sysctl kernel.randomize_va_space=0” really helped on my system.

1 Like

It is, you would guess it had to be the other way around.


Cancelled the stuck one, so this is build 3. Again in filthy GUI.

make[2]: *** [intern/itasc/CMakeFiles/bf_intern_itasc.dir/build.make:63: intern/itasc/CMakeFiles/bf_intern_itasc.dir/Armature.cpp.o] Error 1
make[1]: *** [CMakeFiles/Makefile2:1018: intern/itasc/CMakeFiles/bf_intern_itasc.dir/all] Error 2
make: *** [Makefile:163: all] Error 2
==> ERROR: A failure occurred in build().
    Aborting...

OK, now stock volts and settings for everything.

Another build with 16 threads
Pass again

I can keep on going but you should get the picture.

Going to see if I can make a ryzen-kill script for building blender.

2 Likes

Ok so disabled ASLR (uOP Cache still on)
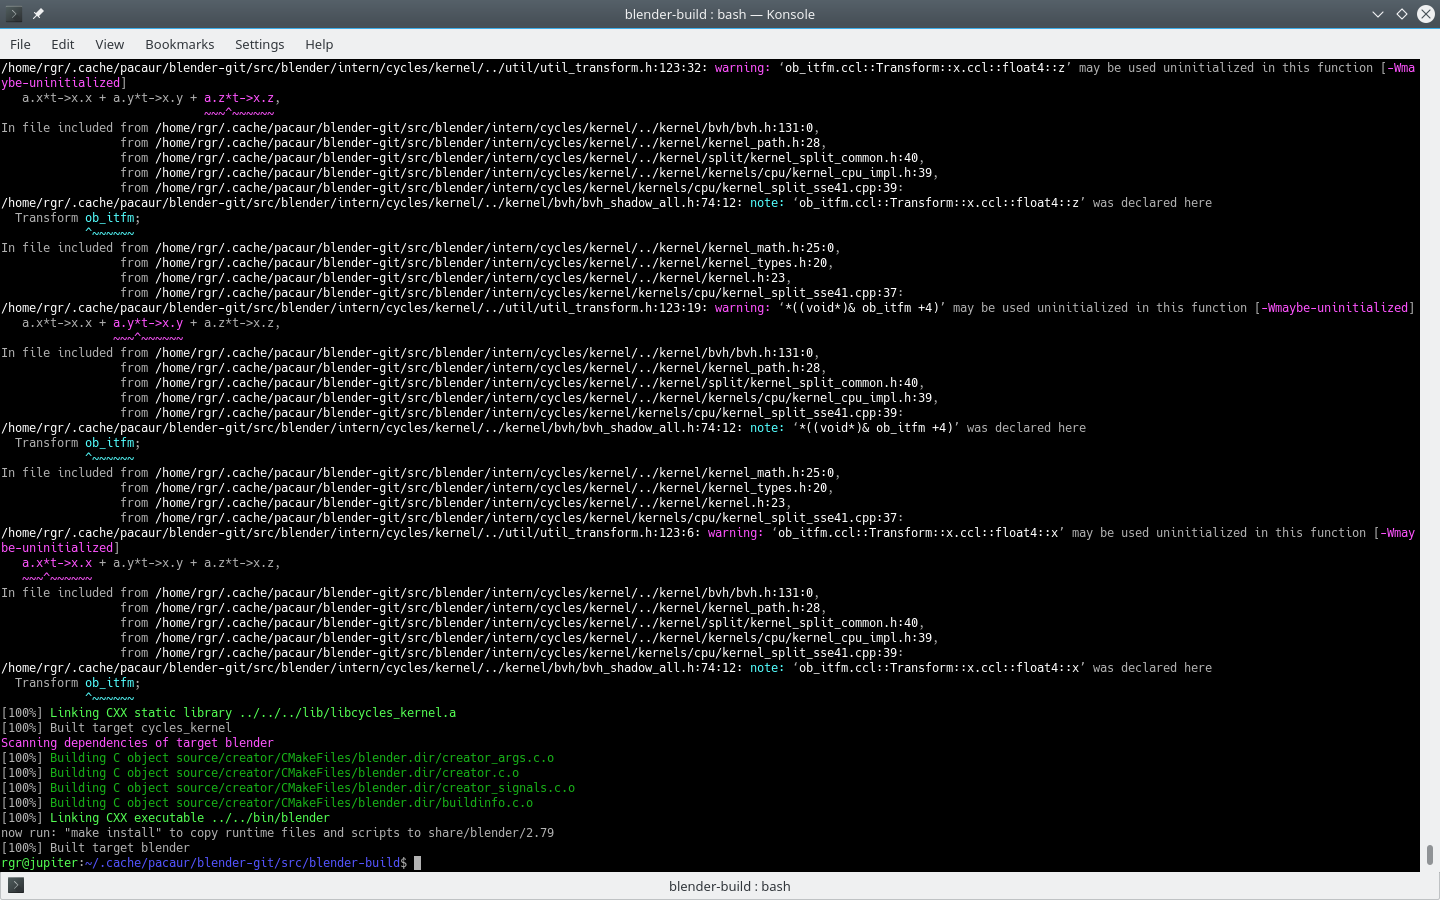
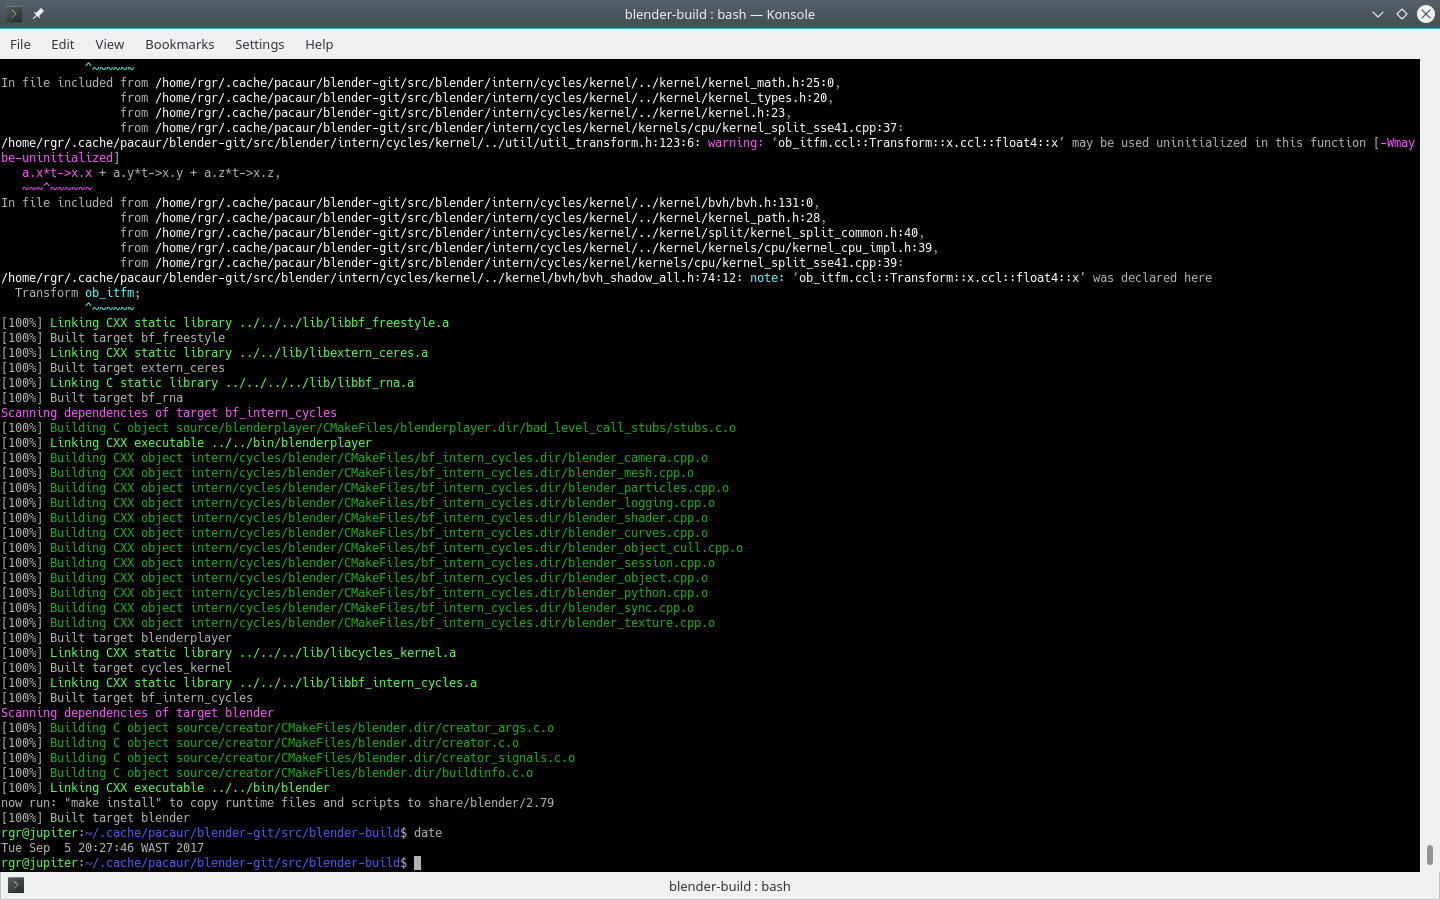
For the first time ever an 8 thread build has passed.

Num passes of 8 thread builds: (updating as it goes)
4

So hypothesis is that process address space complexity/size has a large effect.
Let’s try a single thread after another 2 8 thread builds if those don’t fail.

R7 1700 @ stock clock
SOC - auto
Vcore - auto
DDR4 2133 at 1.35V on four sticks

in filthy GUI mode.

make[2]: *** [intern/itasc/CMakeFiles/bf_intern_itasc.dir/build.make:255: intern/itasc/CMakeFiles/bf_intern_itasc.dir/Scene.cpp.o] Error 1
make[1]: *** [CMakeFiles/Makefile2:1018: intern/itasc/CMakeFiles/bf_intern_itasc.dir/all] Error 2
make: *** [Makefile:163: all] Error 2
==> ERROR: A failure occurred in build().
    Aborting...

Gonna try dat thing with the text now. :stuck_out_tongue: