Often very low (~1 Mbit/s) NAS write speed with QLC SSDs [TrueNAS Core]

Hi all!

I recently built myself a NAS with the intention of storage via NFS (for daily backup via rsync or borg), a Plex server and a few VMs. My special requirement is no noise as this is my dorm room. Edit: Fans are in semi-passive mode (off < 45 celcius) and the temperature is usually around 42 degrees.
I am using an old desktop system (Ryzen 5 1600, Fatal1ty AB350 Gaming-ITX, 32GB RAM, 4x 1 TB Crucial BX500 QLC SSDs (CT1000BX500SSD1) + boot SSD) connected via 1 Gbit ethernet. (Edit: SSDs raid-z1, connected via motherboard SATA ports, and one via cheap expansion card – I had the same issue without the expansion card though.)
Yes those SSDs tank once you fill their cache (going down to ~ 30 MB/s when used alone), but I don’t plan on having long sustained writes (actually maybe later but then I will to add a 1TB 970 EVO or so as write cache), new data moved to the NAS should come in slow increments.
If I copy a single large file (~4GB) I get my full 1 Gbit/s speed for about a minute and then drop to 200 Mbit/s, this is what I would expect for QLC and cache. Reading files as expected is not an issue though (running at full 1 Gbit/s speed).

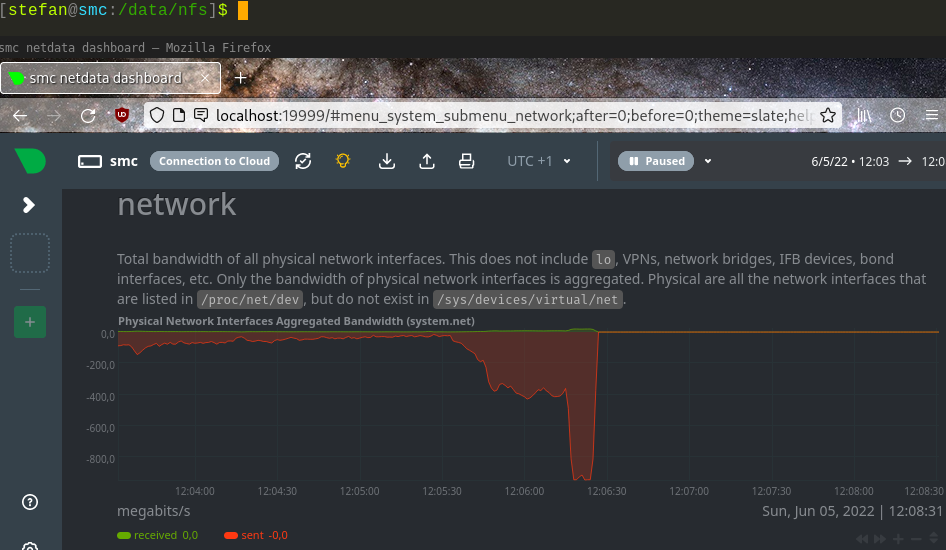
My problem now is that the performance frequently drops to the <1 MB/s level when transferring small-ish files (rsync home directory), for no apparent reason. Sometimes the speed goes up for a minute and down again. I don’t think this is the expected QLC penalty. Here’s a picture of my network transfer rate, with a good speed at the beginning (middle of screenshot) and then the drop to 1 Mbit/s levels.

And here is iostat -w 1 -n 5 -d on my NAS at the same time. I’m rsync-ing my home directory. In this section rsync was working on (~/.cache/mozilla/firefox/) and, after about a minute, the transfer rate (on my network adaptor) dropped from 200 Mbit/s to ~1 Mbit/s. At the same time the transactions per second (tps) drop from ~1000 to ~10.

            ada0             ada1             ada2             ada3             ada4 
  KB/t tps  MB/s   KB/t tps  MB/s   KB/t tps  MB/s   KB/t tps  MB/s   KB/t tps  MB/s 
  0.00   0  0.00   9.46 876  8.09   9.33 876  7.98   9.25 876  7.91   9.45 876  8.08 
  0.00   0  0.00   9.36 892  8.16   9.27 892  8.07   9.12 892  7.95   9.36 892  8.16 
  0.00   0  0.00  11.73 1194 13.68  11.86 1169 13.54  12.72 1090 13.54  11.66 1208 13.76 
  0.00   0  0.00   9.78 903  8.63   9.70 903  8.55   9.56 903  8.43   9.78 903  8.63 
  0.00   0  0.00   9.18 897  8.04   9.03 897  7.91   9.02 897  7.91   9.18 897  8.04 
  0.00   0  0.00  10.63 592  6.15  10.47 592  6.06  10.35 593  6.00  10.77 600  6.31 
  0.00   0  0.00   9.64 725  6.82   9.47 725  6.70   9.47 724  6.69   9.51 716  6.66 
  0.00   0  0.00  13.28 1168 15.15  13.19 1157 14.90  13.65 1116 14.88  12.75 1218 15.17 
  0.00   0  0.00  10.99 867  9.31  10.84 867  9.18  10.69 867  9.06  10.99 867  9.31 
  0.00   0  0.00   9.53 878  8.17   9.39 878  8.05   9.31 878  7.98   9.53 878  8.17 
  0.00   0  0.00   9.91 888  8.59   9.83 888  8.52   9.58 888  8.30   9.91 888  8.59 
  0.00   0  0.00   9.45 897  8.27   9.32 897  8.16   9.24 897  8.09   9.45 897  8.28 
  0.00   0  0.00  10.60 400  4.14  10.52 398  4.09   9.17 367  3.29  10.33 412  4.16 
  0.00   0  0.00  19.79 153  2.95  20.86 144  2.93  50.98  59  2.93  18.07 168  2.96 
  0.00   0  0.00  18.49 122  2.21  18.06 124  2.19  43.41  54  2.30  18.28 123  2.20 
  0.00   0  0.00   7.42 146  1.06   7.30 148  1.05  13.26 127  1.64   7.41 148  1.07 
  0.00   0  0.00   6.91  11  0.07   6.91  11  0.07   7.27  11  0.08   7.27  11  0.08 
  0.00   0  0.00  15.00  32  0.47  15.00  32  0.47   9.28  25  0.23  14.00  34  0.46 
  0.00   0  0.00   6.95  62  0.42   6.85  60  0.40  11.26  55  0.61   7.07  61  0.42 
  0.00   0  0.00  15.56  27  0.41  15.56  27  0.41  13.42  31  0.41  15.56  27  0.41 
  0.00   0  0.00   6.18  11  0.07   6.18  11  0.07   6.55  11  0.07   6.55  11  0.07 
  0.00   0  0.00  10.93  15  0.16  10.93  15  0.16  10.40  15  0.15  10.67  15  0.16 
  0.00   0  0.00   7.38  13  0.09   7.08  13  0.09   7.38  13  0.09   7.38  13  0.09 
  0.00   0  0.00   8.51  87  0.72   9.81  75  0.72   9.57  79  0.74   8.17  96  0.76 
  0.00   0  0.00  12.21  19  0.22  11.79  19  0.22  12.42  19  0.23  12.42  19  0.23 
  0.00   0  0.00   6.18  11  0.07   6.18  11  0.07   6.18  11  0.07   6.18  11  0.07 
  0.00   0  0.00   8.33  12  0.10   8.33  12  0.10   8.00  12  0.09   8.00  12  0.09 
  0.00   0  0.00  12.62  13  0.16  12.62  13  0.16  12.31  13  0.16  12.92  13  0.16 
  0.00   0  0.00   9.56  87  0.81   9.26  89  0.80  10.70  71  0.74  10.46  78  0.79 
  0.00   0  0.00   8.31  13  0.11   8.31  13  0.11   8.57  14  0.12   8.62  13  0.11 
  0.00   0  0.00  10.00  14  0.14  10.00  14  0.14   9.71  14  0.13   9.71  14  0.13 
  0.00   0  0.00   7.50  16  0.12   7.25  16  0.11   7.50  16  0.12   7.50  16  0.12 
  0.00   0  0.00   7.38  13  0.09   7.08  13  0.09   7.69  13  0.10   7.69  13  0.10 
  0.00   0  0.00  11.10  89  0.96  10.14  97  0.96  11.95  80  0.93  10.26  99  0.99 
  0.00   0  0.00  10.80  10  0.11  10.40  10  0.10  10.00  12  0.12  10.80  10  0.11 
  0.00   0  0.00   6.00  12  0.07   6.00  12  0.07   6.55  11  0.07   6.00  12  0.07 
  0.00   0  0.00   9.00  12  0.11   9.00  12  0.11   9.00  12  0.11   9.33  12  0.11 
  0.00   0  0.00  10.77  13  0.13  10.77  13  0.13   9.85  13  0.12  10.46  13  0.13 
  0.00   0  0.00   9.35  83  0.76   9.72  79  0.75  11.59  69  0.78   9.86  84  0.81 
  0.00   0  0.00  16.00  25  0.39  15.68  25  0.38  15.84  25  0.39  16.16  25  0.39 

I also get this issue if I copy, say, a bunch of mp3 files so it’s not tiny files only. It basically occurs in any workload I try, the performance goes down to “unusable” levels with single files often taking seconds to transfer.

Any ideas how to troubleshoot this problem? I suspect it’s drive related rather than protocol since sshfs shows a similar behaviour, but open to suggestions!

You stated that you got 4x1TB drives, but Iostat shows what appears to be 5 drives. But other than that…a raidz is always limited by the slowest drive, so one drive could be a bad apple. I know from m.2 NVMe drives, that depending on brand and firmware, sometimes the cache has very strange behavior of effectively stalling after it gets filled. But this should be known for your drive mode somewhere in the internets. Those atrocious numbers seen there look more like what one expect from HDD random writes, not from SSD (of any quality)

You should also check SMART status of the drives. TBW and general endurance values can give you some indicator if SSD wear is a thing. smartctl is a great CLI tool and is pre-installed on TrueNAS.

Does this only happen on writes or are reads affected too? If it’s just the writes, then my money is definitely on one of the SSDs having technical problems. When testing reads, make sure that the reads aren’t cached by the ARC. Reading 2x the size of your memory should do the trick

2 Likes

I can’t draw the conclusion from the above alone as a direct cause, but I have been aware the BX 500 is DRAMless., and that’s not amazing.

I haven’t used this drive in a raid format because I knew the single disk performance to be able to be abysmal on a desktop unit. The MX 500 is far better (not that I’m suggesting to replace, at this point but I know that to be true).

Two things to check -

  • fstrim -a (-a - all mounted filesystems that support discard) - it may not be running on your platform automatically.
  • fio
    • build a 4k rw test and check the native performance from local and remote e.g.

fio --name=zz_172789-rnd4k
–ioengine=posixaio --rw=randwrite --numjobs=1 --size=16g --time_based --runtime=60 --end_fsync=1
–bs=4k --iodepth=1

if it’s bad at this locally, then a ssd slog or l2arc may be helpful, but note the slog device isn’t really a write cache either.

1 Like

Thank you both for your replies!

Indeed the BX 500 is DRAMless & QLC so certainly not amazing. (I actually didn’t realize it was DRAMless before buying, otherwise I would have taken Samsungs QVO drives)

@exovert
The fio test (NFS) starts off with very good performance and slowly declines

Jobs: 1 (f=1): [w(1)][25.0%][w=175MiB/s][w=44.8k IOPS][eta 00m:45s]                            
Jobs: 1 (f=1): [w(1)][88.3%][w=19.9MiB/s][w=5105 IOPS][eta 00m:07s] 

At 100% the command doesn’t quit though, for a long time, and my network graph looks like there is still data being sent.


Now here’s the test on the local machine via ssh: Drops from 22k IOPS to ~3000 after 3 seconds and write oscillates between 5 MiB/s and 80 MiB/s

truenas% fio --name=zz2 --ioengine=posixaio --rw=randwrite --numjobs=1 --size=16g --time_based
--runtime=60 --end_fsync=1 --bs=4k --iodepth=1
zz2: (g=0): rw=randwrite, bs=(R) 4096B-4096B, (W) 4096B-4096B, (T) 4096B-4096B, ioengine=posixaio, iodepth=1
fio-3.27
Starting 1 process
zz2: Laying out IO file (1 file / 16384MiB)
Jobs: 1 (f=1): [w(1)][100.0%][w=69.7MiB/s][w=17.8k IOPS][eta 00m:00s]
zz2: (groupid=0, jobs=1): err= 0: pid=9464: Sun Jun  5 04:20:43 2022
  write: IOPS=5467, BW=21.4MiB/s (22.4MB/s)(1282MiB/60041msec); 0 zone resets
    slat (nsec): min=1062, max=7419.9k, avg=5255.93, stdev=20537.67
    clat (nsec): min=691, max=10564k, avg=176718.90, stdev=152151.56
     lat (usec): min=7, max=10567, avg=181.97, stdev=150.40
    clat percentiles (nsec):
     |  1.00th=[   1004],  5.00th=[  18816], 10.00th=[  27776],
     | 20.00th=[  33536], 30.00th=[  47872], 40.00th=[  56576],
     | 50.00th=[ 209920], 60.00th=[ 238592], 70.00th=[ 264192],
     | 80.00th=[ 296960], 90.00th=[ 350208], 95.00th=[ 407552],
     | 99.00th=[ 509952], 99.50th=[ 544768], 99.90th=[ 700416],
     | 99.95th=[ 806912], 99.99th=[1728512]
   bw (  KiB/s): min= 7041, max=90674, per=99.74%, avg=21812.99, stdev=21451.39, samples=118
   iops        : min= 1760, max=22668, avg=5452.92, stdev=5362.81, samples=118
  lat (nsec)   : 750=0.01%, 1000=0.91%
  lat (usec)   : 2=2.50%, 4=0.18%, 10=0.51%, 20=1.02%, 50=28.61%
  lat (usec)   : 100=10.96%, 250=20.71%, 500=33.38%, 750=1.15%, 1000=0.04%
  lat (msec)   : 2=0.02%, 4=0.01%, 10=0.01%, 20=0.01%
  cpu          : usr=0.95%, sys=2.23%, ctx=341351, majf=1, minf=1
  IO depths    : 1=100.0%, 2=0.0%, 4=0.0%, 8=0.0%, 16=0.0%, 32=0.0%, >=64=0.0%
     submit    : 0=0.0%, 4=100.0%, 8=0.0%, 16=0.0%, 32=0.0%, 64=0.0%, >=64=0.0%
     complete  : 0=0.0%, 4=100.0%, 8=0.0%, 16=0.0%, 32=0.0%, 64=0.0%, >=64=0.0%
     issued rwts: total=0,328266,0,0 short=0,0,0,0 dropped=0,0,0,0
     latency   : target=0, window=0, percentile=100.00%, depth=1

Run status group 0 (all jobs):
  WRITE: bw=21.4MiB/s (22.4MB/s), 21.4MiB/s-21.4MiB/s (22.4MB/s-22.4MB/s), io=1282MiB (1345MB), run=60041-60041msec

Did a 5 min follow-up run (so no significant cache available) and yeah, 5 MiB/s is what you get after the cache is gone.

truenas% fio --name=zz3 --ioengine=posixaio --rw=randwrite --numjobs=1 --size=160g --time_based
 --runtime=300 --end_fsync=1 --bs=4k --iodepth=1
zz3: (g=0): rw=randwrite, bs=(R) 4096B-4096B, (W) 4096B-4096B, (T) 4096B-4096B, ioengine=posixaio, iodepth=1
fio-3.27
Starting 1 process
zz3: Laying out IO file (1 file / 163840MiB)
Jobs: 1 (f=1): [F(1)][100.0%][eta 00m:00s]                          
zz3: (groupid=0, jobs=1): err= 0: pid=9523: Sun Jun  5 04:27:45 2022
  write: IOPS=1354, BW=5417KiB/s (5547kB/s)(1602MiB/302897msec); 0 zone resets
    slat (nsec): min=1113, max=1848.3k, avg=3782.29, stdev=8921.85
    clat (nsec): min=751, max=482482k, avg=726177.92, stdev=3626246.70
     lat (usec): min=8, max=482484, avg=729.96, stdev=3626.24
    clat percentiles (usec):
     |  1.00th=[    21],  5.00th=[    28], 10.00th=[    30], 20.00th=[    44],
     | 30.00th=[    80], 40.00th=[   437], 50.00th=[   603], 60.00th=[   734],
     | 70.00th=[   857], 80.00th=[  1074], 90.00th=[  1450], 95.00th=[  1795],
     | 99.00th=[  2737], 99.50th=[  3228], 99.90th=[  5538], 99.95th=[  7373],
     | 99.99th=[202376]
   bw (  KiB/s): min=  147, max=81676, per=100.00%, avg=5486.46, stdev=10043.03, samples=589
   iops        : min=   36, max=20419, avg=1371.26, stdev=2510.77, samples=589
  lat (nsec)   : 1000=0.17%
  lat (usec)   : 2=0.63%, 4=0.05%, 10=0.04%, 20=0.11%, 50=21.37%
  lat (usec)   : 100=8.77%, 250=2.22%, 500=10.18%, 750=18.12%, 1000=15.51%
  lat (msec)   : 2=19.43%, 4=3.19%, 10=0.17%, 20=0.01%, 50=0.01%
  lat (msec)   : 100=0.01%, 250=0.03%, 500=0.01%
  cpu          : usr=0.47%, sys=0.75%, ctx=416049, majf=0, minf=1
  IO depths    : 1=100.0%, 2=0.0%, 4=0.0%, 8=0.0%, 16=0.0%, 32=0.0%, >=64=0.0%
     submit    : 0=0.0%, 4=100.0%, 8=0.0%, 16=0.0%, 32=0.0%, 64=0.0%, >=64=0.0%
     complete  : 0=0.0%, 4=100.0%, 8=0.0%, 16=0.0%, 32=0.0%, 64=0.0%, >=64=0.0%
     issued rwts: total=0,410168,0,0 short=0,0,0,0 dropped=0,0,0,0
     latency   : target=0, window=0, percentile=100.00%, depth=1

Run status group 0 (all jobs):
  WRITE: bw=5417KiB/s (5547kB/s), 5417KiB/s-5417KiB/s (5547kB/s-5547kB/s), io=1602MiB (1680MB), run=302897-302897msec

A sequential write test hovers between 25 and 35 MiB/s (fio --name=seqwrite --rw=write --direct=1 --ioengine=posixaio --bs=32k --numjobs=4 --size=2G --runtime=600 --group_reporting).

I have a good Samsung SSD (EVO, TLC w/ DRAM) than I can add as slog – what do you mean with “isn’t really a write cache” – is there a way to get truenas to write the first 1TB on the cache SSD and copy to the raid later (I know it’s not raid-ed while that happens, that’s fine, it’s movies and stuff that I can get again without problems).

The fstrim seems to be not available (I’m using TrueNAS Core) but I just enabled the Auto TRIM option.

@Exard3k Yes, ada0 is my boot drive (I should have said this). I briefly checked the drives when I got them and didn;t notice obvious problems, smartctl shows all PASS as well, and the drives are new (bought ~2 months ago).
Reads are fine, read 1TB over night at 87 MB/s via ethernet, and when I tested the drives reads seemed very fast too.

Actually just found this Reddit threat quoting similar write numbers for the (smaller 120GB) BX 500, so I think the numbers are probably accurate.

A consistent 5 MiB/s would be fine tbh, it’s more the inconsistent random drops to basically nothing, things like hanging at 100%, that are way more annoying in practical use.
So maybe adding a good SSD as SLOG would help avoid the IOPS bottleneck (which I assume is what causes the poor randwrite performance) and give me more reliable ~ 30 MiB/s?

Edit: Do I see this correctly that SLOG can only act as “backup cache” in parallel to the one in RAM, i.e. using my SSD gives me at most 16 GB of “write cache”?

This is not what ZFS (or the ZIL) does. A SLOG just allows sync writes to memory (and the SLOG as a safe non-volatile device) and gathers data to flush to disk in an optimized process (transaction groups). I doubt that a SLOG would improve your situation, as it only applies for sync writes and is certainly not a writeback cache like most people would define a cache. If you have lots of ARC, you can probably tweak ZFS to store more data in memory before the data gets flushed, but that’s a bunch of tunables and lots of testing and I personally never had need for that myself nor do I have 100s of GB of memory.

Solution A: Get another fast drive and create a second pool and periodically run a job to move data/replicate from that pool to the BX500 pool. Quick n dirty makeshift writeback cache, but works and is fast, yet far from an elegant solution.

Solution B: Just deal with it. If you later want to replace the drives, the BX500s can still be useful as L2ARC (read cache), as L2ARC is 99% reads and doesn’t need the drives to have high endurance or high write speed. But this only works if you got a slower storage tier like HDDs. Same with special vdev to a lesser degree.

Solution C: This issue is so crippling that you consider switching to a platform and filesystem that offers a true writeback cache. Migration is always a lot of work and one has to consider benefits and drawbacks.

Yeah I first checked the columns and saw 5 drives, but only seen ada0 having zero traffic later.

This is correct. See above why I don’t think it is of use to your situation.

3 Likes

Thank you, I understand!

In terms of option A), the main problem would be that e.g. an rsync update wouldn’t work as it doesn’t see the current files on the makeshift write cache, or generally I would have to mount two different devices – or are there software solutions (i.e. somehow mount a merged view of the two devices?) to get around this?

In terms of option C, do you know a free OS that I can use for NAS + writeback? I was thinking of Open Media Vault possibly?

Edit2: Nevermind, I think the YouTube comment section makes it clear that the video is wrong Edit: I just found this video by Craft Computing where he says you can set up a write cache by setting up a SLOG and then changing the “Sync” option to “Always”. He claims this will cause the data to be written from Memory to Cache SSD to Pool, accelerating the speed. I am not sure I believe that, but I will attempt to test this config.

1 Like

We all do mistakes. And SLOG is a rather unintuitive way on dealing with writes, so most people are confused and make mistakes. sync=all in fact makes your system slower if you usually only work with async traffic, as sync is more complex and always slower. a SLOG just negates most of the performance penalty of sync writes.

Another option could be striped mirrors (RAID10) for your SSDs. Write pressure on mirror drives is less than in a RAIDZ and having a second vdev also doubles write speed. Costs 50% (compared to 25% of your RAIDZ) usable capacity but is probably a more favorable configuration for your drives.

I only know of bcache for Linux, which can be used to make read and/or write cache from SSDs. But I lack experience with other NAS systems to be of any use here.

Okay I went with the other-OS solution using a writeback cache now. I’ve copied a few hundred GB via NFS and how the systems seems to be happily and slowly writing everything to the QLC SSDs.

To summarize for other people reading this, I have now installed Open Media Vault with
4 QLC SSDs → mdadm RAID5 → LUKS → LVM
and 1 TLC SSD → LUKS → LVM
then the writeback cache set up via LVM (see here), initially set up via LVM plugin and then set up cache via commandline. The encryption (LUKS) is mainly if I have to RMA SSDs via crypttab (md0-crypt /dev/disk/by-uuid/7e76e837-eeee-4ddc-9c32-3eefc35b98db /root/luks_keyfile luks nofail), initially set up via OVM plugin but adjusted to mount automatically.

2 Likes

My experience with ZFS is SSD cache does not help. Using mirror and stripe with 4 drives is fast. SSD cache is fast at first then goes very slow as the cache inside the SSD that made it fast is full. Same thing if you use SSDs as storage. A small optane cache won’t hurt because those don’t ever slow down.

This topic was automatically closed 273 days after the last reply. New replies are no longer allowed.