I know wendell gave a challenge to everyone to come up with an idea for using the home server is a way that could further everyone in their technical journeys.
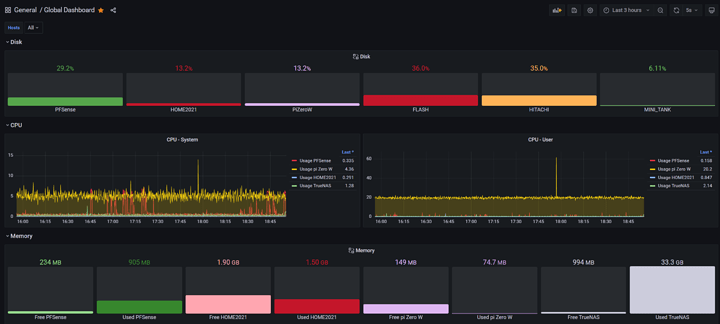
I have found that learning the (Instana / Grafana / Telegraf) suite of software beneficial in the enterprise.
A well designed application will tell you the reason it is experiencing an issue, but software is rarely well designed. This is where reporting using Grafana dashboards can show trends that would go unnoticed if you looked at system or application logs alone. Having a history of a poorly behaving application is a visual indicator of when, and where to look for optimization.
I have personally been able to use this suite to find issues quickly and get to the root cause of the problem. Almost everyone I show it to can immediately find a use for it. There are plenty templates available that you can beg, borrow, and steal.
A really good practical application is to run telelgraf agents on linux or windows hosts to collect data and use Grafana to build dashboards.
What might surprise everyone is this database (influxdb) and UI (grafana) can run on a raspberry PI, docker image, or full fledged enterprise installation.
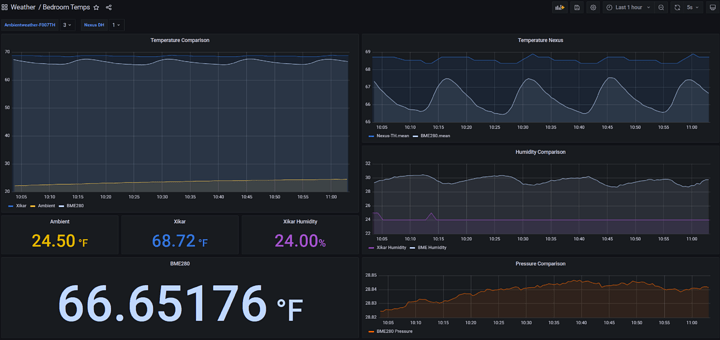
Monitoring temperature sensors is a popular use for this and you can learn a lot by building weather dashboards.

