Background
I’ve got two Xeon 8380 systems that you’ve seen in various videos and comparisons up till now: One configured as single-socket and one configured as dual-socket.
I also have not one but several of the Intel P5800X Optane SSDs – finest SSD on the market in all aspects except capacity.
Completing I/O round-trips is a big part of many server workloads. “The Netflix Usecase” is often particularly interest because it is a workload that consists of I/O, network traffic and lots of crypto. Streaming movies? Buy the least CPU that will fully saturate the network connections to which it is attached in normal conditions.
In another chapter, Intel has SPDK which re-imagines the I/O layer of the kernel and has a lot of cool features around locking, throughput and random I/O. We know the dual CPU platform can achieve 80 million I/Ops with SPDK and a large number of P5800X optane drives… but those aren’t the questions I have.
What questions can we answer about a Single/Dual Xeon 8380 based systems and how they perform with 1-4 P5800X optane?
In an ideal (read: not realistic) test we can get small 512b packets in and out of a P5800x at about 5 million IOPS. We know from our other testing real-world is about 2 million IOPS. Per drive. How well does that scale?
Things Got a little Crazy
This wouldn’t be a level1 diagnostic if everything worked as expected.
# fiotest.sh
fio --readonly --name=onessd \
    --filename=$2 \
    --filesize=100g --rw=randread --bs=$3 --direct=1 --overwrite=0 \
    --numjobs=$1 --iodepth=32 --time_based=1 --runtime=3600 \
    --ioengine=io_uring \
    --registerfiles --fixedbufs \
    --gtod_reduce=1 --group_reporting
8 jobs iodepth 32
fiotest: (groupid=0, jobs=8): err= 0: pid=25204: Wed Aug  4 13:26:05 2021
  read: >>> IOPS=3705k <<<, BW=1809MiB/s (1897MB/s)(30.9GiB/17486msec)
   bw (  MiB/s): min= 1188, max= 1932, per=99.98%, avg=1808.81, stdev=30.01, samples=272
   iops        : min=2434467, max=3957412, avg=3704438.32, stdev=61453.09, samples=272
  cpu          : usr=30.45%, sys=69.56%, ctx=104, majf=0, minf=60
  IO depths    : 1=0.1%, 2=0.1%, 4=0.1%, 8=0.1%, 16=0.1%, 32=100.0%, >=64=0.0%
     submit    : 0=0.0%, 4=100.0%, 8=0.0%, 16=0.0%, 32=0.0%, 64=0.0%, >=64=0.0%
     complete  : 0=0.0%, 4=100.0%, 8=0.0%, 16=0.0%, 32=0.1%, 64=0.0%, >=64=0.0%
     issued rwts: total=64789898,0,0,0 short=0,0,0,0 dropped=0,0,0,0
     latency   : target=0, window=0, percentile=100.00%, depth=32
… and with 10 jobs:
fiotest: (groupid=0, jobs=10): err= 0: pid=25319: Wed Aug  4 13:27:10 2021
  read: IOPS=4273k, BW=2086MiB/s (2188MB/s)(17.3GiB/8504msec)
   bw (  MiB/s): min= 1453, max= 2370, per=99.41%, avg=2074.11, stdev=40.27, samples=160
   iops        : min=2976136, max=4854050, avg=4247776.81, stdev=82470.30, samples=160
  cpu          : usr=31.49%, sys=68.52%, ctx=63, majf=0, minf=52
  IO depths    : 1=0.1%, 2=0.1%, 4=0.1%, 8=0.1%, 16=0.1%, 32=100.0%, >=64=0.0%
     submit    : 0=0.0%, 4=100.0%, 8=0.0%, 16=0.0%, 32=0.0%, 64=0.0%, >=64=0.0%
     complete  : 0=0.0%, 4=100.0%, 8=0.0%, 16=0.0%, 32=0.1%, 64=0.0%, >=64=0.0%
     issued rwts: total=36337834,0,0,0 short=0,0,0,0 dropped=0,0,0,0
     latency   : target=0, window=0, percentile=100.00%, depth=32
Kernel:
uname -a
Linux wGAMMA 5.11.0-20-generic #21+21.10.1-Ubuntu SMP Wed Jun 9 15:08:14 UTC 2021 x86_64 x86_64 x86_64 GNU/Linux
Ok, I’ve got 40 cores to work with. What if I run two tests in parallel?
# dstat -pcmrt
 20   0   0|  7  19  74   0   0|2636M  492G  117M 9029M|7700k    0 |04-08 13:31:58
 21   0   0|  7  19  75   0   0|2636M  492G  117M 9029M|7671k    0 |04-08 13:31:59
 20   0   0|  7  19  74   0   0|2635M  492G  117M 9029M|7485k    0 |04-08 13:32:00
 20   0   0|  7  19  74   0   0|2636M  492G  117M 9029M|7500k    0 |04-08 13:32:01
 20   0   0|  7  19  74   0   0|2636M  492G  117M 9029M|7490k    0 |04-08 13:32:02
 20   0   0|  6  19  74   0   0|2636M  492G  117M 9029M|7405k    0 |04-08 13:32:03
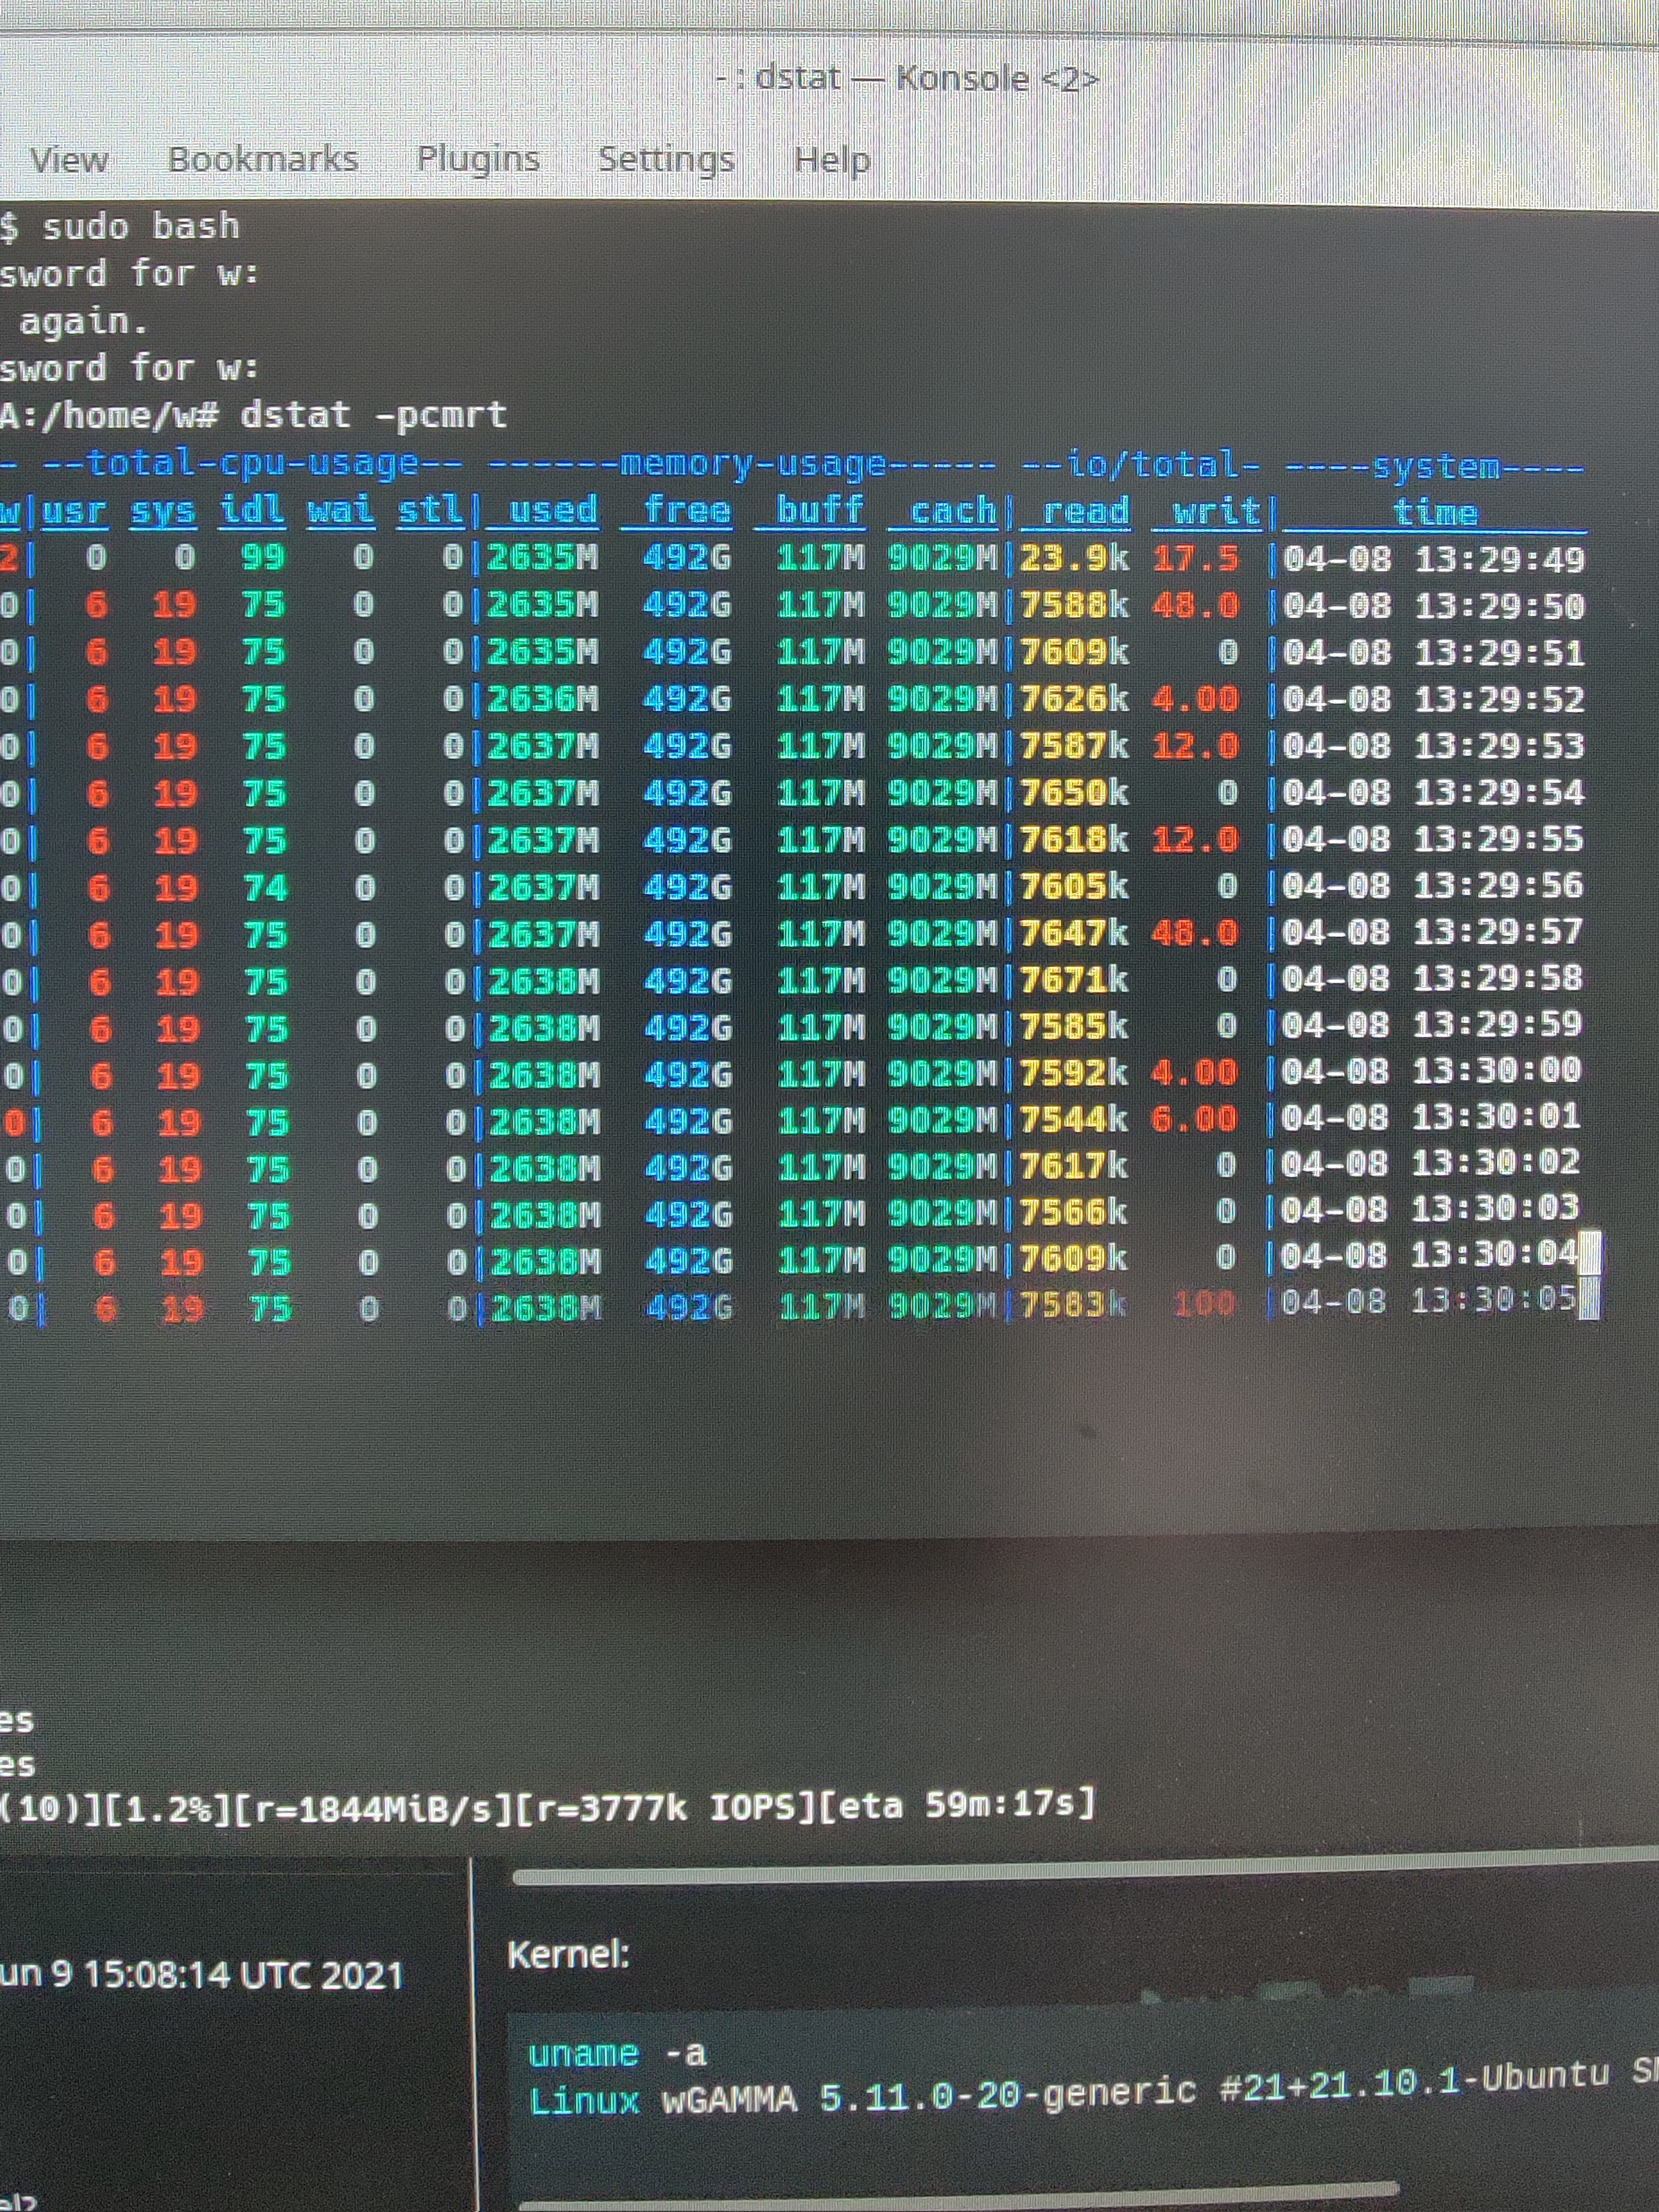
It’s not looking great. Let’s add 2 more into the mix! 40 processes total!
run blk new|usr sys idl wai stl| used  free  buff  cach| read  writ|     time
 61   0   0|  3  73  25   0   0|3676M  491G  117M 9045M|3171k    0 |04-08 13:32:50
 61   0   0|  3  73  25   0   0|3677M  491G  117M 9045M|3167k    0 |04-08 13:32:51
 61   0   0|  3  73  24   0   0|3677M  491G  117M 9044M|3143k    0 |04-08 13:32:52
 61   0   0|  3  73  25   0   0|3677M  491G  117M 9044M|3174k 4.00 |04-08 13:32:53
 61   0   0|  2  73  25   0   0|3677M  491G  117M 9044M|3170k    0 |04-08 13:32:54
 60   0   0|  2  73  25   0   0|3677M  491G  117M 9044M|3170k    0 |04-08 13:32:55
 76   0   0|  3  73  25   0   0|3676M  491G  117M 9044M|3169k    0 |04-08 13:32:56
 61   0   0|  2  73  25   0   0|3676M  491G  117M 9044M|3175k 4.00 |04-08 13:32:57
That’s a pretty hard regression. Maybe something to do with hybrid or polling I/O? I checked a lot of that:
Perf governor?
echo "performance" | tee /sys/devices/system/cpu/cpu*/cpufreq/scaling_governor
You are using poll queues right?
# cat /etc/modules/nvme.conf
options nvme poll_queues=16
…and confirmed:
cat /sys/block/nvme0n1/queue/io_poll
1
… and yet, the performance regresses pretty hard. I am still testing however. TODO finish this. Add Pics.
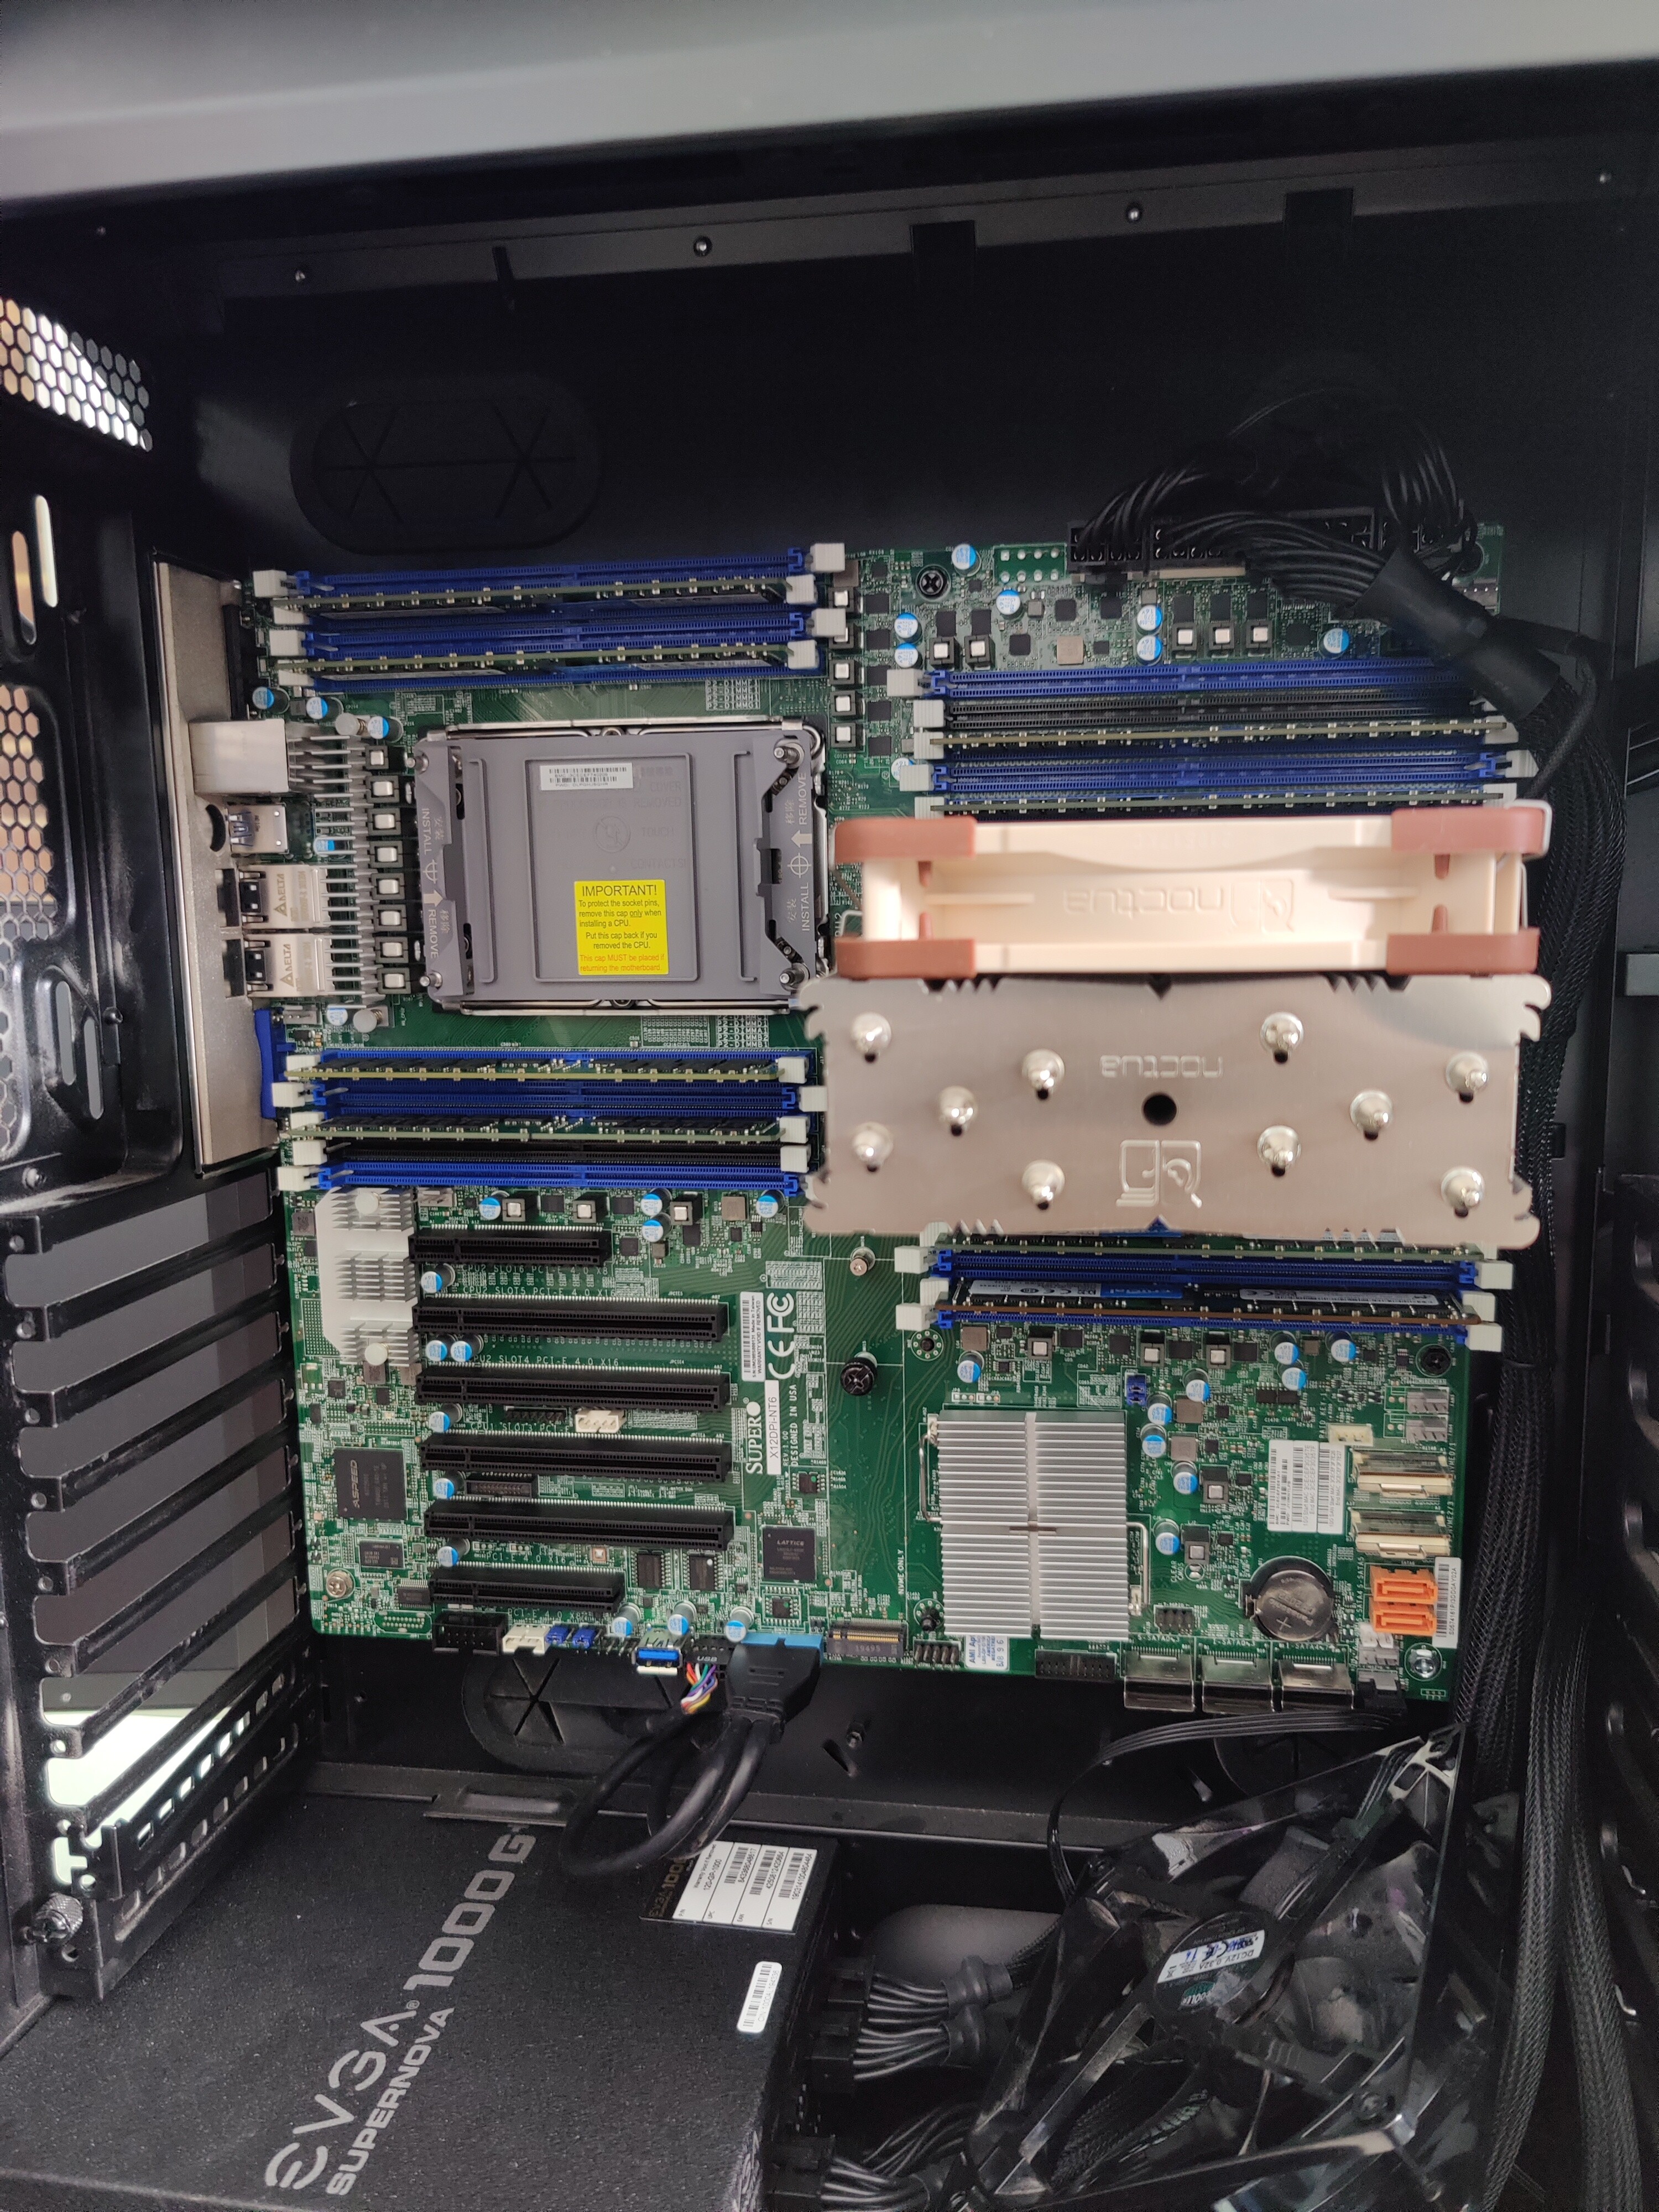
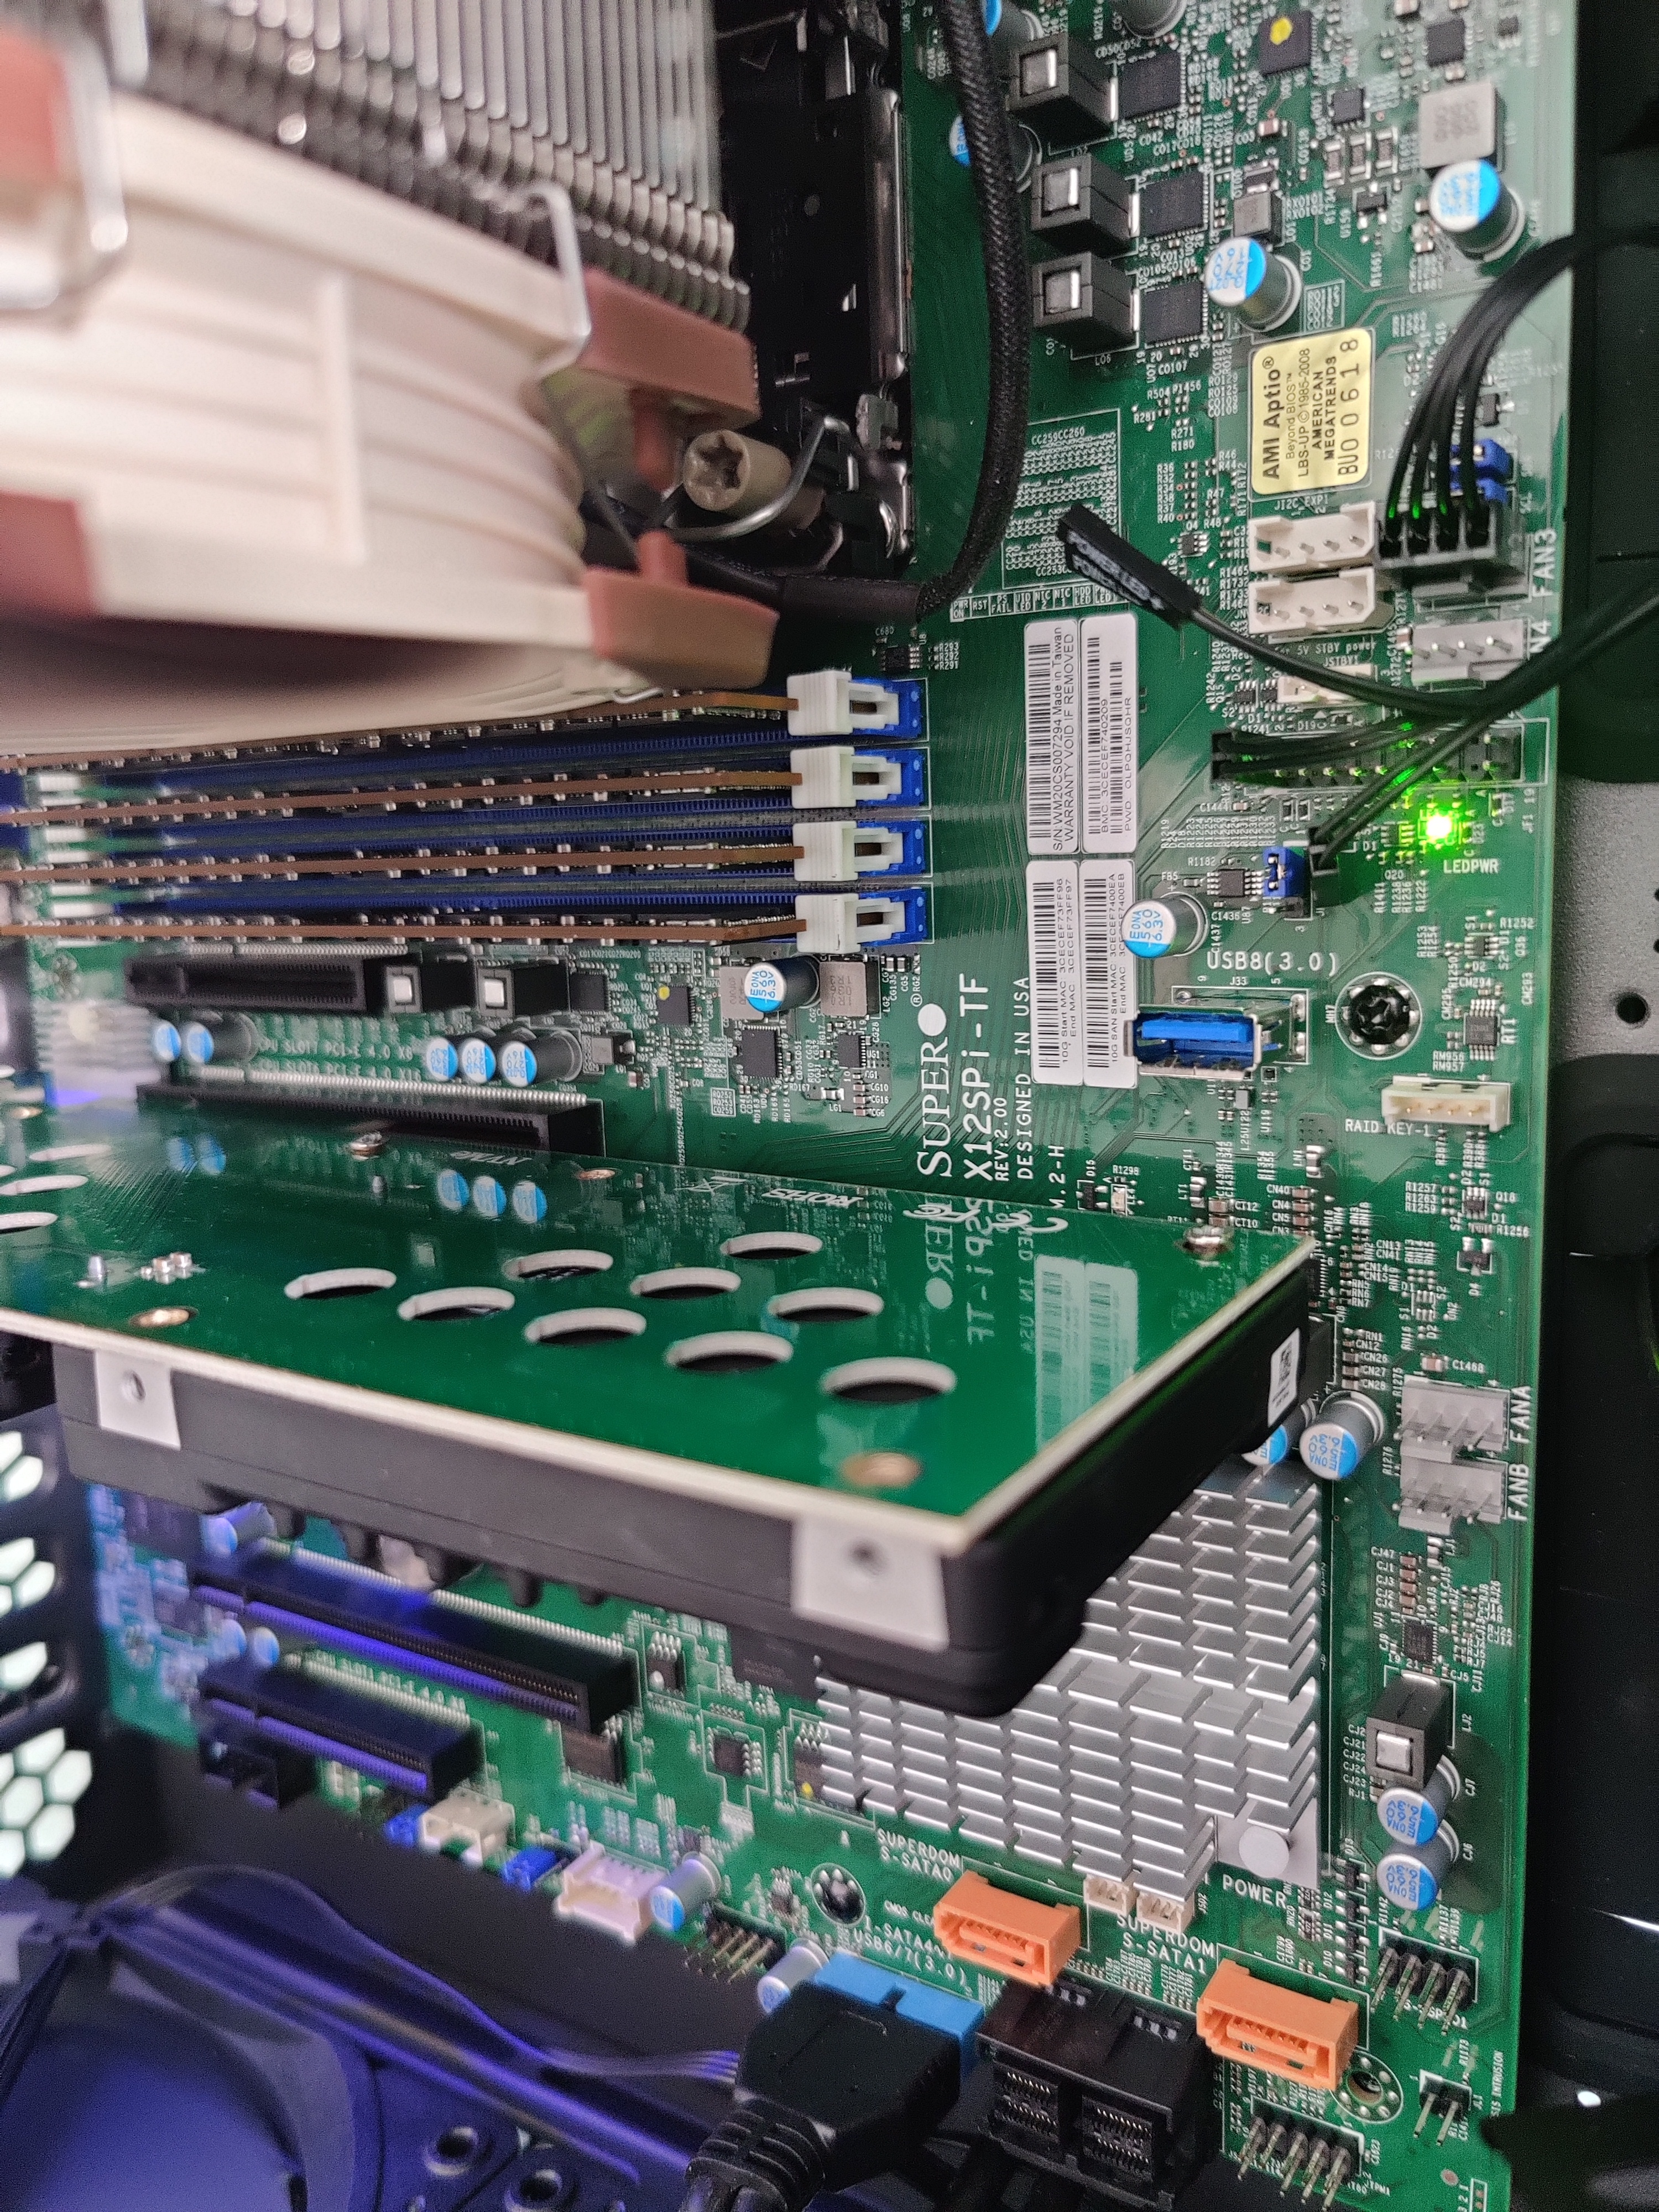
Our Test Systems
We have a mix of Samsung and Micron memory in 16,32 and 64gb RDIMM and LRDIMM capacities.
The U.2 to PCIe carriers are a mix of single and dual drives. (cat /proc/interrupts |grep -i nmi does show an awful lot of Non-maskable interrupts. but no PCIe errors… should I be worried about that?).
I have tried 4 and 8 dimms per socket.
The motherboards are the Supermicro X12DPI-NT6 (dual socket) and X12SPI-TF.
What now?
Well, I called Allyn… but… TODO
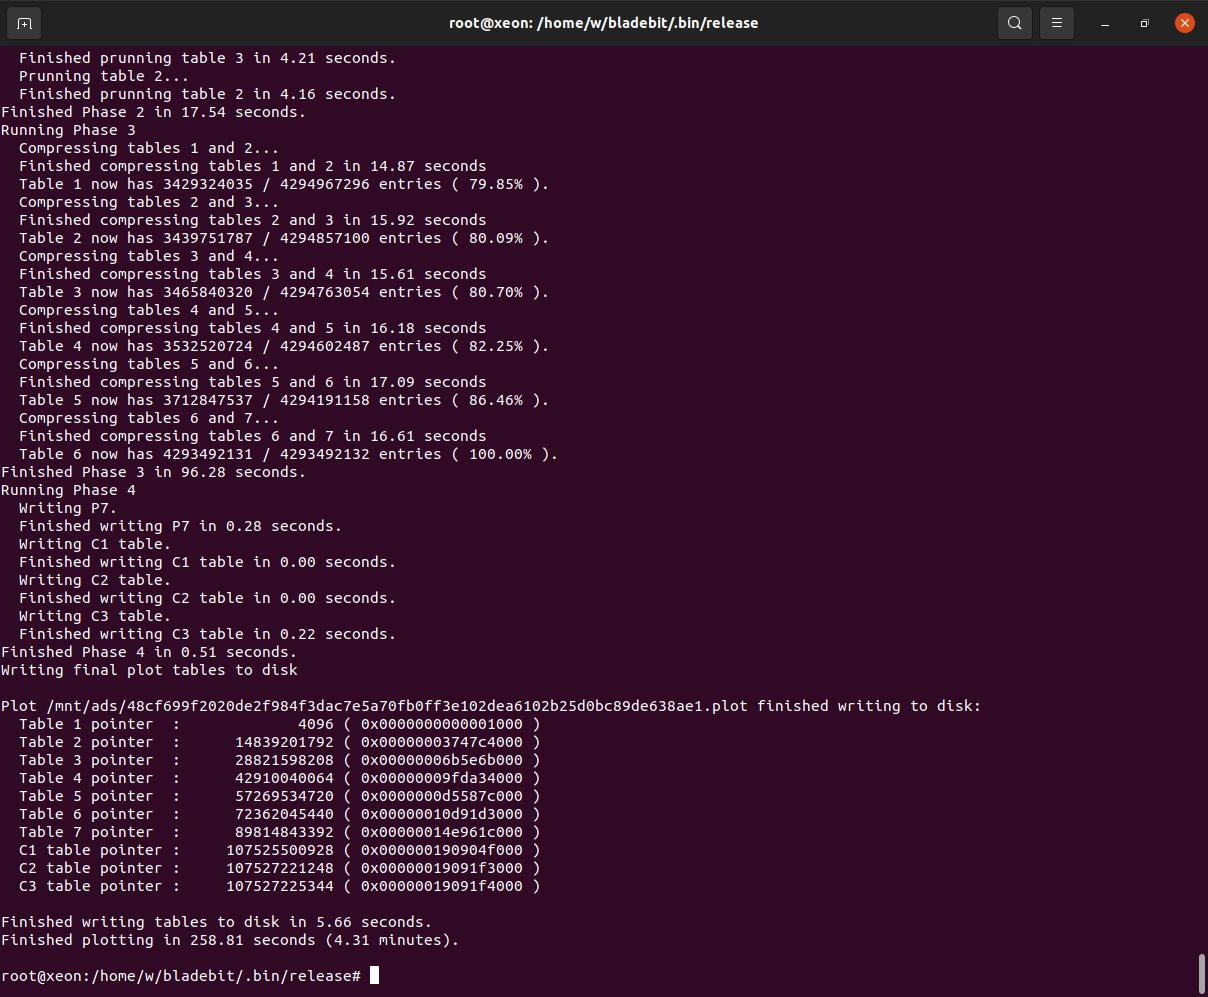
The Unrelated But Disturbing Kernel Panics, maybe related to md
So a couple of times testing the dual processor system I got hard lock/kernel panic. Magic SysReq didn’t even work and a time or two I had to reflash the bios via IPMI to get it to post again. I was unable to reliably get it to panic, but it seemed like it might be related to XFS on Linux MD. Eventually, after many hours, we found that a chia plotter… of all things… would almost always cause a panic. There is an issue being tracked for this on the kernel bug list. But why would that cause me to have to flash the bios to get POST again. (SEL full not handled well on these boards is my current best guess.)