Hello everybody. I am a cs student and for the past few years I have done all my C development in CodeBlocks, which is nice IDE imo. Tough from this year on my professors want me to start compiling and debugging C using text editors, gcc, gdb and other low level advanced tools, such as emacs.
I tried giving atom a shot since it looked quite promising but I just can’t find a good way to make it work as a debugger.
Can you guys present me with some options, i.e. your workflow, how you do it and so on?
I am on Fedora 28, if it can help in anyway, tough I suppose it won’t matter much.
I’m not a full-time C dev, but I do write a lot of C. My workflow just involves 3 terminal windows.
vim / compiler
gdb / chrome
3 Likes
On Linux:
I prefer to just use gdb and sometimes valgrind just in terminal.
But if you want more GUI approach, I recommend VS Code. It has very good (almost on par with Visual Studio IDE) front end for debugging and can use GDB/LLDB.
On Windows:
VS IDE. 
Oh and in general: lot’s of printf masked under LOG macros 
5 Likes
Code::Blocks and similar IDEs involve using break points and watching variables change as you step through the program.
Unfortunately, I don’t have time to give a decent tutorial about it right now. But maybe we can write a wiki on it tonight or something to show the basics in Code::Blocks, CLion, or another C/Java IDE. The advice above is solid, but pretty advanced (really, really great to learn in the long run, though). One of the negatives about learning on an IDE is you don’t realize how much work they do for you. The positives, of course, is you get straight to learning how to write code and build software.
More to come, pressed for time. Already wrote one wiki this morning  (Post pending).
If you find yourself with more time at your disposal I’d be glad to hear more from you
1 Like
7 Likes
I made a note to do a write up or video when I get off tonight.
@reikoshea LOL the granny method
1 Like
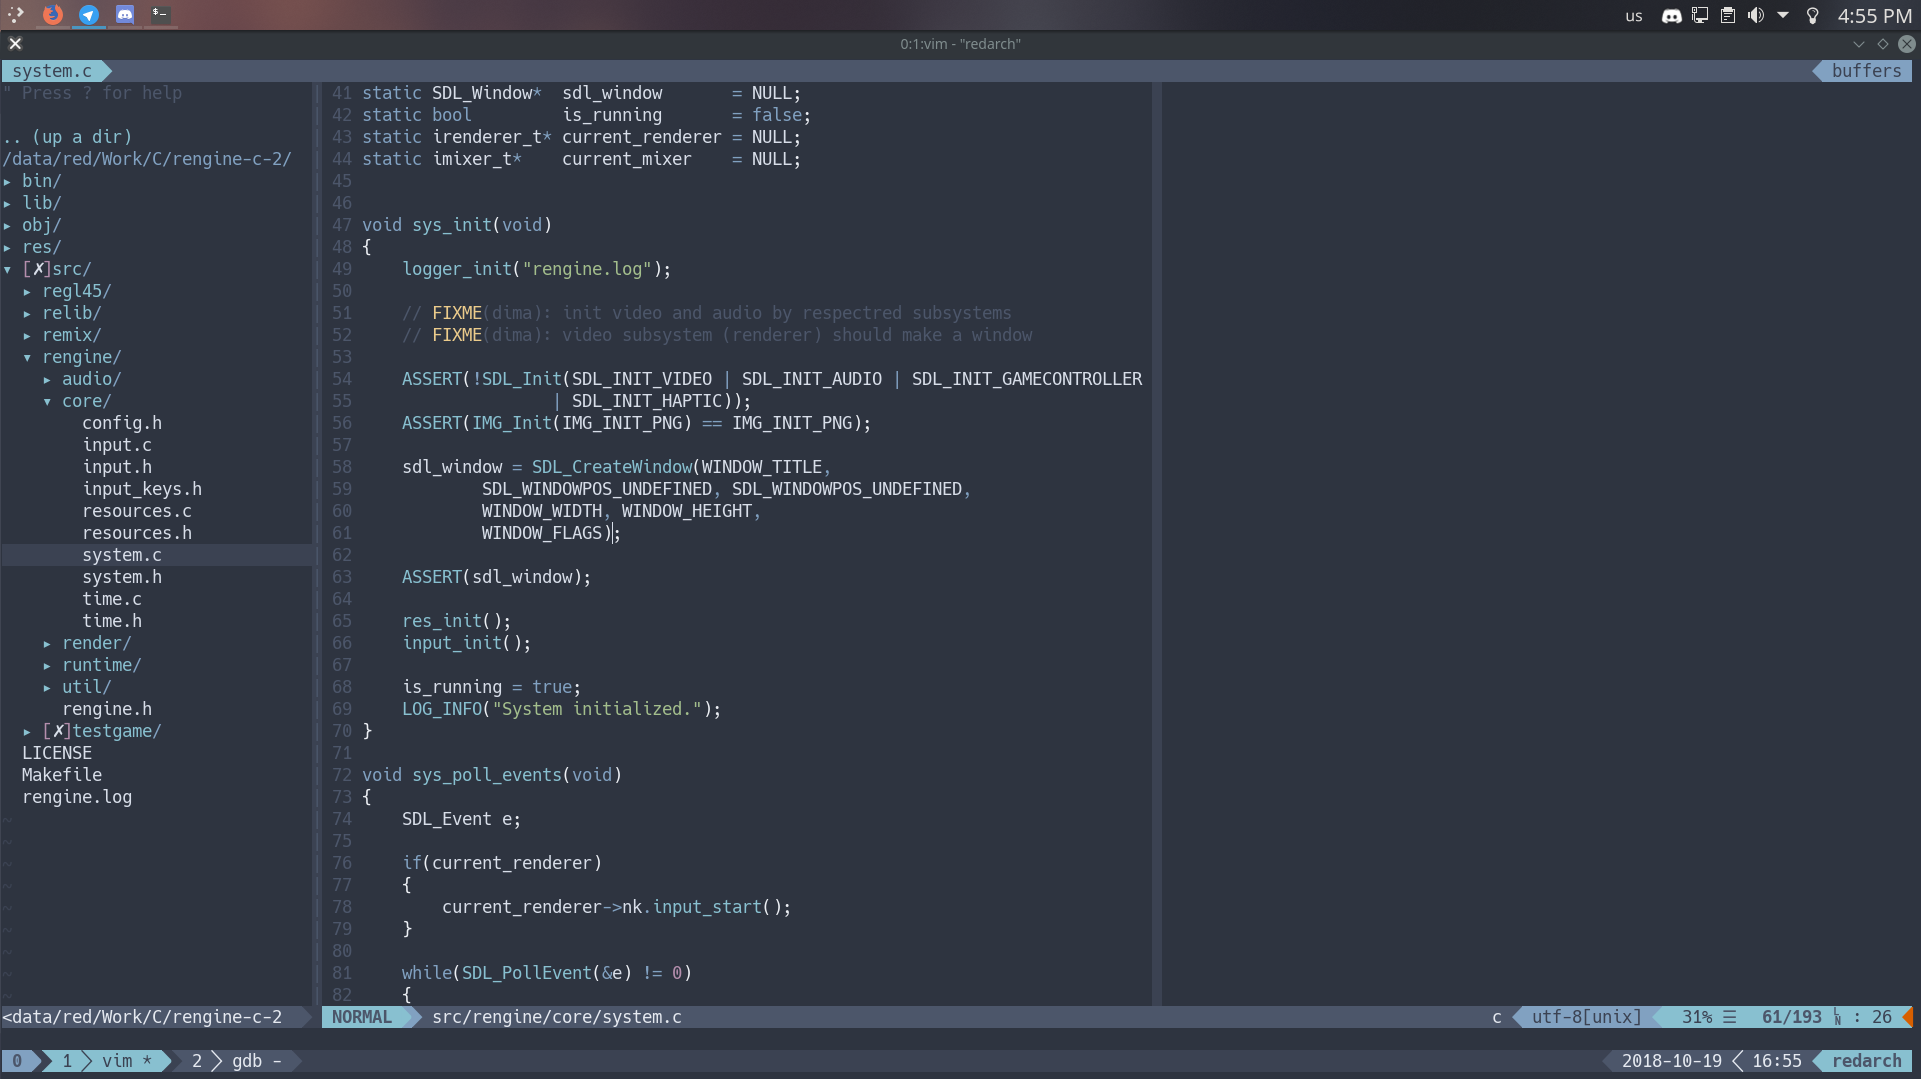
To elaborate a bit on gdb:
I primarily use TUI (Text UI) mode. What it does it basically transforms gdb from CLI app where you enter commands to, CLI app where you enter commands with nice ncurses UI

To enable it you can start gdb as usual and then write tui enable. Or start it as gdb -tui. I am sure you can read online how to use it more
It has a problem tho, when there’s lots of output from debugee it can fuck up the UI. So you need to force it to redraw with C-L (Control + L)
I also usually use tmux and live in single terminal when I code. Although if I am on i3 I don’t do that.
VS Code:
First you need to grab an extension for C/C++.
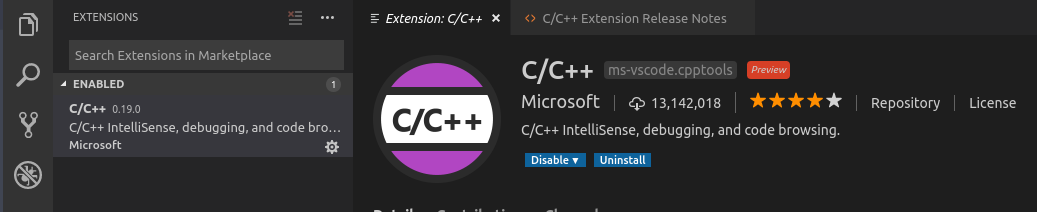
Then open the folder with the project and press debug (F5). It will make you a launch.json file. Add path to the executable to it.
It also want you to have xterm compatible terminal. Install that.
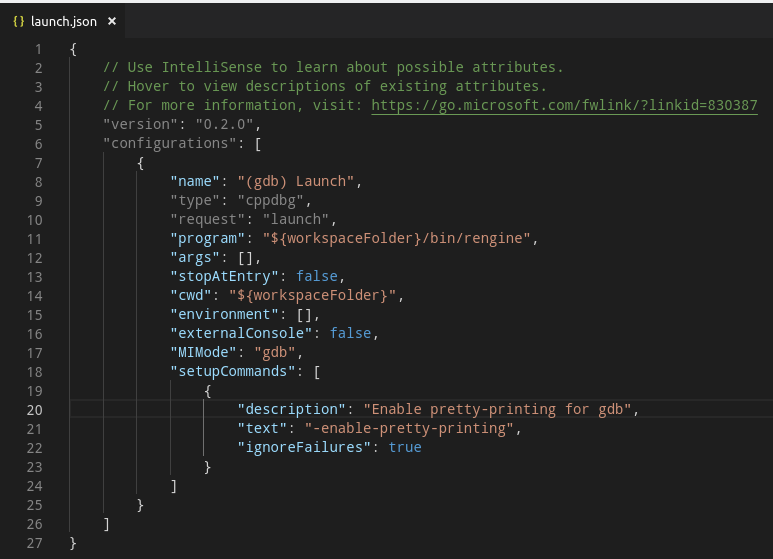
Start debug again.
Logging:
printfs are quite good actually, and don’t let people tell you otherwise. Sometimes it’s quicker to just print the state each iteration and notice the logical mistake than to fire up a debugger and go line by line or even instruction by instruction.
Hell I made a whole logging system that writes to file too:
4 Likes
Ehh, most of the stuff I do in C is HAProxy, Nginx, and Apache customization, all of which is heavily threaded. It’s a PITA to debug, and nearly every time it’s some race condition, so I did forget a step:
Constantly whispering FML to yourself…with occasional shouts to keep anyone in earshot on their toes.
1 Like
don’t you mean printf_s?
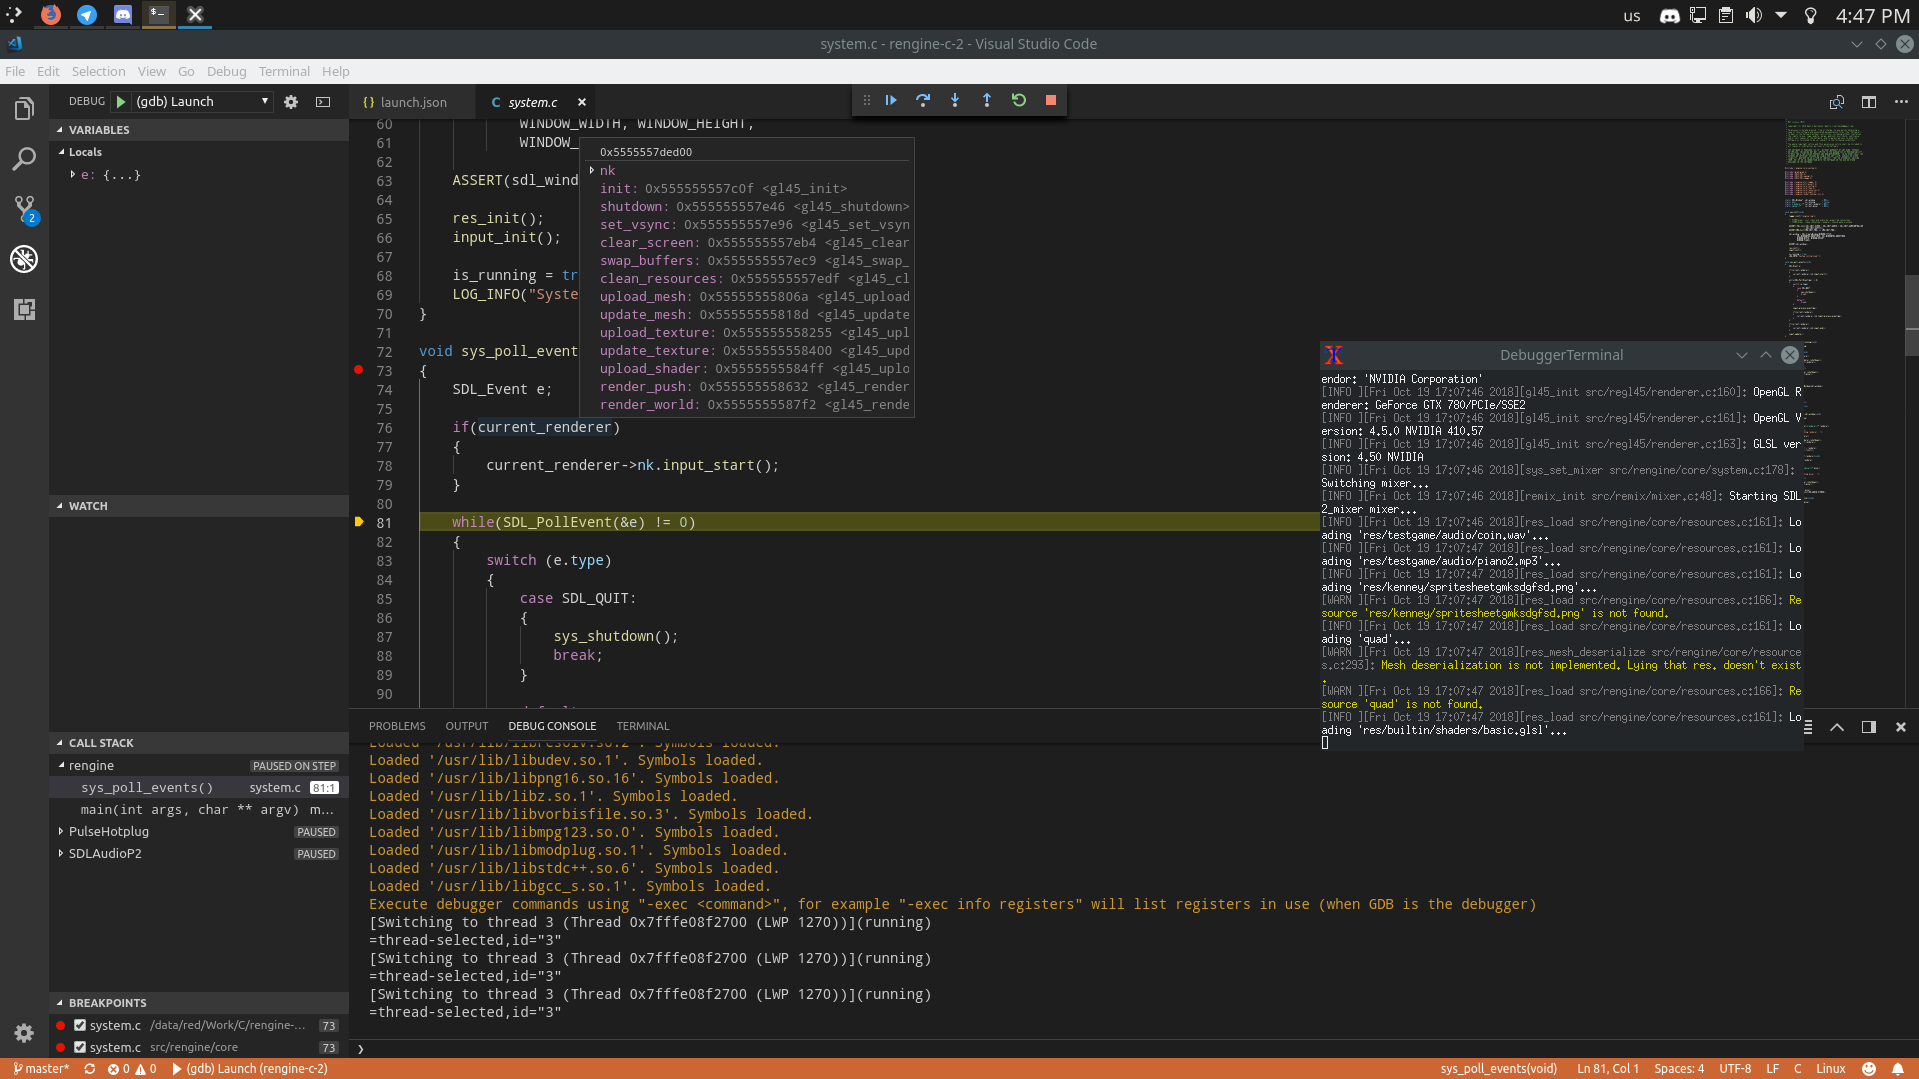
I really appreciated what you did. I usually find myself lost in reading the output of gdb, tough your first screenshot seems to facilitate the process quite a while
1 Like
Updated a bit about VS Code. The only thing I dislike about VS Code is that it’s electron app, even though I have 24 GBs of RAM lol. Also am too used to my vim set up by now.
So uninstalling it
It’s not bad though. I like it more than Atom. It’s super easy to install extensions and it seems to be working faster. At least it was last time I checked.
1 Like