Hi everyone, I’m a PhD virology student working in a structural biology lab at a well-funded public university in Montana, not too far from Rocky Mountain National Labs. I don’t study Coronavirus (although I’m very familiar with it), but rather an obscure virus known as Sulfolobus turreted icosahedral virus (STIV), that infects Archaea (single cellular organisms with similar morphology to bacteria). I also do a decent amount of molecular biology, and macromolecular structure work, including X-ray crystallography, and Cryo-Electron Microscopy. In this work, we use some ridiculously powerful computers, both on-site and remote, and most of our work is done in Linux as well.
Because of the huge influx of interest in Folding@Home, I thought I’d highlight how computers help us structural biologists figure out lots of different things. Why is it important that we know the structure of biological macromolecules?
-
Learning mechanisms. The biggest discovery of the 20th century is often argued to be the structure of DNA, because it allowed us to determine how genetic code was made. Virtually all biological and medical achievements since the discovery are reliant on DNA manipulation at some point. Knowing what DNA looks like, and how it’s held together made it possible to manipulate. The same goes for many proteins. Learning how they work can direct us into modifying them, or can shed light on entire metabolic pathways.
-
Drug design. Traditionally, drugs were primarily designed by screening (and to some extent, still are). Screening works by amassing huge libraries of synthetic and natural molecules, putting them in with the target protein, and seeing if it alters its activity in a way that makes sense. However, if we know the structure of our target, we can intelligently design drugs to interact specifically with that. This has the added effects of reducing side effects, preventing resistance, etc. To put this in light of viruses - Tamiflu (Oseltamivir) is a molecule that inhibits a Flu protein that is normally needed for the virus to finish its lifecycle. Specifically, it prevents the virus from cleaving sialic acid that is found on human membrane proteins, and the sialic acid cleavage is how the replicated virions exit the cell. Since tamiflu inhibits the viral protein that would cleave sialic acid, it can’t cleave it, and so it can never escape the cell. Since Coronavirus doesn’t cleave sialic acid to leave the cell (it has other ways), tamiflu does nothing for for Coronavirus infection.
OK, so where do computers fit into this? How do we go about seeing what viruses or proteins look like, in three dimensions?
The first way to look at things is with a microscope. You won’t see a virus with a normal light microscope (a microscope that takes visible light and refocuses it through a lens) because of something known as the “diffraction barrier”. Without getting into the physics, basically your wavelength of light needs to be 1/2 the size of what you are trying to resolve. This means that a light microscope will never be able to resolve something smaller than ~900 nm, if all goes well.
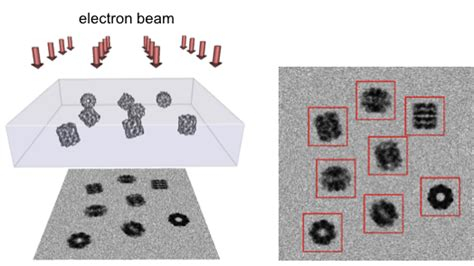
However, there are some tricks we can do to see things smaller than that. We have a couple different types of electron microscopes. Transmission electron microscopes (TEM) and negative staining use electrons, which have a wavelength in the picometer range, to see things at ~1-5 nm resolution. That’s ~60,000x maginification. However, the images are tough to distinguish features, and only tell us about basic morphology:
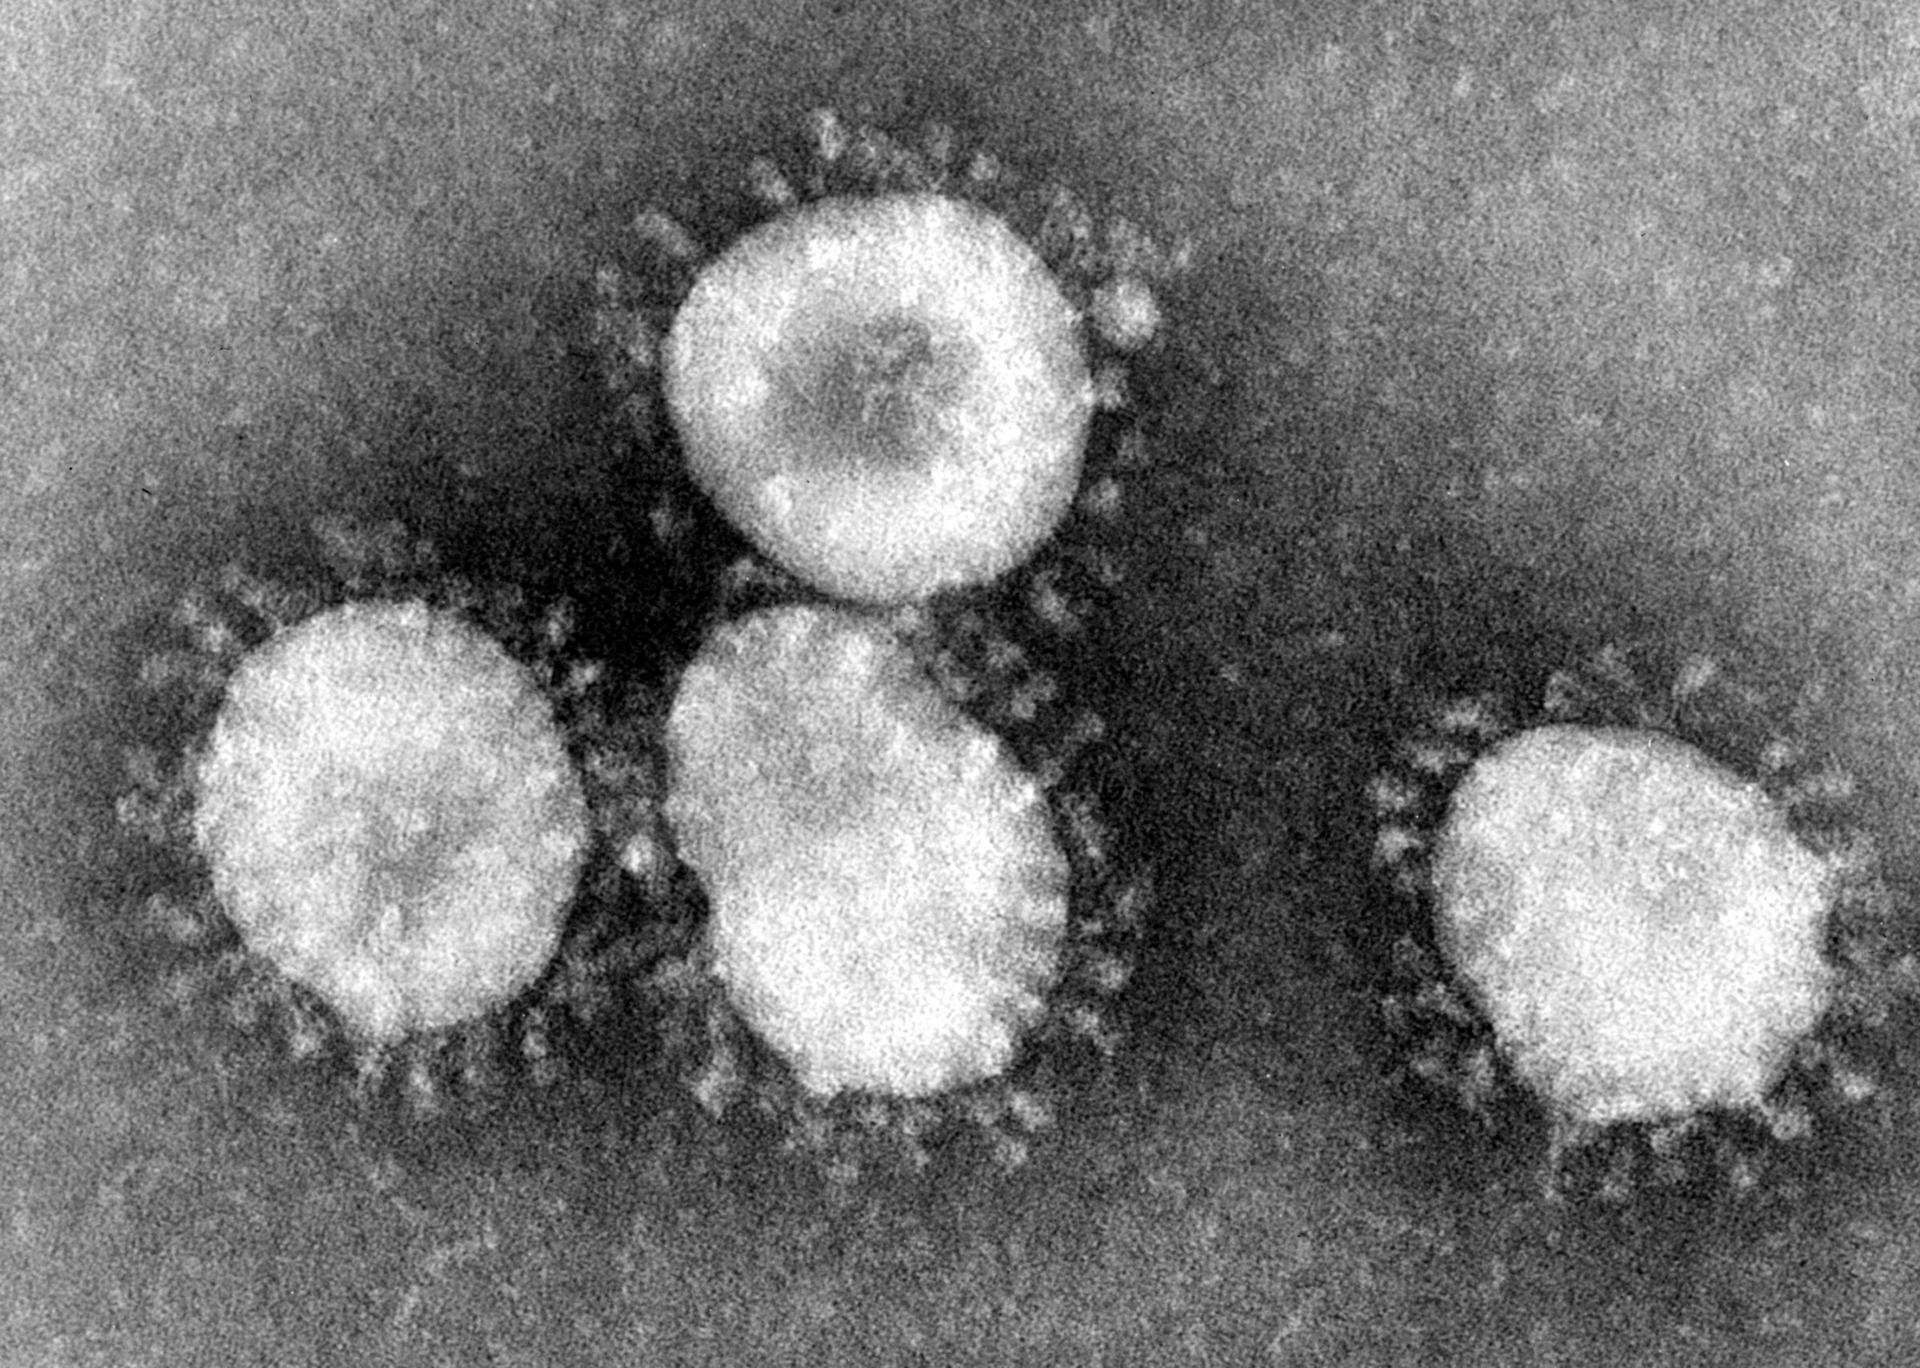
TEM’s work by accelerating electrons to extreme voltages (~-180 kV), focuses them with electromagnetic fields, and detecting electron density by staining with a heavy metal. The basic premise is that you coat your slide (or grid) with a heavy metal. If you have a particle there, it will not have the heavy metal stick to it, and so it won’t absorb electrons. If you don’t have a particle, it will absorb electrons. That’s why in the image above, the viruses are light, and the background is dark.
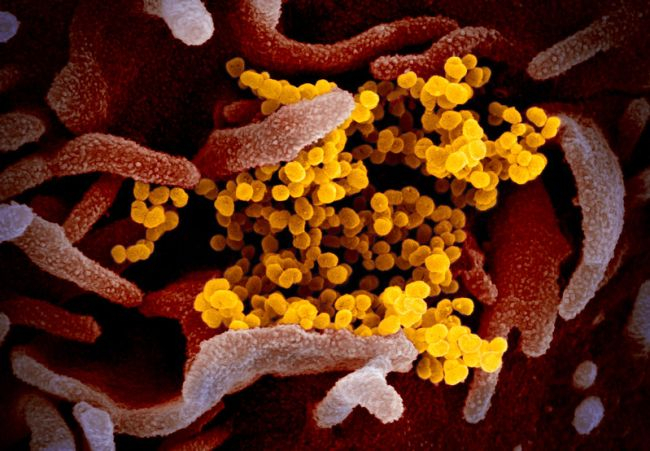
There’s also scanning electron microscopy (SEM). SEM is amazing, and works with similar principles, but only shows the top layer of whatever it is you’re looking at, instead of an average density. This creates ridiculously beautiful images with lots of depth, and lots of surface detail. The recently released images of Coronavirus 19 were taken by SEM at Rocky Mountain National Laboratory:
(https://www.livescience.com/new-coronavirus-images.html)
These images are also black and white, but also frequently given false coloration. The virus particles visible there are obviously smaller and slightly lower resolution than the TEM, but both types offer slightly different information, and are often used in tandem.
OK, so how does this tell us three-dimensional structural information about a virus? If you were to put virus on a slide, and shoot electrons at it, you’d see only a single projection of it. We need projections at a minimum of 360x360 degrees to get full resolution information.
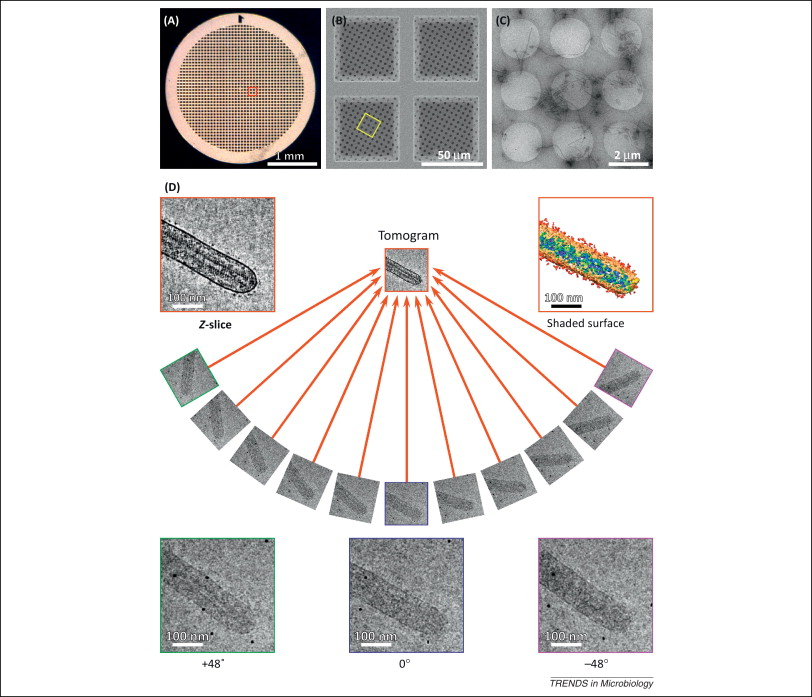
To accomplish this for something like viruses, we can use a fairly new technique, known as Cryo-Electron Microscopy (Cry-EM or Cryo-TEM). This involves accelerating electrons at -300kV into a sample that is frozen into vitreous ice. Again, the electron beam is focused and filtered with electromagnets, and the electron density is picked up by a CMOS detector. This gives is ridiculously high resolutions, on the order of 0.3 nm. However, getting to that resolution requires a lot of post-processing, and that’s where computers come in. We can then tilt the sample ~120 degrees, and image it from a multitude of angles. Then we can add those images back together in fourier space, and make a 3d model. Here is the basic workflow:
(https://www.cell.com/trends/microbiology/fulltext/S0966-842X(13)00153-4)
To do this, we commonly use a Linux software known as IMOD. I will spare everyone the technical details, but IMOD is quite intensive, and running it with certain filters and options on a large tomogram can take hours per iteration, on a run of the mill 6 core 12 thread workstation. GPUs can accelerate some parts of this now, and so its starting to pick up speed.
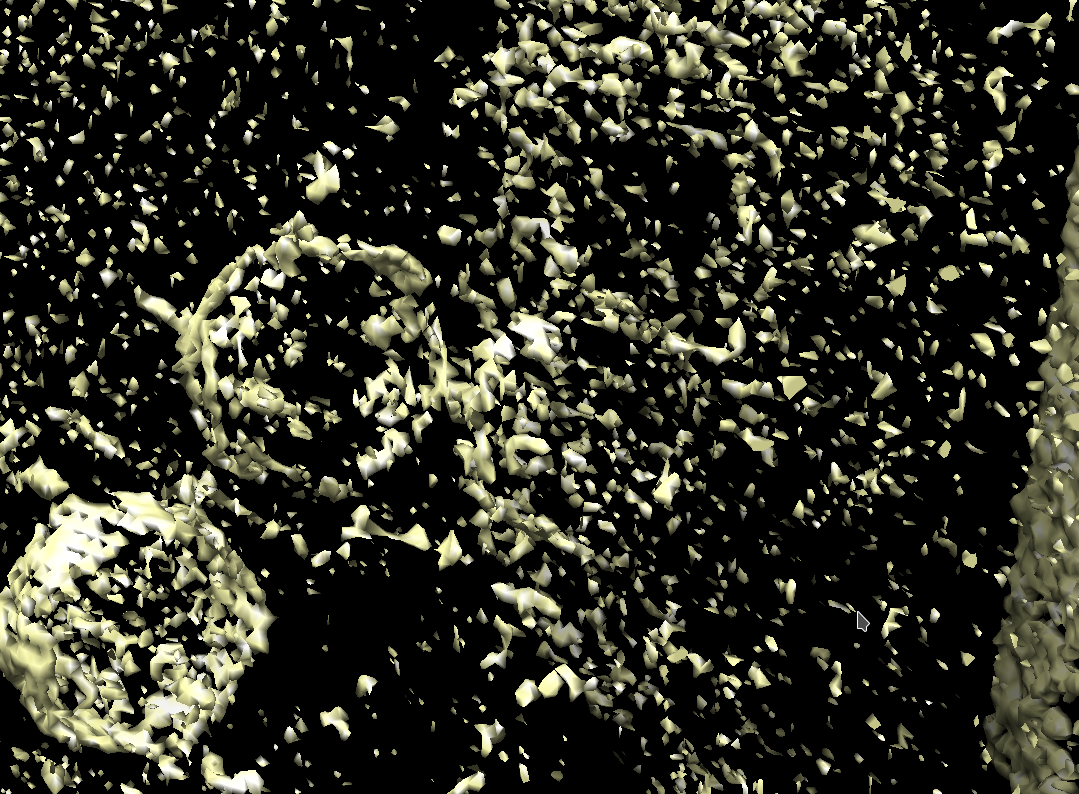
At the end, all of our 2D images are assembled into what’s known as a tomogram, which is volume 3D data. Here’s an image of a tomogram of the virus I study:

And here is an entirely 3d model:
At this point, a typical workflow would be to refine it over and over and over again, get more sample, average things together, do sub-tomogram average, and keep going until you end up with something like this:
(https://www.ebi.ac.uk/pdbe/entry/emdb/EMD-20477) (This image is the final model from the tomograms above).
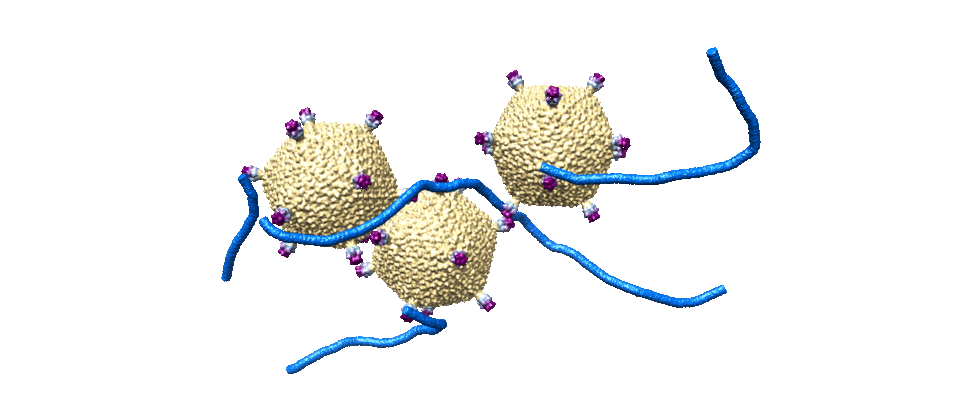
So that’s the tomographic way. However, it’s still relatively low resolution data, and so it needs to be supplemented. There’s two ways to get atomic resolution, currently. There’s X-ray diffraction, and there’s Cryo-Electron “Single Particle” microscopy. Single particle is very similar to tomography, but instead of looking at one sample at ±60 degrees, we instead freeze as much sample as possible and look at it from one angle. However, the idea is that if we have enough sample, we’ll see every possible distribution. Here’s an example of that workflow:
Once we have enough particles (literally billions, these datasets are often 5+ TB large) we can use software to go through, compare them in Faurier space, bin them, and reconstruct them ab initio. This is EXTREMELY intensive, often taking days for a single iteration. Then, once a crude model is built, human refinement can take weeks to months. The softare we use to do this is called Relion. The processing power it takes is insane, and puts any type of video production of effects to absolute shame. (@wendell, I’d LOVE to see you run the benchmark with your Epyc server). Here’s a hardware example of a Relion workstation:
http://www.cryoem.se/a-high-end-quad-gpu-workstation/
The fastest recorded times on the benchmarks page:
2:43 minutes for a 2x Titan Volta + 1950X, and 3:30 for an 8x GTX 1080 machine. And the benchmark is ideal data…
To move all these datasets around is another impressive task. We are currently planning a half-petabyte storage array in a 42U rack that’s running MooseFS, a distributed file system. I’m not a fan of MooseFS, but it’s what I was told to setup, and so it’s what we’re going with.
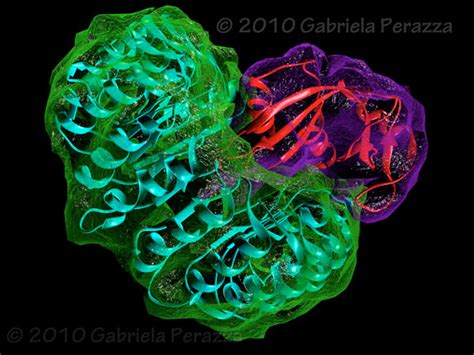
Single particle can get you down to 0.3-0.4 nm resolution. However, a bond is usually only truly detectable at <0.3 nm. We can tell something is there, but we can’t tell exactly what orientation, and exactly what it is. To answer that question, you can either get lucky with single particle, or you can use X-ray crystallography.
For X-ray crystallography, we take a whole bunch of a protein, and honestly, it’s basically a dark art form, but we screen it against ~1000+ diferent chemical conditions, and see if any of them cause it to crystallize. Then, if we get a crystal, we can shoot it with xrays to see how the xrays diffract. Unfortunately, a lens doesn’t exist that can focus xrays, and so we never get 3d data back. Instead, we get a diffraction pattern that tells us about the electron density of the protein. That’s where computers come in, as well as techniques like F@H. We can use either heavy metal doping, or known structures, to determine 3d electron density information from the diffraction pattern. This is a heavily computer-assisted technique, employing things such as simulated annealing, where we heat the protein up in a simulation, and see how it cools down (molecular dynamics), etc. Each round of refinement can take 10-30 minutes, and 500+ refintements aren’t uncommon. Overall, the process can take months, or even longer. The result, however, can be absolutely beautiful 3D structures:
This is way more words than I initially intended to write, but in my opinion, this is a huge limitation of technology, where we could be applying all of these riduculous computers we’ve been seeing so much about, but unfortunately, with most of the coverage being from gamers/video producers, we mostly just see it applied in those areas. So I thought with Coronavirus piquing everyone’s interest, I’d share some of how I use powerful machines in my research and day to day life.
I was interested in biology before I was interested in Linux, but I never considered how much the two areas would end up overlapping in my day to day. This forum has been a huge help, and has gotten me through many problems in the lab that I wouldn’t have otherwise been able to, and that others also couldn’t solve (cough nvidia stereo drivers on linux cough).
