I think it’s the inherited latency from the platform. If Threadripper 3000 is any indication, you need all the latency reduction for NVMe because the CPU is so taxed due to high latency. Same principal with DPC latency and DAWs. 2 monolithic dies, dual socket with some W-3175Xs would make a little more sense, with high mesh frequency.
The error correction on the SSDs is likely similar to what is used on magnetic disks, just modified to work better with the specifics of SSDs. This would be additional data stored that can be used to detect and correct the errors similar to, but lower level than what ZFS would do to detect and correct errors. Just some hash, or parity type of data stored on the drive in addition to the actual data. This would be independent of RAID or FS.
ZFS does add some overhead for the error checking, but it is also a lot more comprehensive than what the drive does. On flash it is mainly to catch degraded cells and move the data out of them to avoid data loss everytime a cell wears out while ZFS error checking is all about end to end data integrity.
It is possible that a “dumb firmware” could improve performance, but on SSDs you need something more aware of the layout and characteristics of the actual flash that is on the drive so you would have to add most if not all of that same code to the kernel or filesystem.
Edit:
You also likely don’t want to disable the error correction on the SSD as that is completely offloaded from the CPU and runs on the processor on the SSD. I think a more likely scenario would be to offload the error checking in ZFS to the SSD, not sure how viable that is though.
1 Like
with drives(nvme) so fast with ZFS… couldnt you just set primarycache and seconarycache parameters to metadata only?
Wouldnt that save some memory bandwidth? (what are your thoughts)
edit:
The reading of the issue tracker on suggests that using anything other than “all” will severely hurt performance.
i saw that episode on his channel earlier today and as much as the RGB stuff and whaterver new thing nvidia has is interesting but this stuff i think io enjoy much more…its nice that YOU do what you do as its so much easier for me to try something out in XYZ Linux in a VMon my 10-yr old HP workstation or on some old Dell Latitude whereas i cant just go out and buy a 2080 Ti and try out what he shows us…i mean its still GOOD what he doesm but i DO wish he did more of this type of thing …it would REALLY kickass if you guys did more collabs with patrick from STH as well, love that guy hes great…anyways thanks for the comprehensive write-up, keep on keepin on Mr. Dubya!
1 Like
yeah, that worked really well too, but still had the lost interrupts issue
What I thought weird about the Linus video is that he talks about using FreeNAS, but never follows up on it. Did you do any testing on it at all, or was the idea dropped because you found out, well, the above? (or because of other reasons, ofc, like it not suiting his needs)
Would be interesting to see the results of that since at least some of the issues here appear Linux-specific (eg. the SIMD removal)
Wendell, great writeup!
I’m running a TR 3960x with 4 x 1 TB gen 4 NVMe’s and am testing raid setups. As you noticed writing the raw interface speed is great:
root@3960x:~# fio fiotest.txt
random-read: (g=0): rw=randread, bs=(R) 128KiB-128KiB, (W) 128KiB-128KiB, (T) 128KiB-128KiB, ioengine=libaio, iodepth=128
fio-3.12
Starting 1 process
Jobs: 1 (f=4): [r(1)][100.0%][r=15.7GiB/s][r=129k IOPS][eta 00m:00s]
random-read: (groupid=0, jobs=1): err= 0: pid=106324: Sun Feb  9 20:04:14 2020
  read: IOPS=118k, BW=14.4GiB/s (15.4GB/s)(863GiB/60003msec)
slat (nsec): min=2080, max=80847, avg=2888.18, stdev=867.04
clat (usec): min=33, max=26691, avg=1083.16, stdev=1200.87
 lat (usec): min=36, max=26695, avg=1086.09, stdev=1200.86
clat percentiles (usec):
 |  1.00th=[  285],  5.00th=[  412], 10.00th=[  453], 20.00th=[  537],
 | 30.00th=[  635], 40.00th=[  734], 50.00th=[  840], 60.00th=[  963],
 | 70.00th=[ 1123], 80.00th=[ 1352], 90.00th=[ 1762], 95.00th=[ 2245],
 | 99.00th=[ 5211], 99.50th=[ 8979], 99.90th=[17695], 99.95th=[19268],
 | 99.99th=[21627]
   bw (  MiB/s): min= 5601, max=16249, per=99.99%, avg=14725.90, stdev=3055.10, samples=120
   iops        : min=44812, max=129994, avg=117807.20, stdev=24440.78, samples=120
  lat (usec)   : 50=0.01%, 100=0.06%, 250=0.66%, 500=14.94%, 750=26.08%
  lat (usec)   : 1000=20.70%
  lat (msec)   : 2=30.71%, 4=5.42%, 10=1.01%, 20=0.39%, 50=0.03%
  cpu          : usr=10.26%, sys=39.59%, ctx=2814273, majf=0, minf=4105
  IO depths    : 1=0.1%, 2=0.1%, 4=0.1%, 8=0.1%, 16=0.1%, 32=0.1%, >=64=100.0%
 submit    : 0=0.0%, 4=100.0%, 8=0.0%, 16=0.0%, 32=0.0%, 64=0.0%, >=64=0.0%
 complete  : 0=0.0%, 4=100.0%, 8=0.0%, 16=0.0%, 32=0.0%, 64=0.0%, >=64=0.1%
 issued rwts: total=7069271,0,0,0 short=0,0,0,0 dropped=0,0,0,0
 latency   : target=0, window=0, percentile=100.00%, depth=128

Run status group 0 (all jobs):
   READ: bw=14.4GiB/s (15.4GB/s), 14.4GiB/s-14.4GiB/s (15.4GB/s-15.4GB/s), io=863GiB (927GB), run=60003-60003msec
where fiotest.txt is copied from your example above:
root@3960x:~# cat fiotest.txt
[global]
bs=128k
iodepth=128
direct=1
ioengine=libaio
randrepeat=0
group_reporting
time_based
runtime=60
filesize=6G
numjobs=1

[job1]
rw=randread
name=random-read
#filename=/tank1/test.txt
filename=/dev/disk/by-id/nvme-Sabrent_Rocket_4.0_1TB_redacted:/dev/disk/by-id/nvme-Sabrent_Rocket_4.0_1TB_redacted:/dev/disk/by-id/nvme-Sabrent_Rocket_4.0_1TB_redacted:/dev/disk/by-id/nvme-Sabrent_Rocket_4.0_1TB_redacted
When running this on a stripped zfs volume:
zpool create tank1 /dev/disk/by-id/nvme-Sabrent_Rocket_4.0_1TB_xx0 /dev/disk/by-id/nvme-Sabrent_Rocket_4.0_1TB_xx1 /dev/disk/by-id/nvme-Sabrent_Rocket_4.0_1TB_xx2 /dev/disk/by-id/nvme-Sabrent_Rocket_4.0_1TB_xx3
I get the following results:
root@3960x:~# fio fiotest.txt
random-read: (g=0): rw=randread, bs=(R) 128KiB-128KiB, (W) 128KiB-128KiB, (T) 128KiB-128KiB, ioengine=libaio, iodepth=128
fio-3.12
Starting 1 process
Jobs: 1 (f=1): [r(1)][100.0%][r=5302MiB/s][r=42.4k IOPS][eta 00m:00s]
random-read: (groupid=0, jobs=1): err= 0: pid=110170: Sun Feb  9 20:10:43 2020
  read: IOPS=41.7k, BW=5207MiB/s (5460MB/s)(305GiB/60001msec)
slat (usec): min=10, max=112, avg=23.27, stdev= 5.29
clat (nsec): min=1910, max=4521.4k, avg=3049079.32, stdev=350086.73
 lat (usec): min=26, max=4596, avg=3072.43, stdev=352.77
clat percentiles (usec):
 |  1.00th=[ 2409],  5.00th=[ 2507], 10.00th=[ 2573], 20.00th=[ 2671],
 | 30.00th=[ 2769], 40.00th=[ 2900], 50.00th=[ 3097], 60.00th=[ 3294],
 | 70.00th=[ 3392], 80.00th=[ 3392], 90.00th=[ 3425], 95.00th=[ 3425],
 | 99.00th=[ 3654], 99.50th=[ 3687], 99.90th=[ 3687], 99.95th=[ 3720],
 | 99.99th=[ 3752]
   bw (  MiB/s): min= 4631, max= 5842, per=100.00%, avg=5209.28, stdev=387.09, samples=119
   iops        : min=37050, max=46738, avg=41674.20, stdev=3096.71, samples=119
  lat (usec)   : 2=0.01%, 50=0.01%, 100=0.01%, 250=0.01%, 500=0.01%
  lat (usec)   : 750=0.01%, 1000=0.01%
  lat (msec)   : 2=0.01%, 4=100.00%, 10=0.01%
  cpu          : usr=3.21%, sys=96.78%, ctx=121, majf=0, minf=4105
  IO depths    : 1=0.1%, 2=0.1%, 4=0.1%, 8=0.1%, 16=0.1%, 32=0.1%, >=64=100.0%
 submit    : 0=0.0%, 4=100.0%, 8=0.0%, 16=0.0%, 32=0.0%, 64=0.0%, >=64=0.0%
 complete  : 0=0.0%, 4=100.0%, 8=0.0%, 16=0.0%, 32=0.0%, 64=0.0%, >=64=0.1%
 issued rwts: total=2499238,0,0,0 short=0,0,0,0 dropped=0,0,0,0
 latency   : target=0, window=0, percentile=100.00%, depth=128

Run status group 0 (all jobs):
   READ: bw=5207MiB/s (5460MB/s), 5207MiB/s-5207MiB/s (5460MB/s-5460MB/s), io=305GiB (328GB), run=60001-60001msec
I’ve tried adding polling, disabling arc compression, rcu_nocbs etc but haven’t seen much improvement.
root@3960x:~# cat /etc/kernel/cmdline
root=ZFS=rpool/ROOT/pve-1 boot=zfs mce=off iommu=pt avic=1 pcie_aspm=off rcu_nocbs=0-47 pci=noaer nvme_core.io_timeout=2 nvme.poll_queues=48 max_host_mem_size_mb=512 nvme.io_poll=1 nvme.io_poll_delay=1
I didn’t have the timeout issues you’re seeing with Epyc, perhaps rcu_nocbs doesn’t do much here for me…
Is this the best we can do on ZFS NVMe raid right now? In your final config on the Epyc setup what are your fio results for the md setup as well as best zfs setup?
Very much appreciate this forum and enjoy the youtube videos, keep up the great work!
I see in the turntables that there are multiple md* arrays. Is there a way to mount multiple md* raid 5/6 arrays to one directory?
interesting stuff, did you test any other nvmes brand?
iam having some issues with micron ones that seems to cause straight up crashes, also on a gigabyte board. will test without MSI and some of your other tweaks!
did you experiment at all with numa balancing off? this is a bit out of my wheelhouse but some of the epyc performance documents mentioned it.
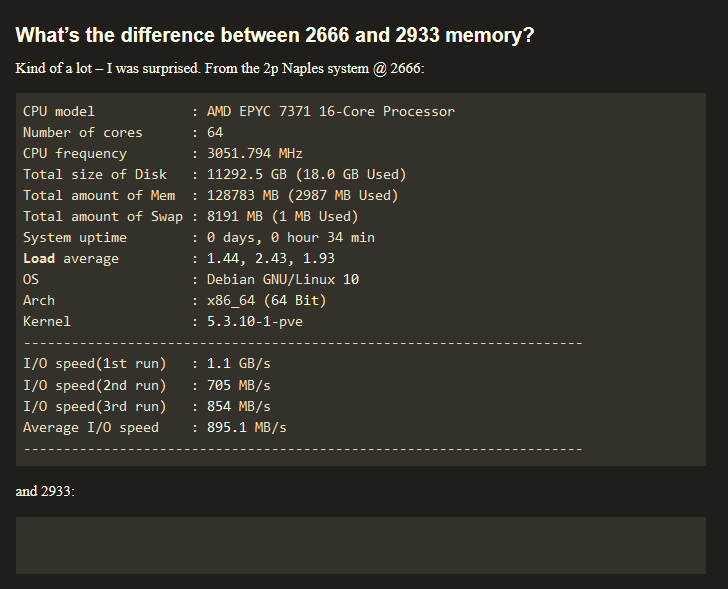
theres also the question of running 3200 or 2933 on ram to match infinity fabric for lower latency(your 2933mhz bench results is empty btw), but theres so many things to benchmark its hard to test all the different options against eachother.
The things you mention fix performance rather than straight up crashing. What’s the output of dmesg for the crashes?
How the hell did I miss this thread?
Edit Nvm, missed the 2021 update in the comment where Wendell goes over this
Note that the zfs_vdev_scheduler parameter is now obsolete and not used anymore, as it was sometimes flat out ignored in various systems anyways. Setting up a UDEV rule is now the recommended way to change schedulers around. The ZFS devs also seem to think that currently all default schedulers should work decently for common use cases and shouldn’t be changed without verifying that one is better for a use case.
https://github.com/openzfs/zfs/issues/9778
https://github.com/openzfs/zfs/pull/9609
Relevent bits:
set options zfs zfs_vdev_scheduler=none in /etc/modprobe.d/zfs.conf
reboot
check arc_summary or cat /sys/module/zfs/parameters/zfs_vdev_scheduler it will show “none”
finally check scheduler for zfs disks:
cat /sys/block/ DEVICE /queue/scheduler
it’ll show “mq-deadline”, but should be “none”
I’ve temporary made workaround via udev rule:
ACTION==“add|change”, KERNEL==“sd[a-z]”, ATTR{queue/scheduler}=“none”

I know it was just a snippet of the quoted GitHub, but does this address NVMe drives as well as sata?
Or better to just make sure zfs tools are at version 0.8+? Rather than temporarily setting”nvmep[0-9]” or what ever would be the syntax?
That’s a good point, it definitely won’t touch nvme1n1 and the like, and would need to be modified as you say.
As far as whether using it or not is good, I don’t know. My intention was just to point it out so people like me who sometime poke and test things, but don’t have good offhand or deep linux knowledge can use it as a reference to jump off and do further research.
And by zfs tools are at version 0.8+ are you refering to the “sorta kinda” direct IO added in ZFS version .8? If so there are still ongoing issues with them. My rough, surface level understanding is the real direct IO is here https://github.com/openzfs/zfs/pull/10018 and is yet to be merged.
Edit
And looking further, it looks like Wendell did exactly that in his script at the end, but shouldn’t be needed anymore because it’s default.
On Proxmox 6.3 as default I get
root@kobold:~# cat /sys/block/nvme4n1/queue/scheduler
[none] mq-deadline
1 Like
Thanks.
The 0.8+ was a reference to the closure on the bug with the note ‘moved from “to do” to “done” in 0.8-release’ and presuming newer versions would default to the “none” in Wendells script, from previous default of “noop “ or whatever? Was just an observation, I don’t have ballin’ NVMe drives to raid
could these settings be run on a single device for easier a/b testing or is it system wide only?
Anyone knowledgeable interested in helping with debugging NVME performance issues? Basically even RAID1 is slower than a single Kioxia SSD. More details in the thread below. Sorry for necro, but got to bring some attention in, somehow.
I’m planning for a NVMe ZFS server with a single socket EPYC Milan 7443, wondering has the situation being improved over the years?
Does the slow performance issue only related to EPYC CPUs, has anyone having good results with Xeon? Knowing that Milan L3 cache hit in remote die is ~110ns while Xeon 3rd is ~22ns.
CPU L3 cache performance should be largely irrelevant comparing storage performance due to significantly larger data volumes compared to L3 cache size.