At the simplest level, even just leaving a script running a datestamp and say 5 pings (then time/datestamp) logging to a text file would be a start. Do this a few times at various points in the network (i.e., plugged directly into router, plugged into powerline adapter and then on wifi or whatever to get a few failures).
Wireshark is useful for debugging issues but i suspect not in this case; wireshark will tell you what traffic is running over a link, but your issue here is that NO traffic is running over the link and it looks like it is because the link layer is going down somewhere.
A wireshark dump certainly won’t hurt, but the issue is that you’re probably wanting to grab the frames from just before the issue occurs, and if you don’t know when it will occur, leaving wireshark running for long periods of time will result in absolutely MASSIVE traffic captures.
You can set up filters in wireshark to only capture certain frames, etc. but if you don’t know what you’re looking for you won’t know what to filter.
I’d try and identify a pattern as to WHEN the issue occurs first (log with ping) at various points in the network and then once you’re reasonably confident you know which segment is broken try and get a wireshark capure set up just before you expect it to happen, at the segment you expect it to occur on.
Wireshark won’t help you with interference necessarily but if there’s some protocol error or framing error you might see it. But it won’t tell you WHY that is happening - and you already know the link is dropping…
At the end of the day though i suspect it is a case of identify segment serviced by broken hardware X and then junk that hardware.
OR
Identify source of interference and isolate that somehow.
Finally got around to working on this problem again; sorry for the delay.
pinger script
 #!/bin/bash

SERVERS="192.168.2.1 192.168.2.2 192.168.2.8"
OUTPUT_FILE=pinger.log
LFLAG=false

show_help()
{
  echo "
***************************************************************************
pinger usage:
-l [LOCATION]                   LOCATION string to print in log header
***************************************************************************
"
}

convert_datetime()
{
  sed -i 's/^\[\([0-9]*\.[0-9]*\)\]\(.*\)/ \
    echo "[$(date -d @\1 +"%Y-%m-%d %H:%M:%S")] \2"/e' $OUTPUT_FILE
}

while getopts "h?l:" opt; do
    case "$opt" in
    h|\?)
	show_help
        exit 0
	;;
    l)
      	LOCATION=$OPTARG
        LFLAG=true
        ;;
    esac
done

shift $((OPTIND-1))

if ! $LFLAG
then
        echo "Error: -l option must be included."
        show_help
        exit 1
fi

trap convert_datetime SIGHUP SIGINT SIGQUIT SIGABRT SIGTERM

echo "
***************************************************************************
Date: $(date)
Location: $LOCATION
***************************************************************************
" >> $OUTPUT_FILE

fping -Dul --period=5000 $SERVERS 2>&1 | tee -a -i $OUTPUT_FILE
Here’s a script that pings the router, AP, and my machine every 5 seconds with fping, printing the UNIX datestamp, and appending to a log file. When interrupted and before exiting, the script converts the UNIX time to a regular human-readable format. I would have liked to do that on the fly, but such attempts behaved strangely.
I’ve deployed this on a netbook wired to the AP for now. I can also put it at the router later, but I already have the VOIP ATA there which didn’t lose internet during issues.
Are we sure of this? How can we check that in fact no traffic is working?
Also, I was wondering if the issue might be due to powersavings on the wireless adapter (RTL8822BE), so for now I’ve turned off power management with wifi.powersave = 2 in a file at /etc/NetworkManager/conf.d/ and have restarted NetworkManager.
I got “lucky” with another network interruption on my machine soon after deploying the ping script on a netbook wired to the AP.
script pinging my machine failed with “ICMP Host Unreachable from [NETBOOK IP] for ICMP Echo sent to [MY MACHINE’S IP]”
script pinging AP and router (over powerline) did not fail
interruption lasted ~50 minutes
interruption ended without my intervention within seconds of the following log entry on the AP: "daemon.info hostapd: ath0: STA [MAC ADDRESS] WPA: group key handshake completed (RSN) "
my machine’s uptime was not interrupted on the AP’s wireless client list
What conclusions can be drawn from this?
A few other observations from the AP’s logs in case they’re relevant:
There are entries for "pairwise key handshake completed (RSN) " from various devices, aside from “group key handshake completed (RSN)”. Is that normal?
There are entries for “RADIUS: starting accounting session xxxxxxxxxxxxxxxx”. I didn’t set up a RADIUS server, not entirely sure what it is, or whether it’s relevant to my setup. Are those entries normal?
From searching, this github issue seems similar, though it’s for OpenWRT/LEDE and a different chipset. Unfortunately no solution.
Perhaps I will update ddwrt on the AP in case that helps. It’s currently on v3.0-r33555 std (10/20/17).
Similar to the above points, the pings to my machine failed ~2-3 minutes after a group key handshake. I don’t know if that’s just coincidence though.
This time I didn’t have the patience to wait for it to reconnect, so I restarted the NetworkManager service after 10 minutes.
To add to previous observations, during interruptions iwconfig still reports connection to my network ESSID, Access Point [MAC ADDRESS], and fluctuating Link Quality and Signal level stats.
Each host will have two keys, one is used for unicast traffic, other one is used for broadcast traffic (group). Accesspoint is what initiates the group key exchanges, usually on a timer. Typical values for the timer are 5min (Mikrotik), 30min (OpenWRT), 60min (ddwrt), either never or 2h (TP-Link).
Group key needs to rotate every once in a while to prevent disconnected stations from sniffing or injecting broadcast traffic long after initial connection. Typically you need broadcast to work unless you want static IP and static arp on every host in lan.
The encryption/decryption is hardware accelerated, keys are stored and maintained in memory of the wifi nic as (mac address, key) pairs. wpa_supplicant/hostapd (on station/ap - 2 utilities sharing the codebase) will maintain the entries via a compatible driver.
I’d say in this case it’s likely your wpa_supplicant or hostapd is having issues communicating with the driver.
Yes, they shouldn’t happen that frequently for each of the devices while connected, keys should be exchanged on reconnection, on enough traffic or whenever a client asks. It’s ok to see it all the time for the same client it it’s roaming between APs.
–
Depends on hostapd.conf ddwrt scripts end up generating, I wouldn’t worry too much.
iwconfig is the old utility using the old API and it’s needed with old drivers. iw and iwlist are currently maintained utilities for mac80211 compatible wifi drivers . Generally you need iw, iwlist, wpa_supplicant, drivers and config files for wifi to work.
–
You can try setting the group key rotation interval to never or maxint or some ridiculously high value, if keys never change once established the broadcast traffic should work forever. It wouldn’t fix your drivers but might mitigate your issues.
Would that correspond to “Key renewal interval” (in Wireless -> Wireless Security)? Default: 3600, Range: 1 - 99999. Right now I upgraded to the latest (r36808) ddwrt. If the problem happens again, I can try changing this next.
Would that mean the problem and solution are in the AP firmware and client kernel drivers? Client is current in updates on Fedora 28 ( 4.17.19-200.fc28.x86_64, wpa_supplicant v2.6). It would be such a relief if a firmware update solved this…
Ok, that’s possible. Some devices are cellphones that go back and forth between the AP and the router’s wireless as people walk through the house.
Long ago I learned to use ifconfig/iwconfig for quick network info and stuck with it. I like how quick and compact the output is. But I’m not using them for setting configuration, just displaying. Would you suggest using eg. iwlist wlp6s0 scan instead?
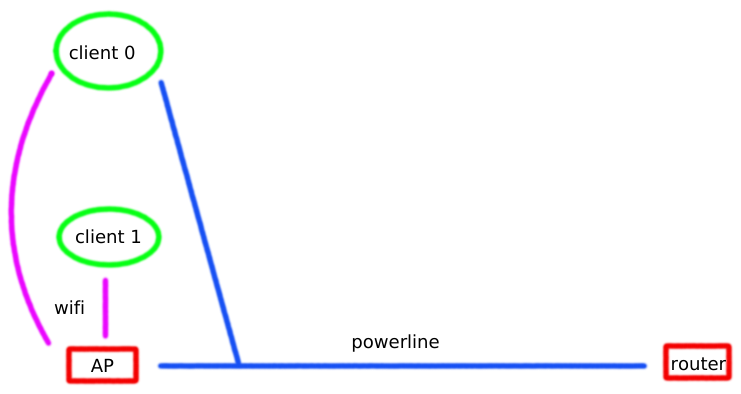
The AP (basement), client 1 (first floor), and client 0 (second floor) are nearly vertically lined up with each other.
Client 0 can be connected to the network by wifi, or by powerline adapter (ethernet over powerline). The backhaul between the AP and router is with powerline adapters.
Observations:
average pings are generally in single or sometimes double digits
max ping over wifi for client 0 typically reaches ~2000 ms, even 5000 ms
max ping over wifi for client 1 is often over ~1000 ms
max ping over powerline to the router can also reach ~1000 ms
max ping over powerline for client 0 is on the order of several hundred ms, much better than on wifi
max throughput between client 0 and the netbook, measured with iperf3 is:
over powerline: a consistent ~20 Mbps with 0 retries
over wifi: usually ~60 Mbps or as low as 10 Mbps, with dozens/hundreds of retries in most cases
internet speedtest with client 0 and a nominal 15/10 Mbps cable internet connection, measured with speedtest-cli:
over powerline: consistent 16.5/11 Mbps download/upload
over wifi: usually 14.5/8 Mbps dl/ul, dropping to 8-10 Mbps download when iperf3 shows lower (10-20 Mbps) network throughput
When the network issues occur with client 0 over wifi:
other clients such as client 1 don’t seem to be affected
resolving the network issue requires either waiting ~5 minutes or disconnecting/reconnecting with network manager
When network issues occur with client 0 over powerline, the following happens though it’s not clear if it’s always the case:
client 0 fails to ping the router or any device connected to the router (eg. ATA) (consistent)
however, client 0’s tmux session to the netbook continues to work, and can ping the router this way
client 0 succeeds in pinging the AP and client 1
the netbook continues to succeed pinging the router during this time
So we can conclude this is not (exclusively) a wifi issue since it still happens when there is no wifi segment between client 0 and the router.
The network issues do happen more frequently when using wifi. I’m not sure if it’s coincidence but it seemed like the max ping is higher when both client 0 and client 1 use wifi. Maybe interference since client 1 is directly in between?
I’m not sure how to think of powerline connections, and whether it’s a point-to-point connection or some kind of mesh network. There are 4 powerline adapters connecting the router, AP, client 0, and a PS3.
So, what could cause connectivity to drop between client 0 and the router, while not affecting other devices?
I don’t think the ping times are bad, but the max and lost packets might be an issue. Here are some stats from the netbook connected by ethernet to the AP during a quiet time recently, which includes a short network interruption for my computer (client 0):
Often the maxes are higher, but it’s typical for the xmt and rcv not to be equal. Given the large number due to how long I run it, the %loss is usually 0.
Maybe I could test with an ethernet backhaul between the router and AP for a while, but it’s very inconvenient to pass wire to literally the opposite corners of the house. A Permanent wired solution would be even harder.
Yeah i realize the the cable will be a pain but bypassing the the power line adapters may be the key in solving this . so may be worth the inconvenience.
as for stp it should be on the router. as it should be the main device controlling the network.
but in this case who knows anymore and enabling stp on the access point may work better.
Is it a problem if both the router and AP have STP enabled? That is currently the case.
Ok, I’m now testing with a 100’ ethernet backhaul between the router and AP. I’ve removed all powerline adapters from my network.
This means my computer (client 0) is now connected with wifi to the AP (can also connect to the router’s wifi), so it does bring back the possibility of wifi interference issues. At least some data can be collected on the behavior without any powerline adapters.
As typical from this location on wifi, iperf3 shows ~50 Mbps with some retries:
looks like it can be run on both, but it brings into question if the stp protocol is the same on both devices . it should be … but i cant be sure.
so i think err’ing on the side of caution is the best approach and try it on only one of the devices. as that should keep things simple and hopefully predictable.
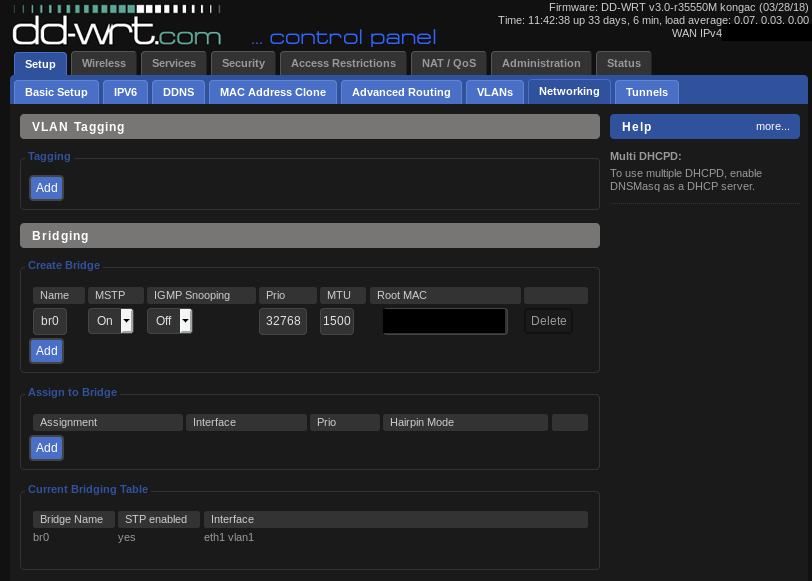
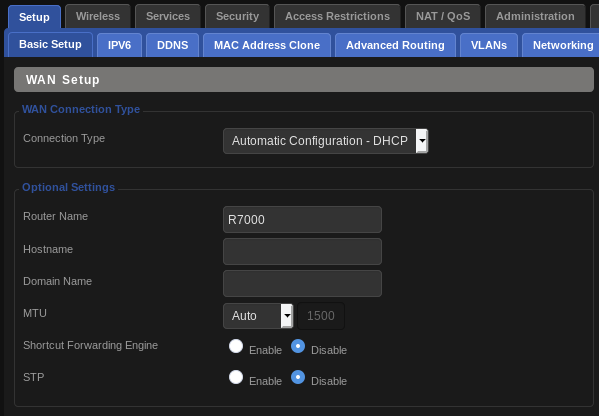
I’ve now turned off STP on the AP and left it enabled on the router. Actually the router says MSTP, so assuming the labelling is significant, they are different versions according to your link.
Wonder if not having STP on all switches kinda undermines the purpose of enabling STP in the first place.
I have different versions of dd-wrt on the router ( DD-WRT v3.0-r35550M kongac (03/28/18) Kong build for Broadcom) and the AP ( DD-WRT v3.0-r36808M std (08/30/18) BrainSlayer build for Atheros).
I also haven’t updated them in a while, partly because they seemed fine, and also because I didn’t want to introduce another variable in my testing right now.
Can we design tests to confirm or rule out whether the network issues could be STP-related problems?
Any clue how powerline adapters connect among themselves? With multiple adapters, maybe they created loops, and/or had issues if/when the network topology changed if some lost contact?
You can’t diagnose problems without being willing to test components.
Either you suck it up and isolate/test the components, or you’ll continue going around in circles for another 4-6 months.
I work in enterprise networking; even in enterprise we schedule downtime to troubleshoot and resolve issues in a timely manner, if you’re actually going to commit to testing things you could likely sort this out in a weekend.
I don’t feel I know enough networking to pull that off. And the intermittent nature of this problem makes this difficult and time-consuming.
As you’ve mentioned, the problem could be wifi OR powerline, and problem is I can’t get rid of both. I’ve tried isolating each and I’ve still had the problem, though with different frequency.
Right now I’ve removed all powerline adapters and connected the router to the AP with ethernet. I’m running the pinging script from a wired device at the AP.
Wifi does seem to have its issues with an order of magnitude larger average and max pings:
Is there any significance to a ping returning nothing or “Destination Host Unreachable” during a connectivity issue, then suddenly returning a pile of the delayed pings when the connection gets automagically restored?
Pings to the router and AP from my system (client 0) during the latest network issue:
router
PING 192.168.2.1 (192.168.2.1) 56(84) bytes of data.
64 bytes from 192.168.2.1: icmp_seq=1 ttl=64 time=109081 ms
64 bytes from 192.168.2.1: icmp_seq=2 ttl=64 time=108028 ms
64 bytes from 192.168.2.1: icmp_seq=3 ttl=64 time=107028 ms
64 bytes from 192.168.2.1: icmp_seq=4 ttl=64 time=105987 ms
64 bytes from 192.168.2.1: icmp_seq=5 ttl=64 time=104963 ms
64 bytes from 192.168.2.1: icmp_seq=6 ttl=64 time=103943 ms
64 bytes from 192.168.2.1: icmp_seq=7 ttl=64 time=102919 ms
64 bytes from 192.168.2.1: icmp_seq=8 ttl=64 time=101895 ms
64 bytes from 192.168.2.1: icmp_seq=9 ttl=64 time=100872 ms
64 bytes from 192.168.2.1: icmp_seq=10 ttl=64 time=99848 ms
64 bytes from 192.168.2.1: icmp_seq=11 ttl=64 time=98824 ms
64 bytes from 192.168.2.1: icmp_seq=12 ttl=64 time=97800 ms
64 bytes from 192.168.2.1: icmp_seq=13 ttl=64 time=96794 ms
64 bytes from 192.168.2.1: icmp_seq=14 ttl=64 time=95770 ms
64 bytes from 192.168.2.1: icmp_seq=15 ttl=64 time=94746 ms
64 bytes from 192.168.2.1: icmp_seq=16 ttl=64 time=93722 ms
64 bytes from 192.168.2.1: icmp_seq=18 ttl=64 time=91674 ms
64 bytes from 192.168.2.1: icmp_seq=19 ttl=64 time=90650 ms
64 bytes from 192.168.2.1: icmp_seq=20 ttl=64 time=89626 ms
64 bytes from 192.168.2.1: icmp_seq=21 ttl=64 time=88602 ms
64 bytes from 192.168.2.1: icmp_seq=22 ttl=64 time=87580 ms
64 bytes from 192.168.2.1: icmp_seq=23 ttl=64 time=86556 ms
64 bytes from 192.168.2.1: icmp_seq=24 ttl=64 time=85533 ms
64 bytes from 192.168.2.1: icmp_seq=25 ttl=64 time=84509 ms
64 bytes from 192.168.2.1: icmp_seq=26 ttl=64 time=83485 ms
64 bytes from 192.168.2.1: icmp_seq=27 ttl=64 time=82461 ms
64 bytes from 192.168.2.1: icmp_seq=28 ttl=64 time=81437 ms
64 bytes from 192.168.2.1: icmp_seq=29 ttl=64 time=80436 ms
64 bytes from 192.168.2.1: icmp_seq=30 ttl=64 time=79389 ms
64 bytes from 192.168.2.1: icmp_seq=31 ttl=64 time=78365 ms
64 bytes from 192.168.2.1: icmp_seq=32 ttl=64 time=77364 ms
64 bytes from 192.168.2.1: icmp_seq=33 ttl=64 time=76317 ms
64 bytes from 192.168.2.1: icmp_seq=35 ttl=64 time=74292 ms
64 bytes from 192.168.2.1: icmp_seq=36 ttl=64 time=73245 ms
64 bytes from 192.168.2.1: icmp_seq=37 ttl=64 time=72221 ms
64 bytes from 192.168.2.1: icmp_seq=38 ttl=64 time=71219 ms
64 bytes from 192.168.2.1: icmp_seq=41 ttl=64 time=68149 ms
64 bytes from 192.168.2.1: icmp_seq=42 ttl=64 time=67101 ms
64 bytes from 192.168.2.1: icmp_seq=43 ttl=64 time=66077 ms
64 bytes from 192.168.2.1: icmp_seq=46 ttl=64 time=63006 ms
64 bytes from 192.168.2.1: icmp_seq=48 ttl=64 time=60957 ms
64 bytes from 192.168.2.1: icmp_seq=49 ttl=64 time=59933 ms
64 bytes from 192.168.2.1: icmp_seq=50 ttl=64 time=58909 ms
64 bytes from 192.168.2.1: icmp_seq=52 ttl=64 time=56862 ms
64 bytes from 192.168.2.1: icmp_seq=53 ttl=64 time=55861 ms
64 bytes from 192.168.2.1: icmp_seq=54 ttl=64 time=54814 ms
64 bytes from 192.168.2.1: icmp_seq=55 ttl=64 time=53790 ms
64 bytes from 192.168.2.1: icmp_seq=56 ttl=64 time=52789 ms
64 bytes from 192.168.2.1: icmp_seq=59 ttl=64 time=49717 ms
64 bytes from 192.168.2.1: icmp_seq=60 ttl=64 time=48670 ms
64 bytes from 192.168.2.1: icmp_seq=63 ttl=64 time=45598 ms
64 bytes from 192.168.2.1: icmp_seq=64 ttl=64 time=44574 ms
64 bytes from 192.168.2.1: icmp_seq=65 ttl=64 time=43573 ms
64 bytes from 192.168.2.1: icmp_seq=66 ttl=64 time=42526 ms
64 bytes from 192.168.2.1: icmp_seq=67 ttl=64 time=41502 ms
64 bytes from 192.168.2.1: icmp_seq=68 ttl=64 time=40478 ms
64 bytes from 192.168.2.1: icmp_seq=69 ttl=64 time=39454 ms
64 bytes from 192.168.2.1: icmp_seq=70 ttl=64 time=38430 ms
64 bytes from 192.168.2.1: icmp_seq=71 ttl=64 time=37406 ms
64 bytes from 192.168.2.1: icmp_seq=72 ttl=64 time=36382 ms
64 bytes from 192.168.2.1: icmp_seq=73 ttl=64 time=35358 ms
64 bytes from 192.168.2.1: icmp_seq=74 ttl=64 time=34334 ms
64 bytes from 192.168.2.1: icmp_seq=75 ttl=64 time=33310 ms
64 bytes from 192.168.2.1: icmp_seq=76 ttl=64 time=32286 ms
64 bytes from 192.168.2.1: icmp_seq=77 ttl=64 time=31262 ms
64 bytes from 192.168.2.1: icmp_seq=78 ttl=64 time=30261 ms
64 bytes from 192.168.2.1: icmp_seq=79 ttl=64 time=29215 ms
64 bytes from 192.168.2.1: icmp_seq=80 ttl=64 time=28190 ms
64 bytes from 192.168.2.1: icmp_seq=81 ttl=64 time=27189 ms
64 bytes from 192.168.2.1: icmp_seq=82 ttl=64 time=26142 ms
64 bytes from 192.168.2.1: icmp_seq=83 ttl=64 time=25119 ms
64 bytes from 192.168.2.1: icmp_seq=84 ttl=64 time=24119 ms
64 bytes from 192.168.2.1: icmp_seq=85 ttl=64 time=23071 ms
64 bytes from 192.168.2.1: icmp_seq=86 ttl=64 time=22047 ms
64 bytes from 192.168.2.1: icmp_seq=87 ttl=64 time=21046 ms
64 bytes from 192.168.2.1: icmp_seq=88 ttl=64 time=19999 ms
64 bytes from 192.168.2.1: icmp_seq=89 ttl=64 time=18975 ms
64 bytes from 192.168.2.1: icmp_seq=90 ttl=64 time=17974 ms
64 bytes from 192.168.2.1: icmp_seq=91 ttl=64 time=16927 ms
64 bytes from 192.168.2.1: icmp_seq=92 ttl=64 time=15903 ms
64 bytes from 192.168.2.1: icmp_seq=94 ttl=64 time=13855 ms
64 bytes from 192.168.2.1: icmp_seq=95 ttl=64 time=12831 ms
64 bytes from 192.168.2.1: icmp_seq=96 ttl=64 time=11830 ms
64 bytes from 192.168.2.1: icmp_seq=97 ttl=64 time=10783 ms
64 bytes from 192.168.2.1: icmp_seq=98 ttl=64 time=9759 ms
64 bytes from 192.168.2.1: icmp_seq=99 ttl=64 time=8759 ms
64 bytes from 192.168.2.1: icmp_seq=100 ttl=64 time=7711 ms
64 bytes from 192.168.2.1: icmp_seq=101 ttl=64 time=6687 ms
64 bytes from 192.168.2.1: icmp_seq=102 ttl=64 time=5685 ms
64 bytes from 192.168.2.1: icmp_seq=103 ttl=64 time=4639 ms
64 bytes from 192.168.2.1: icmp_seq=104 ttl=64 time=0.922 ms
64 bytes from 192.168.2.1: icmp_seq=105 ttl=64 time=0.975 ms
64 bytes from 192.168.2.1: icmp_seq=106 ttl=64 time=2.85 ms
^C
— 192.168.2.1 ping statistics —
106 packets transmitted, 93 received, 12% packet loss, time 111558ms
rtt min/avg/max/mdev = 0.922/54721.134/109081.901/32888.290 ms, pipe 103
AP
PING 192.168.2.2 (192.168.2.2) 56(84) bytes of data.
From 192.168.2.8 icmp_seq=7 Destination Host Unreachable
From 192.168.2.8 icmp_seq=8 Destination Host Unreachable
From 192.168.2.8 icmp_seq=9 Destination Host Unreachable
From 192.168.2.8 icmp_seq=10 Destination Host Unreachable
From 192.168.2.8 icmp_seq=11 Destination Host Unreachable
From 192.168.2.8 icmp_seq=12 Destination Host Unreachable
From 192.168.2.8 icmp_seq=13 Destination Host Unreachable
From 192.168.2.8 icmp_seq=14 Destination Host Unreachable
From 192.168.2.8 icmp_seq=15 Destination Host Unreachable
From 192.168.2.8 icmp_seq=16 Destination Host Unreachable
From 192.168.2.8 icmp_seq=17 Destination Host Unreachable
From 192.168.2.8 icmp_seq=18 Destination Host Unreachable
From 192.168.2.8 icmp_seq=19 Destination Host Unreachable
From 192.168.2.8 icmp_seq=20 Destination Host Unreachable
From 192.168.2.8 icmp_seq=21 Destination Host Unreachable
From 192.168.2.8 icmp_seq=31 Destination Host Unreachable
From 192.168.2.8 icmp_seq=32 Destination Host Unreachable
From 192.168.2.8 icmp_seq=33 Destination Host Unreachable
From 192.168.2.8 icmp_seq=34 Destination Host Unreachable
From 192.168.2.8 icmp_seq=35 Destination Host Unreachable
From 192.168.2.8 icmp_seq=36 Destination Host Unreachable
From 192.168.2.8 icmp_seq=37 Destination Host Unreachable
From 192.168.2.8 icmp_seq=38 Destination Host Unreachable
From 192.168.2.8 icmp_seq=39 Destination Host Unreachable
From 192.168.2.8 icmp_seq=40 Destination Host Unreachable
From 192.168.2.8 icmp_seq=41 Destination Host Unreachable
From 192.168.2.8 icmp_seq=42 Destination Host Unreachable
From 192.168.2.8 icmp_seq=43 Destination Host Unreachable
From 192.168.2.8 icmp_seq=44 Destination Host Unreachable
From 192.168.2.8 icmp_seq=45 Destination Host Unreachable
From 192.168.2.8 icmp_seq=56 Destination Host Unreachable
From 192.168.2.8 icmp_seq=57 Destination Host Unreachable
From 192.168.2.8 icmp_seq=58 Destination Host Unreachable
From 192.168.2.8 icmp_seq=59 Destination Host Unreachable
From 192.168.2.8 icmp_seq=60 Destination Host Unreachable
From 192.168.2.8 icmp_seq=61 Destination Host Unreachable
From 192.168.2.8 icmp_seq=62 Destination Host Unreachable
From 192.168.2.8 icmp_seq=63 Destination Host Unreachable
From 192.168.2.8 icmp_seq=64 Destination Host Unreachable
From 192.168.2.8 icmp_seq=65 Destination Host Unreachable
From 192.168.2.8 icmp_seq=66 Destination Host Unreachable
From 192.168.2.8 icmp_seq=67 Destination Host Unreachable
From 192.168.2.8 icmp_seq=68 Destination Host Unreachable
From 192.168.2.8 icmp_seq=69 Destination Host Unreachable
From 192.168.2.8 icmp_seq=70 Destination Host Unreachable
From 192.168.2.8 icmp_seq=71 Destination Host Unreachable
From 192.168.2.8 icmp_seq=72 Destination Host Unreachable
From 192.168.2.8 icmp_seq=73 Destination Host Unreachable
From 192.168.2.8 icmp_seq=74 Destination Host Unreachable
From 192.168.2.8 icmp_seq=75 Destination Host Unreachable
From 192.168.2.8 icmp_seq=76 Destination Host Unreachable
From 192.168.2.8 icmp_seq=77 Destination Host Unreachable
From 192.168.2.8 icmp_seq=78 Destination Host Unreachable
From 192.168.2.8 icmp_seq=79 Destination Host Unreachable
From 192.168.2.8 icmp_seq=80 Destination Host Unreachable
From 192.168.2.8 icmp_seq=81 Destination Host Unreachable
From 192.168.2.8 icmp_seq=82 Destination Host Unreachable
From 192.168.2.8 icmp_seq=83 Destination Host Unreachable
From 192.168.2.8 icmp_seq=84 Destination Host Unreachable
From 192.168.2.8 icmp_seq=85 Destination Host Unreachable
From 192.168.2.8 icmp_seq=86 Destination Host Unreachable
From 192.168.2.8 icmp_seq=87 Destination Host Unreachable
From 192.168.2.8 icmp_seq=88 Destination Host Unreachable
64 bytes from 192.168.2.2: icmp_seq=2 ttl=64 time=89467 ms
64 bytes from 192.168.2.2: icmp_seq=3 ttl=64 time=88443 ms
64 bytes from 192.168.2.2: icmp_seq=4 ttl=64 time=87419 ms
64 bytes from 192.168.2.2: icmp_seq=5 ttl=64 time=86403 ms
64 bytes from 192.168.2.2: icmp_seq=6 ttl=64 time=85379 ms
64 bytes from 192.168.2.2: icmp_seq=22 ttl=64 time=68997 ms
64 bytes from 192.168.2.2: icmp_seq=23 ttl=64 time=67974 ms
64 bytes from 192.168.2.2: icmp_seq=24 ttl=64 time=66950 ms
64 bytes from 192.168.2.2: icmp_seq=25 ttl=64 time=65928 ms
64 bytes from 192.168.2.2: icmp_seq=26 ttl=64 time=64904 ms
64 bytes from 192.168.2.2: icmp_seq=27 ttl=64 time=63880 ms
64 bytes from 192.168.2.2: icmp_seq=28 ttl=64 time=62856 ms
64 bytes from 192.168.2.2: icmp_seq=29 ttl=64 time=61844 ms
64 bytes from 192.168.2.2: icmp_seq=30 ttl=64 time=60826 ms
64 bytes from 192.168.2.2: icmp_seq=47 ttl=64 time=43418 ms
64 bytes from 192.168.2.2: icmp_seq=48 ttl=64 time=42394 ms
64 bytes from 192.168.2.2: icmp_seq=50 ttl=64 time=40346 ms
64 bytes from 192.168.2.2: icmp_seq=51 ttl=64 time=39322 ms
64 bytes from 192.168.2.2: icmp_seq=53 ttl=64 time=37274 ms
64 bytes from 192.168.2.2: icmp_seq=54 ttl=64 time=36250 ms
64 bytes from 192.168.2.2: icmp_seq=55 ttl=64 time=35226 ms
64 bytes from 192.168.2.2: icmp_seq=90 ttl=64 time=0.912 ms
64 bytes from 192.168.2.2: icmp_seq=91 ttl=64 time=0.903 ms
^C
— 192.168.2.2 ping statistics —
91 packets transmitted, 23 received, +63 errors, 74% packet loss, time 92177ms
rtt min/avg/max/mdev = 0.903/56326.689/89467.672/24700.087 ms, pipe 88