https://www.bufferbloat.net/projects/bloat/wiki/Introduction/
Is QOS configurable on your router?
Practical Packet Analysis: Using Wireshark to Solve Real-World Network Problems https://www.amazon.com/dp/1593272669/ref=cm_sw_r_cp_api_6VABBbX85V7B3
https://www.bufferbloat.net/projects/bloat/wiki/Introduction/
Is QOS configurable on your router?
Practical Packet Analysis: Using Wireshark to Solve Real-World Network Problems https://www.amazon.com/dp/1593272669/ref=cm_sw_r_cp_api_6VABBbX85V7B3
my guess is your problem is here, hostapd and it’s affiliates tends to spass out at times, on my home network, which i use hostapd as a wifi hotspot, if i connect a “to slow” device basically it halts my whole network to the point where it cant even watch youtube. But try attaching a computer running wireshark, and see what happens to the traffic when it happens.
My setup is a raspberry pi which bridges to my modem, running some dhcp, ip-tables, and all that jazz, but if i connect a slow wifi device, and start downloading lets say a steam game, my whole network, even wired goes full retard.
if i disconnect the slow device and give the network a minute or two to cool down everything returns to normal.
I tried to scroll through the responses above. But your issues sounds like something is a bit bonkers with dhcp, perhaps other parts as well. If you don’t already have tried it - increase lease-time and see if the problem happens more in correspondence with the new settings.
Second, lock in your leases to static entries.
third, attach a machine or a few with static ip’s set. Run ‘debugging’ all the time, check in when other parts misbehave to check out if it misbehaves as well.
You’re supposed to have some counters for invalid frames be different than zero, that’s ok.
Do you happen to have a wired computer or a USB drive where you could redirect verbose logs from hostapd on ddwrt?
You could leave a ping or MTR running in other direction as well
Thanks to everyone for all the input and ideas.
Of course you’re right but unfortunately, I have the added constraint of non-destructive testing. Network users won’t be happy with disruptions, so ideally diagnostics should be done with devices I control.
I could switch the AP (TP-Link WR841N + ddwrt vs Engenius ESR-9850 + stock firmware) with another one though at least temporarily. Maybe better than nothing?
Continued happening after replacing my old system with a new one, using different WLAN cards (Atheros on old, Realtek on new). Ubuntu vs Fedora.
Yes, router is a Netgear R7000. I was using QOS with FQ_CODEL, but recently disabled QOS since things seem fine (and faster) without it and I wanted to eliminate a variable.
Is there a shorter tutorial you’d recommend for this issue?
My issue is that even ping fails, so it’s not just about reduced throughput. Is hostapd still suspect?
Leases are 1440 minutes by default. My affected machine has a static IP, as do several others.
I confirmed that when one machine has the network drop and outgoing pings fail, another machine (netbook) was able to connect to the AP/router/internet without problems, but pinging the affected machine failed.
What do you mean by "run ‘debugging’ " ?
I could leave a running netbook wired to the AP, would that help? Where do I set verbose logs from hostapd on ddwrt? I already have logging enabled on both the AP and router, though not redirected to another system at the moment. The AP has entries from hostapd but they’re just about authenticating, handshakes, etc. I haven’t noticed any hostapd messages on the router although it also has some (fewer) wifi clients.
2 things there.
It is expected that you’ll get slower results from a speed test with QOS/FQ_CODEL on because it will always try to keep some bandwidth open for new connections. However, it is processor intensive (and I think single-threaded?), so:
at some point it will hit a brick wall. For instance, on my Ubiquiti router, it peaks at around 100mbs with “Smart QOS” enabled. The good news there is that it (in my experience at least) it’s not necessary once you have 3-digit speeds.
You don’t really need to order and read through that whole book, but wireshark is a go-to for troubleshooting network.
I haven’t read through every post here, but have you tested each connection with iperf? I would eliminate layer 1 issues before anything else, especially since you’ve got powerline adapters in the mix.
Whoever mentioned starting at the top or bottom and incrementally moving through the network is correct, although I’d almost always recommend starting at the bottom. I doubt your problem is in layers 4, 5, 6 or 7.
ping -A can be your friend if you want to get some work done (or relax) while you wait for something bad to happen.
Sorry for the defuse line of “run debugging”. What I mean is that you collect data in form of ping with ip, dns, and checking your routes (can you reach the specific machines) - however you stated that you do have machines with static addresses already…
Verify the following:
Do your static address space collide with the dhcp space?
Have you seen any logs indicating that one machine has multiple leases?
Have you ran out of leases?
Is the problem something you believe can be related to the lease time with the above checked?
How many windows 10 machines in total? Are they all set to “hide their mac” as it does by default (ie, screws up address leases and fills the dhcp with requests and sometimes does not release it correctly…)?
The last point is valid, if you are using equipment that decides to renew their mac-address etc.
How does your ARP-cache look like on your router? It can give hints to if the above is true.
They are seeing disruptions right now due to the drop outs that haven’t been fixed for over a month. 
Disruptive testing can be scheduled, unlike random drop outs.
Sometimes to bake a cake you gotta break some eggs.
Drop happened yet again. I had just changed the AP with a spare unit (wifi not as good) just a few hours ago.
@oO.o My internet is only 15/10 Mbps, so it should be nowhere near the point of overloading the router, QOS or not.
What should I be looking for with iperf?
Adaptive ping. Interpacket interval adapts to round-trip time, so that effectively not more than one (or more, if preload is set) unanswered probes present in the network. Minimal interval is 200msec for not super-user. On networks with low rtt this mode is essentially equivalent to flood mode.
Sorry, I’m not too familiar with networks. What is the reason for using ping -A ?
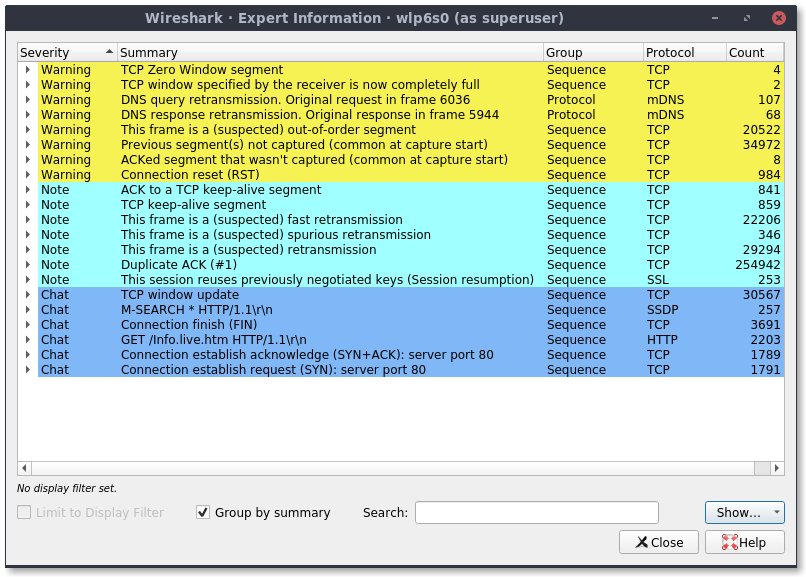
“Luckily” the latest drop happened while I had wireshark running. Does anything catch the eye?
DHCP is from 192.168.2.100 and up. Static IPs are 192.168.2.2 through 192.168.2.9.
No.
I don’t think so.
Lease time with DHCP is 1440 minutes. The machine I use on which I notice the drops has a static IP.
Just one windows 10 machine, and it’s rarely ever on. People who buy new computers but use their phone 99% of the time… But in any case there are typically at most about a dozen IP leases on the router status page, usually half that.
What is this and where can I check it?
Actually the issue has been around a few years… but you’re preaching to the choir. I go to great lengths to fix, optimize, etc.
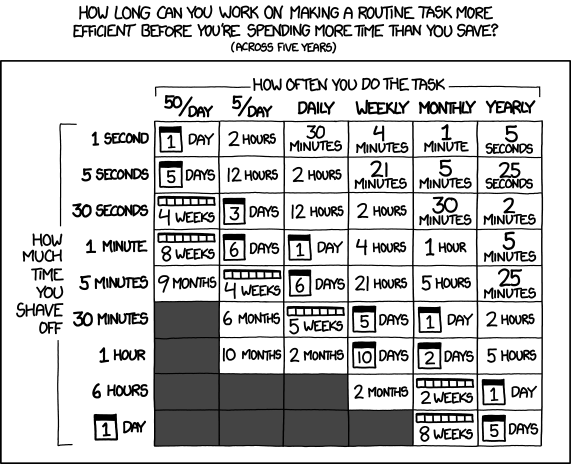
Most people, including techies I know who said they’ve experienced similar issues, just want to minimize effort, and really wont tolerate having devices disconnected or slowed down. Considering the disruption from the issue can be maybe just a minute every week or so, and easily worked around by reconnecting… the economics of this chart indicate I’ve already spent too much time:
I think you are at the point where you need to replace the wireless nic on the problem pc,
if im not mistaken you have already,
changed out the router, problem persisted.
changed out the access point problem persisted.
and its just this one machine that keeps dropping connection.
so next is the nic… hopefully that is the fix.
It’s not just one machine. My previous machine at the same location experienced the same thing with a different NIC. It seems to have happened with at least one other machine in a different location, but I don’t get good debugging info from other users, often only long after the fact.
It happened with:
-router: Engenius ESR-9850; AP: TP-Link WR841N
-router: Netgear R7000; AP: TP-link WR841N
-router: Netgear R7000; AP: Engenius ESR-9850
What is the brand and model of your power line adaptors?
from what I’ve read
Engenius ESR9850 - it’s a product that’s been around since 2010
TP-Link WR841N - it’s a product that’s been around since 2014
Netgear R7000 - looks like it came out 2016/2017 but it’s had issues
I read a few forum post and angry reviews of people that bought a TP-Link WR841N that were describing issues similar to the ones you are experiencing. Same with netgear R7000 but apparently resolved with newer firmware versions.
If those power line adaptors are TP-Link I’ve got bad news for you, random internet dropouts are a known thing that firmware updates might help with but as a matter of best practice i’d avoid using them if possible, running a Cat6 cable and keeping it well away from existing power cabling would be best.
The powerline adapters are TP-Link TL-PA511KIT and yes there are known issues with them having connection drops due to power savings issues.
I haven’t been able to confirm that my issue is due to the powerline adapters, although I’ve had my suspicions, since in my case when one device has the drop, others are still able to connect via a powerline route. Disconnecting/reconnecting the affected device from wifi seems to “fix” the drop and unless that’s a coincidence of timing I don’t see how that would work if the powerline adapters were the problem.
Also, the WR841N and R7000 are running ddwrt. The ESR9850 unfortunately has no ddwrt support, so it’s on the latest stock firmware and the R7000 was purchased to retire it.
Depends if that 1 minute per week is in the middle of something important now, doesn’t it?
Also depends on whether they complain about it. It seems like I’m the only one losing hair over this.
Not to bore you all, but it happened again. Does the ping output have any interesting clues? I started pinging when I noticed no internet.
$ ping 192.168.2.1
PING 192.168.2.1 (192.168.2.1) 56(84) bytes of data.
ping: sendmsg: No buffer space available
ping: sendmsg: No buffer space available
ping: sendmsg: No buffer space available
ping: sendmsg: No buffer space available
ping: sendmsg: No buffer space available
ping: sendmsg: No buffer space available
ping: sendmsg: No buffer space available
ping: sendmsg: No buffer space available
ping: sendmsg: No buffer space available
ping: sendmsg: No buffer space available
ping: sendmsg: No buffer space available
ping: sendmsg: No buffer space available
ping: sendmsg: No buffer space available
ping: sendmsg: No buffer space available
ping: sendmsg: No buffer space available
ping: sendmsg: No buffer space available
ping: sendmsg: No buffer space available
ping: sendmsg: No buffer space available
ping: sendmsg: No buffer space available
ping: sendmsg: No buffer space available
ping: sendmsg: No buffer space available
ping: sendmsg: No buffer space available
ping: sendmsg: No buffer space available
ping: sendmsg: No buffer space available
ping: sendmsg: No buffer space available
ping: sendmsg: No buffer space available
ping: sendmsg: No buffer space available
ping: sendmsg: No buffer space available
ping: sendmsg: No buffer space available
ping: sendmsg: No buffer space available
ping: sendmsg: No buffer space available
ping: sendmsg: No buffer space available
ping: sendmsg: No buffer space available
ping: sendmsg: No buffer space available
ping: sendmsg: No buffer space available
ping: sendmsg: No buffer space available
ping: sendmsg: No buffer space available
ping: sendmsg: No buffer space available
ping: sendmsg: No buffer space available
64 bytes from 192.168.2.1: icmp_seq=1 ttl=64 time=118531 ms
64 bytes from 192.168.2.1: icmp_seq=2 ttl=64 time=117489 ms
64 bytes from 192.168.2.1: icmp_seq=3 ttl=64 time=116465 ms
64 bytes from 192.168.2.1: icmp_seq=5 ttl=64 time=114417 ms
64 bytes from 192.168.2.1: icmp_seq=6 ttl=64 time=113394 ms
64 bytes from 192.168.2.1: icmp_seq=8 ttl=64 time=111346 ms
64 bytes from 192.168.2.1: icmp_seq=9 ttl=64 time=110322 ms
64 bytes from 192.168.2.1: icmp_seq=10 ttl=64 time=109298 ms
64 bytes from 192.168.2.1: icmp_seq=12 ttl=64 time=107250 ms
64 bytes from 192.168.2.1: icmp_seq=13 ttl=64 time=106226 ms
64 bytes from 192.168.2.1: icmp_seq=18 ttl=64 time=101106 ms
64 bytes from 192.168.2.1: icmp_seq=19 ttl=64 time=100082 ms
64 bytes from 192.168.2.1: icmp_seq=20 ttl=64 time=99058 ms
64 bytes from 192.168.2.1: icmp_seq=22 ttl=64 time=97014 ms
64 bytes from 192.168.2.1: icmp_seq=23 ttl=64 time=95990 ms
64 bytes from 192.168.2.1: icmp_seq=24 ttl=64 time=94966 ms
64 bytes from 192.168.2.1: icmp_seq=25 ttl=64 time=93942 ms
64 bytes from 192.168.2.1: icmp_seq=26 ttl=64 time=92918 ms
64 bytes from 192.168.2.1: icmp_seq=27 ttl=64 time=91894 ms
64 bytes from 192.168.2.1: icmp_seq=28 ttl=64 time=90870 ms
64 bytes from 192.168.2.1: icmp_seq=29 ttl=64 time=89846 ms
64 bytes from 192.168.2.1: icmp_seq=30 ttl=64 time=88822 ms
64 bytes from 192.168.2.1: icmp_seq=31 ttl=64 time=87798 ms
64 bytes from 192.168.2.1: icmp_seq=32 ttl=64 time=86774 ms
64 bytes from 192.168.2.1: icmp_seq=33 ttl=64 time=85750 ms
64 bytes from 192.168.2.1: icmp_seq=34 ttl=64 time=84726 ms
64 bytes from 192.168.2.1: icmp_seq=35 ttl=64 time=83702 ms
64 bytes from 192.168.2.1: icmp_seq=36 ttl=64 time=82678 ms
64 bytes from 192.168.2.1: icmp_seq=37 ttl=64 time=81654 ms
64 bytes from 192.168.2.1: icmp_seq=38 ttl=64 time=80630 ms
64 bytes from 192.168.2.1: icmp_seq=39 ttl=64 time=79606 ms
64 bytes from 192.168.2.1: icmp_seq=40 ttl=64 time=78582 ms
64 bytes from 192.168.2.1: icmp_seq=41 ttl=64 time=77558 ms
64 bytes from 192.168.2.1: icmp_seq=42 ttl=64 time=76534 ms
64 bytes from 192.168.2.1: icmp_seq=43 ttl=64 time=75510 ms
64 bytes from 192.168.2.1: icmp_seq=44 ttl=64 time=74486 ms
64 bytes from 192.168.2.1: icmp_seq=45 ttl=64 time=73462 ms
64 bytes from 192.168.2.1: icmp_seq=46 ttl=64 time=72439 ms
64 bytes from 192.168.2.1: icmp_seq=47 ttl=64 time=71415 ms
64 bytes from 192.168.2.1: icmp_seq=48 ttl=64 time=70391 ms
64 bytes from 192.168.2.1: icmp_seq=49 ttl=64 time=69367 ms
64 bytes from 192.168.2.1: icmp_seq=51 ttl=64 time=67319 ms
64 bytes from 192.168.2.1: icmp_seq=52 ttl=64 time=66295 ms
64 bytes from 192.168.2.1: icmp_seq=53 ttl=64 time=65271 ms
64 bytes from 192.168.2.1: icmp_seq=54 ttl=64 time=64247 ms
64 bytes from 192.168.2.1: icmp_seq=55 ttl=64 time=63223 ms
64 bytes from 192.168.2.1: icmp_seq=56 ttl=64 time=62198 ms
64 bytes from 192.168.2.1: icmp_seq=57 ttl=64 time=61175 ms
64 bytes from 192.168.2.1: icmp_seq=58 ttl=64 time=60151 ms
64 bytes from 192.168.2.1: icmp_seq=59 ttl=64 time=59127 ms
64 bytes from 192.168.2.1: icmp_seq=99 ttl=64 time=6.29 ms
64 bytes from 192.168.2.1: icmp_seq=100 ttl=64 time=2.99 ms
64 bytes from 192.168.2.1: icmp_seq=101 ttl=64 time=3.05 ms
64 bytes from 192.168.2.1: icmp_seq=102 ttl=64 time=2.66 ms
64 bytes from 192.168.2.1: icmp_seq=103 ttl=64 time=2.85 ms
64 bytes from 192.168.2.1: icmp_seq=104 ttl=64 time=2.94 ms
^C
--- 192.168.2.1 ping statistics ---
104 packets transmitted, 56 received, 46% packet loss, time 124361ms
rtt min/avg/max/mdev = 2.660/77202.876/118531.793/31247.224 ms, pipe 98
Observations:
ping output? What does that mean?You could try getting a Mikrotik hAP ac² or a Ubiquiti AP ac lite or a Mikrotik SXTsq Lite5 .
If it doesn’t solve your problem at least you’ll have a capable router and dual band AP or a decent well known popular dual band AP, and you’ll be able to maybe split clients across different channels for debugging and maybe you’ll be able to get rid of powerline with the sxt (it’s 16dbi gain is enough to erase some walls).
At that point you’ll know for sure it’s a client issue.
Just to double check, you’ve tried various 2.4GHz and 5GHz channels as well, it’s not analog interference?
No buffer space available generally means the network adapter lost its IP or carrier. As above, maybe its your machine.
Really you need to start shuffling network gear around (or plugging a laptop into different network segments to confirm which parts are affected during the issue) or isolating it in order to troubleshoot.
Until you do that, you’re simply wasting your time pissing into the wind.
Spending too much time on solving a problem may be bad, but even worse is wasting time doing things that have no hope of diagnosing the problem.
If you’re not willing to do what is required to diagnose it, then just accept that it is going to happen and live with it.
edit:
Have you at least been logging date/time of these drop outs? If not, i can not stress enough to DO THIS.
You may have no idea of any pattern in these drops that may exist, until you have say a few days or maybe even a week (or whatever) of date/time logs for the problem.
If its happening every 2 hours or 5 minutes or whatever then you can examine your network/environment for events that co-incide with those time intervals.
As an example on a mine site - i diagnosed a problem with WIFI that ended up being nothing to do with equipment - it was due to physical obstructions between the two p2p wireless devices. A truck loading area was stacking sea containers 3 high from time to time and blocking line of sight between the two devices…
Without accurate time/date log of the issue that would have been much more difficult to diagnose as a possibility from remote and then confirm with a site visit…
Thanks for the recommendations. I’ll keep them in mind, but I hope the problem can be solved without buying more stuff.
Only 2.4 GHz is being used and the channels are fixed:
I could try changing channels (suggestions?). Years ago those channels had seemed to work best, but things might have changed.
I have a spare netbook I could leave plugged in at different points in the network. Do you have specific testing setup suggestions?
I could leave it pinging various devices, using some tips to also print timestamps. There’s also Wireshark but I don’t know how to interpret the output, and leaving it running a long time seems to fill up a lot of disk space, but maybe that’s because I was using the system at the same time.