The sensors are not reporting data to the motherboard directly (and to your booted os), but they are instead connected to the BMC board that provides IPMI services (the one that lets you remote connect and perform operations remotely) …
https://www.supermicro.com/en/solutions/management-software/bmc-resources
1 Like
thank you MadMatt.
Impi/BMC is already setup.
I never used one of these boards. I was just expecting the usual sensors like on other boards.
Ok, so to recap what @wendell said, can you check the temps at the time you have the slowdowns? The fans spinning aren’t really a good indicator of whether your proc is thermal throtthling or not …
ok, up to 28 gigabit with a single thread? Try -P 4 to run with 4 threads at onnce. 28 gigabit on just one thread is not awful?
@MadMatt the temperatures in ipmi are around 35°C when running iperf, mostly less. So thermal throttling is not the issue.
@wendell When using multiple threads we can reach up to 38Gbit/s. But i think this is due to using multiple slow cores. Should we be able to get that speed with a single tcp thread?
In our use case we only have few applications that are mostly single threaded.
@flaep , I think it would be best if you do a recap of what performance you are getting now, consistently.
It’s one thing to say that you get 28Gbps on an iperf run with 1 thread, and that in the same run you see speeds going from 28 to 8 at the same time the core slows down, it is a completely different thing if you are wondering how to get iperf to actually test wire speed of your system, without at least knowing what’s on the other side… are you sure your client is the one responsible for the slowdown?
Also, what cpu governor are you using, and are you setting it for all cores? If you set all cores to perfromance, none of them should just decide on its own to ‘slow down’ …
Recap and it stopped working again.
Two identical server:
AMD EPYC 7413
8x MultiBitECC 3200 MHz 16384 MB Memory
Supermicro H12SSL-CT
Intel XL710 40GBe
Ubuntu 20.04.3 LTS 5.4.0-84-gene
all of the following settings are the same on both
I test from one of them to the other
they are directly connected, no switch
Bios: Global C-State control: disabled
There are no other c-state setting i could find.
tuned-adm profile network-throughput set the following parameter
 kernel.sched_min_granularity_ns = 10000000
 governor=performance
 energy_perf_bias=performance
 min_perf_pct=100
 readahead=>4096
 kernel.sched_wakeup_granularity_ns = 15000000
 vm.dirty_ratio = 40
 vm.dirty_background_ratio = 10
 vm.dirty_background_ratio = 10
 net.ipv4.tcp_rmem="4096 87380 16777216"
 net.ipv4.tcp_wmem="4096 16384 16777216"
 net.ipv4.udp_mem="3145728 4194304 16777216"
Verified that CPU governor is set to performance on all cores.
 cat /sys/devices/system/cpu/cpu*/cpufreq/scaling_governor
performance
performance
performance
...
MTU 9000
 ip link show enp194s0
 4: enp194s0: <BROADCAST,MULTICAST,UP,LOWER_UP> mtu 9000 qdisc mq state UP mode DEFAULT group default qlen 1000
     link/ether M:A:C brd ff:ff:ff:ff:ff:ff
The CPU/core running the iperf -s (the server) throttles when iperf is started.
In the following example I run the iperf sever on a single core to make logging
easier.
taskset -c 0 iperf -s
iperf -c $IP -i 1 -t 30 | ts | tee iperf.log
[  3]  0.0-30.0 sec  27.9 GBytes  7.98 Gbits/sec
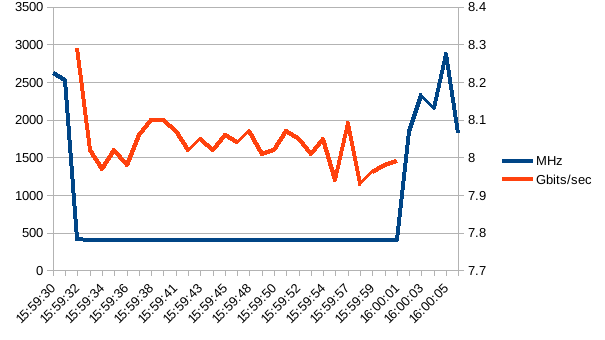
and the numbers
| time | MHz | Gbits/sec |
|---|---|---|
| 15:59:30 | 2623.537 | |
| 15:59:31 | 2531.493 | |
| 15:59:32 | 413.7 | 8.29 |
| 15:59:33 | 403.861 | 8.02 |
| 15:59:34 | 401.346 | 7.97 |
| 15:59:35 | 400.301 | 8.02 |
| 15:59:36 | 400.792 | 7.98 |
| 15:59:37 | 401.776 | 8.06 |
| 15:59:38 | 400.001 | 8.1 |
| 15:59:40 | 401.511 | 8.1 |
| 15:59:41 | 401.019 | 8.07 |
| 15:59:42 | 400.001 | 8.02 |
| 15:59:43 | 400.001 | 8.05 |
| 15:59:44 | 403.356 | 8.02 |
| 15:59:45 | 402.911 | 8.06 |
| 15:59:46 | 403.907 | 8.04 |
| 15:59:48 | 402.306 | 8.07 |
| 15:59:49 | 401.64 | 8.01 |
| 15:59:50 | 400.593 | 8.02 |
| 15:59:51 | 400.001 | 8.07 |
| 15:59:52 | 400.559 | 8.05 |
| 15:59:53 | 400.539 | 8.01 |
| 15:59:54 | 408.347 | 8.05 |
| 15:59:56 | 404.144 | 7.94 |
| 15:59:57 | 400.514 | 8.09 |
| 15:59:58 | 409.273 | 7.93 |
| 15:59:59 | 400.001 | 7.96 |
| 16:00:00 | 402.115 | 7.98 |
| 16:00:01 | 403.138 | 7.99 |
| 16:00:02 | 1833.696 | |
| 16:00:03 | 2331.836 | |
| 16:00:04 | 2153.955 | |
| 16:00:05 | 2871.786 | |
| 16:00:06 | 1817.825 |
Example temps during test (40GB adapter is not listed because I dont know how to get readings)
| CPU Temp | 29 | Temperature |
|---|---|---|
| System Temp | 22 | Temperature |
| Peripheral Temp | 31 | Temperature |
| M2NVMeSSD Temp1 | N/A | Temperature |
| M2NVMeSSD Temp2 | N/A | Temperature |
| MB_10G_LAN Temp | 38 | Temperature |
| VRMCpu Temp | 26 | Temperature |
| VRMSoc Temp | 32 | Temperature |
| VRMABCD Temp | 31 | Temperature |
| VRMEFGH Temp | 32 | Temperature |
| P1_DIMMA~D Temp | 26 | Temperature |
| P1_DIMME~H Temp | 27 | Temperature |
Running iperf with multiple threads (iperf -p) and not limiting to a single core on the server I can reach up to 38 Gbit/s. It works because 48 Cores running on 400Mhz do there very best.
in this example only 37,5
 iperf -s
 iperf -c 192.168.175.101 -i 1 -t 30 -P 8
 [SUM]  0.0-30.0 sec   131 GBytes  37.5 Gbits/sec
@flaep , thanks, this is waay better in getting our heads around the issue.
- are you by chance logging the cpu load of the core running the iperf ?
- Is the throtthling happening only on one side or both ?
- have you tried increasing iperf’s tcp window (-w) ?
- just to rule out code issues on iperf’s side, have you tried using iperf3 instead?
-
are you by chance logging the cpu load of the core running the iperf ?
cpu load is 100% on the used core during iperf -
Is the throtthling happening only on one side or both ?
happens only on the server -
have you tried increasing iperf’s tcp window (-w) ?
Yes. This gives slightly better speeds up to 17 Gbit/s.
I tried from 8k to 2M always doubling the the amount.
No changes beyond 256k. If went up to 512M
The Cores do not clock down when providing a window -
just to rule out code issues on iperf’s side, have you tried using iperf3 instead?
iperf3 behaves just like iperf
Btw. all cores clock down even if taskset is used.
Oh man, and I was trying to be clever 
Last one, doest it happen on the second server as well if you switch client and server around?
Yes. Happens on both.
Happens with other distributions aswell. 
What are the values for scaling_min_freq and scaling_max_freq when that happens and, for good measure, what are the speeds the kernel thinks your proc can scale to?
cat  /sys/devices/system/cpu/cpu0/cpufreq/scaling_min_freq
cat  /sys/devices/system/cpu/cpu0/cpufreq/scaling_max_freq
cat /sys/devices/system/cpu/cpu0/cpufreq/cpuinfo_min_freq
cat /sys/devices/system/cpu/cpu0/cpufreq/cpuinfo_max_freq
her you go:
root@server:~# taskset -c 0 iperf -s

root@server:~# cat  /sys/devices/system/cpu/cpu0/cpufreq/scaling_min_freq
1500000
root@server:~# cat  /sys/devices/system/cpu/cpu0/cpufreq/scaling_max_freq
2650000
root@server:~# cat /sys/devices/system/cpu/cpu0/cpufreq/cpuinfo_min_freq
1500000
root@server:~# cat /sys/devices/system/cpu/cpu0/cpufreq/cpuinfo_max_freq
2650000
root@server2:~# iperf -c <IP> -i 1 -t 30
Ok, I am about to call it a bug in the Supermicro BIOS/MB … there is no reason it should throtthle to 400mhz with all the frequancies set correctly and the governor as well, other than thermal throtthling and that should happen only when the cpu temp goes over 85C …
I have found this:
… did you try to update your BIOS, or are you already running on the latest version?
thank you, i’ll give it a try.
What magic line did you feed to google to get that result?
+epyc throttling to 400mhz
that’s not fair, I tried that too
The Bios update did the trick, as far as i can tell.
After multiple reboots I still get around 20 Gbit/s with a single iperf thread. No throttling to 400 MHz. 39.6 Gbit/s with just two.
Thank you.
I installed BIOS_H12SSL-1B95_20210602_2.1_STDsp.zip.
Now I need to get the cpu governor to stick to performance after Reboot. That’s however a different issue.
2 Likes
Good
for the governor change at boot, this should do:
FYI:
Since I installed tuned-adm I just disabled cpufrequtils.
systemctl disable cpufrequtils.service.
Works too. No “patching” required
1 Like
This topic was automatically closed 273 days after the last reply. New replies are no longer allowed.