[Devember 2021] [Complete] A little system stats ticker

Hi all

I want to make a little app that logs system info like temps, system load, and which processes uses the most CPU time to a DB.
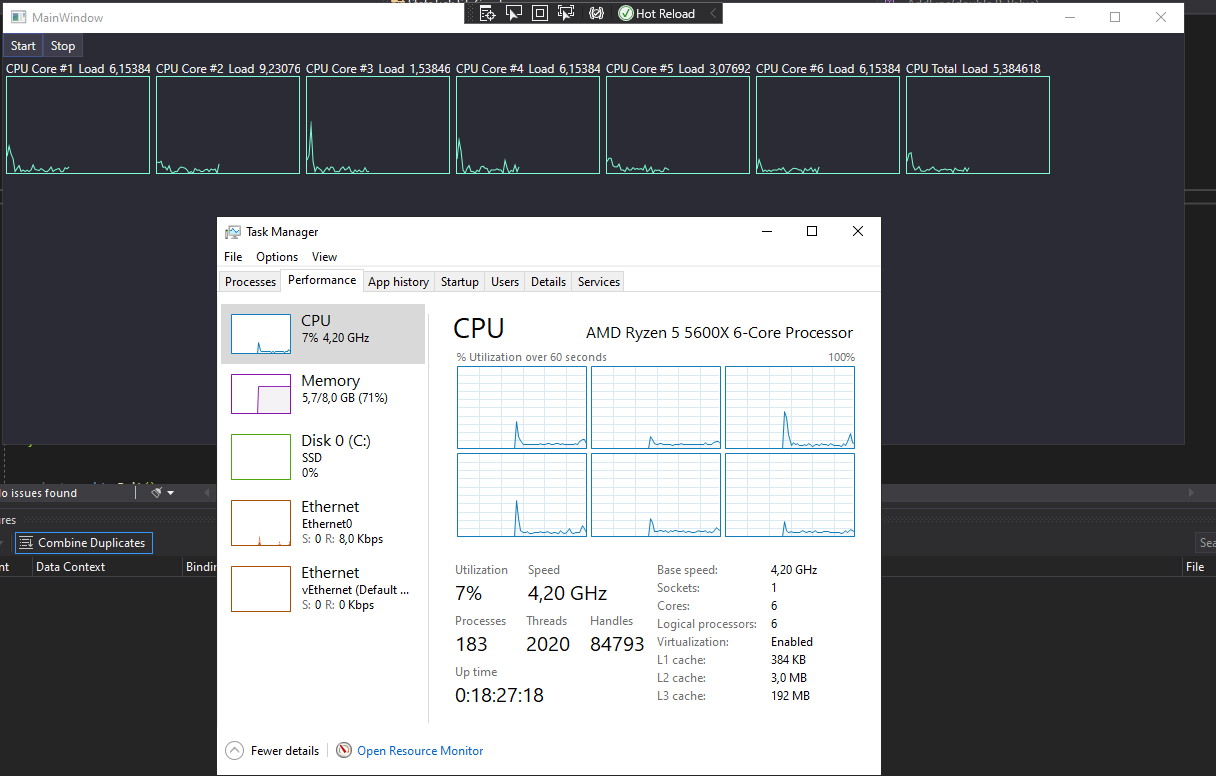
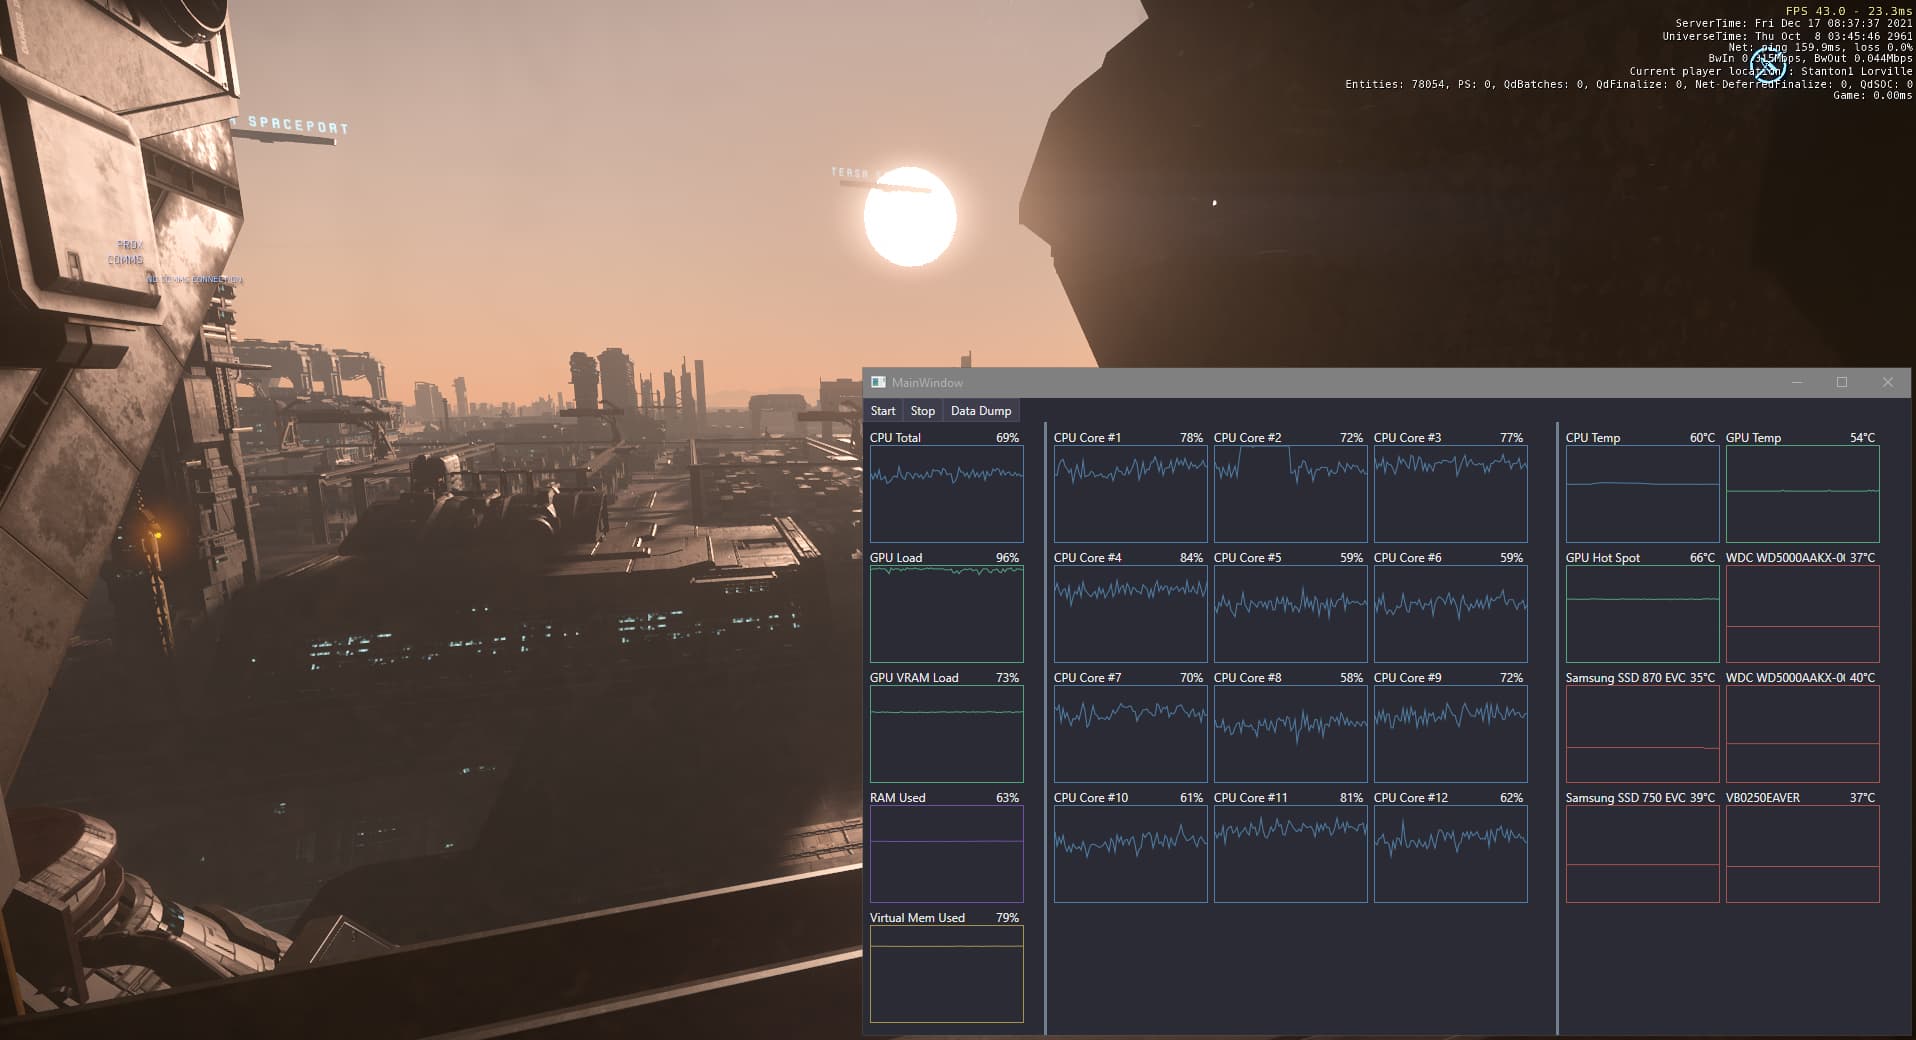
I want to add an option to show these stats live in a graph much like the Performance Tab in Task manager.
I want to be able to see which processes use the most CPU time and also be able to see which processes caused usage spikes. Thus the need for a DB.

I know this may end up using quite a bit of CPU cycles by it self, but the idea is not really to have it running all the time like you would with something like HWInfo64. This is for convenience and some light diagnostics use more than anything else and is something I’ve wanted for quite some time. I especially want the ability to see what caused a usage spike on a graph which Task manager does not have.

I’ve been using things like Hardware Monitor and HWInfo for years, but I’ve always been annoyed with the lack of dark mode and the lack of live graphs. It means that I have to use multiple apps to try and gauge what is going on while still not being able to see which processes caused a spike in usage on the graphs.

Again, the idea here is not to have this running all the time… although it will probably depend on how efficient I can make it. For the most part things like HWInfo64 is what you want to monitor temps, but quite often I want to log some more info regarding CPU usage.

Example: I recently tried Star Citizen during the free fly event and the Task manager graphs were actually very useful to see the effect on CPU and GPU usage when changing settings and modifying config files which resulted in quite the FPS boost in the end. Being able to see what is going on at a glance is what the live graphs are useful for.

I work mostly on back end systems which means my GUI-fu isn’t great. I did some quick experimentation with Photino, but quickly ran into performance issues.

I’m going to use C#, WPF, and SQLite since that is what I’m familiar with. Not much of a challenge there, I know, but I think getting this to chew as little CPU cycles as possible is where the challenge is going to be. I know from past experience that getting process info can eat quite a bit of CPU time. So this will probably be the main challenge.

EDIT 2021-12-24:
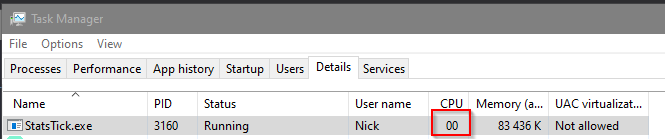
V1 is Done… although limited and is mostly written for my own use :stuck_out_tongue:

Git Link to V1: https://github.com/Nicks182/StatsTick

I ended up not logging to the SQLite DB. I felt that it didn’t really add much value and it would grow and take a huge amount of space if left unchecked. Figured it’s better to not have it at this time.

So far I’ve only had one bug related to the theme which I fixed.

2 Likes

Decided to use LibreHardwareMonitor to pull the basics like Load and Temps. Didn’t seem worth trying to reinvent the wheel here.

Since my GUI-fu isn’t great, the hardest part for me was actually figuring out how to draw a basic line graph. Sure, I can use some existing library, but that seems so overkill for what I want.

I’ve got the basics of it working, but I still need to figure out how to make it move to the left like it does in task manager and also remove points from the graph when they are not visible anymore. See image below.

Instead of showing all the graphs for each core in a line, I would like to see if I can make them fit the available space dynamically. In HTML I would use the CSS grid with auto columns and rows for this… would be nice if there is something like it in WPF… will see.

This is inside my Dev VM and the last Graph is the overall average.

2 Likes

Made some more progress this morning. Not 100% happy with the layout, but I think it’s functional.

CPU usage so far is tiny:
image

Still to do:
Network(s) graphs
Max and Min values
Add some customization settings. (Maybe a color picker to change the colors)
Pull Process info
Log all to DB (kinda there already)
History View (Maybe)

What it looks like currently:

What it looks like while running Star Citizen:

3 Likes

I’ve been looking into getting the process info today and as I suspected, doing something simple code wise is causing massive CPU spikes to try and get the CPU usage of each process.

It’s starting to look like I may have to recreate the behavior of the Task Manager’s Details tab to some extent. Will need to keep track of processes starting and stopping and managing the performance counters.

This seems redundant to me… the Task Manager already has this info. If I go and clone this behavior, my system would essentially be doing the work twice to get the same results. Once for the Task Manager, then again for my app.

Anyone know if there is a way I can Query/retrieve what is already on the Task Manager’s Details tab?

Decided to do a search using DuckDuckGo and found this:

https://social.msdn.microsoft.com/Forums/en-US/469ec6b7-4727-4773-9dc7-6e3de40e87b8/cpu-usage-in-for-each-active-process-how-is-this-best-determined-and-implemented-in-an?forum=csharplanguage

I tried it real quick and dirty like and it seems to work quite well. No CPU spikes and overall CPU usage it still mostly zero. I want to see what else I can do in that query to filter the results instead of getting everything and then filtering it in C#.

1 Like

Made some more progress. Been mostly struggling with UI stuff, but getting there. Changed how the graphs are being rendered. Basically I flipped them horizontally so their X zero point is now on the right. Much like changing the Direction on a HTML element. So all new points start at Zero and then just gets moved a long by 2px with every tick.

Made the overall CPU usage graph stretch the entire width at the top and added a scrolling bar beneath it showing the top 5 processes for that tick.

Also added Min and Max to the Graph Control.

Once points on the graphs or the Top 5 process blocks are not visible anymore they get removed so things don’t just pile up forever.

Getting the process info seems to work fine and is not causing any major CPU usage, but it can sometimes take over 20 seconds to respond the first time you run the query. This is a Windows thing and it seems we can’t do anything about it. After the first call it seems to respond instantly with subsequent calls. This is still 1000 times better than trying to use the build in DOTNET stuff, System.Diagnostics.Process.

That said, I’m not happy with the UI at all and will almost certainly change it or at least tune it a bit. Having it functional is more important than it being pretty, considering it’s purpose, but as it is I think it needs more work. Any suggestions are welcome.

TODO:
Finish logging to DB
History View
Change UI
Network Graphs
Maybe add some user customization.
lots of Code cleanup
Add to github

1 Like

Didn’t have time to work on this yesterday, but I thought about it a lot and I ended up making a few changes today. In fact, I basically rewrote it using a bit of hindsight.

Changed the theme
Remove logging to SQLite DB
Show or hide the Graphs while leaving the numbers on the screen.

I wasn’t really happy with the previous theme, I used it because it was convenient. Very few people make up to date themes for WPF, but the one I have now I think is OK.

I decided that logging to the DB doesn’t really have much value and it will need to be managed in someway so it doesn’t end up taking GBs worth of space.

In my testing today I got my brother to try it since he has an old 4th gen intel system. Sure enough, some things did not work as the names for certain Sensor values are not the same. So I added support for his system, but I’ll need to add something basic to allow a user to specify the sensor name if it’s not picked up automatically.

ToDo:
Allow user to customize what value a graph should look for. Eg: “Core (Tctl/Tdie)” or “CPU Package”

What it looks like now ( I hope vids are OK?):

1 Like

Added a settings window where the user can change what Sensor the graph is looking at and also allow the user to change the color of the graphs. Actually… I hacked it in which will be obvious when you look at the code :stuck_out_tongue:

Unfortunately, doing this revealed just how limited I made this app and I’m not happy with that. I will need to take a different approach where the user can choose what the app should show, where it should show it, and how it should show it. Basically a rewrite.

It’s not that hard to do, but I think the tricky bit for me will be setting up the gui in way the user can customize the layout. Please share if anyone has any suggestions or ideas on how I can make this happen. Maybe there’s already something I can use without having to create my own from scratch?

As it is now, it was written to be what I wanted and as such might not work for anyone else. I’m going to call this V1 and will look into doing a V2, but I don’t know if that will be done by end of the month.

Git Link to V1: https://github.com/Nicks182/StatsTick

1 Like

Found a bug in the DarkTheme I’m using. Changing focus to a checkbox using the Tab key caused the app to crash. Fixed it and updated Git.

I know devember is over, but I wanted to update this anyway. I’ve been using the app since my last update. In fact, I think right now it’s been running continuously for almost 2 weeks. I’ve not restarted my machine at all and I’ve not closed the app in that time and so far no issues.

My brother is also using it on his i7 4790 with no issues so far either.

Ever since I got my 5600x and finally moved over to Win10 from win 8.1, I would get these really weird stutters on youtube vids every couple of days or so. It would only last for about 2-3 seconds and it seems it’s only youtube as floatplane seems to be running perfectly fine.

Since I’m logging which processes are using the most CPU I was able to quickly check which process was at the top of the list as the stutter happens. So far… it’s been the Asus software for my GTX1660ti. It’s also not causing a massive spike… in fact, the graphs are barely showing a difference.

So not sure what it going on, but the app is already proving to be useful… at least for me. I’ve killed the Asus software and will see if the stutters go away.

1 Like

I am really impressed with this, I will give it a try probably.

1 Like